3.1 Geometry parameters- Dihedral angles
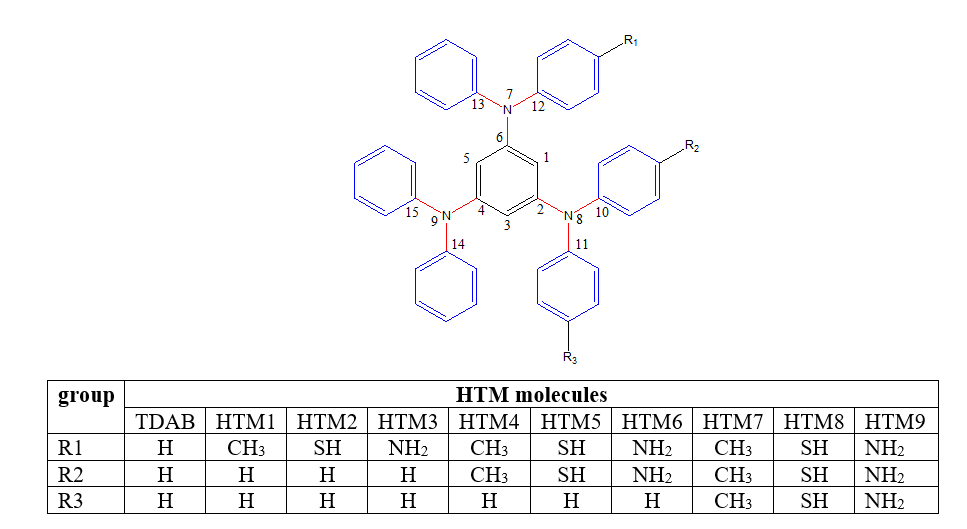
Six dihedral angles of the three connecting units to the central benzene ring were selected for the TDAB and HTM1-HTM9 at the ground state for gas and solvent optimization and are presented in Table 1. The optimized structures (Fig. 1) in the gas and solvent phase show that all molecules are non-planar with selected dihedral angles between 20o and 50o, and the non-planarity is due to the presence of sp3 hybridized nitrogen a connecting atom [22]. Removal or addition of an electron from a molecule causes a noticeable effect on the value of dihedral angle as observed in the gas phase in Fig. 2, where the larger dihedral angle of anion optimized molecules for the angle C1-C6-N7-C12was observed compared to the dihedral angle of the cation indicating that much higher reorganization energy is required for the formation of anion from neutral molecule compared to the formation of cation from the neutral molecule. The TDAB and HTM1-HTM9 quickly form cation than anion molecule, thus efficiently transporting holes than an electron.
Table 1
The dihedral angles for TDAB and HTM1-HTM9 in gas and acetonitrile solvent.
|
S/NO
|
SELECTED DIHEDRAL ANGLES
|
|
Θ1
|
Θ2
|
Θ3
|
Θ4
|
Θ5
|
Θ6
|
|
gas
|
solvent
|
gas
|
solvent
|
gas
|
solvent
|
gas
|
solvent
|
gas
|
solvent
|
gas
|
solvent
|
|
TDAB
|
46.30
|
44.21
|
46.30
|
44.21
|
40.31
|
40.68
|
38.64
|
38.95
|
40.30
|
40.67
|
38.63
|
-38.94
|
|
HTM1
|
39.35
|
39.71
|
39.38
|
39.29
|
43.92
|
43.49
|
42.22
|
41.63
|
43.32
|
42.81
|
41.21
|
41.20
|
|
HTM2
|
48.74
|
44.85
|
48.61
|
45.27
|
40.28
|
41.57
|
38.70
|
39.89
|
39.19
|
41.71
|
38.11
|
39.98
|
|
HTM3
|
34.05
|
36.20
|
32.46
|
35.19
|
48.06
|
44.88
|
45.64
|
43.17
|
46.94
|
43.42
|
44.81
|
41.88
|
|
HTM4
|
40.42
|
40.07
|
40.69
|
39.80
|
44.14
|
43.66
|
42.10
|
41.83
|
41.31
|
40.66
|
39.69
|
39.20
|
|
HTM5
|
46.66
|
44.70
|
46.12
|
45.21
|
38.07
|
39.76
|
36.38
|
38.09
|
42.14
|
45.50
|
40.33
|
43.25
|
|
HTM6
|
35.22
|
35.97
|
34.67
|
34.54
|
48.69
|
46.48
|
47.16
|
44.52
|
40.53
|
36.08
|
39.73
|
35.96
|
|
HTM7
|
44.54
|
42.01
|
44.57
|
42.00
|
41.73
|
42.82
|
40.19
|
40.92
|
39.10
|
38.12
|
37.61
|
36.68
|
|
HTM8
|
42.77
|
42.88
|
42.85
|
43.15
|
38.54
|
40.08
|
36.74
|
38.31
|
50.33
|
50.31
|
48.11
|
48.32
|
|
HTM9
|
41.55
|
39.23
|
41.67
|
38.06
|
50.65
|
48.90
|
48.52
|
47.17
|
26.09
|
21.37
|
26.49
|
19.93
|
3.2. Ionization potential and electron affinity
According to the following equations[23], to determine the ionization potential and electron affinity using the DFT approach.
IP = Ecation − Eneutral (1)
EA = Eanion − Eneutral (2)
During the working of the perovskite solar cell, after an electron has been excited from the valence band of the perovskite active layer, an electron from the HOMO of the HTM has to drop and fill the hole left in the valence band of the perovskite; thus the ionization potential of the HTM has to be considerably lower to favour the process of electron transfer the HTM to the perovskite active layer, hence hole transfer from perovskite material to the HTM [24]. The lower the IP value, the easy formation of holes in the molecules under study; From Fig. 3 the lowest IP value was obtained by HTM 9; thus, tri addition of -NH2 having a much contribution to the HOMO energy level has led to lower IP value[25].
3.3. Frontier molecular orbitals (HOMO-LUMO)
The HOMO and LUMO distributions and the energy levels of the structures examined are presented in Fig. 4 to help comprehend the electronic structure. In general, a good HOMO delocalization and an appropriate HOMO energy level relative to the valence band of perovskite are advantageous for improving the hole transfer integral and hole transport. The HOMO of the structures is estimated to be distributed over the entire molecule, whereas the LUMO is concentrated on the substitution core. It turns out that the HOMO is more broadly dispersed than the LUMO in the two derivatives, indicating that the derivatives have a good chance of being used as hole transport materials. Thus, energy and distribution of frontier molecular orbitals (FMOs) could be used to explain carrier transport features.
HOMO originated mainly from the entire molecule, while LUMO was primarily given by fragment A. As seen by the FMOs, HOMO delocalized approximately over the complete molecule for both molecules, while LUMO delocalized principally over fragment A for both. Hole transport is aided by the strengthening of the delocalization effect. There was also an increase in HTM/valence band overlaps between the HOMO of the TDAB as the HTM and the perovskite material, leading to enhanced charge extraction [24]. HTM9, which is produced by adding –NH2 to TDAB in tri addition, has the greatest HOMO level, as seen in Figure 2. Due to the existence of two lone pairs, HTM 2, HTM 5, and HTM 8 deviate from the increasing trend of HOMO energies due to increases and in the strength of the electron-donating group attached. HTM 8 has the lowest HOMO energy level of all the compounds under research and the spiro-OMeTAD, indicating a favorable overlap with the MAPbI3 perovskite active layer, according to the study.
3.4 Bandgap energy
The quantities of HOMO energy (EHOMO), LUMO energy (ELUMO), and their energy gap (H–L) were determined to understand the effect of the electrical characteristics better. Energy gaps represent the difference between HOMO and LUMO levels. The smaller the energy gap, the more likely the electronic transition [26–28], and the energy gap can be calculated using the following formula:
$${\Delta _{H - L}}=\left| {HOMO - LUMO} \right|$$
1
The calculated HOMO, LUMO and ∆H−L values TDAB and HTM1-HTM9 are listed in Table 2. The FMOs of TDAB and the designed HTM1-HTM9 must be compared to the MAPbI3 perovskite molecule shown in Fig. 5, which has HOMO energy of -5.44eV and LUMO energy of -4.0 eV, and the spiro-OMeTAD, which is currently in use and has HOMO energy of -5.07eV. The LUMO energy levels for the TDAB and HTM1-HTM9 were all above the LUMO energy level of the MAPbI3 perovskite active layer and hence prevention of an electron excited from the valence band (VB) of the perovskite to the conduction band (CB) of the perovskite to fall in LUMO energy level of the HTM instead of the CB of the electron transport material.
Table 2
HOMO, LUMO and bandgap energy in eV for TDAB and HTM1-HTM9.
|
Molecules
|
GAS
|
ACETONITRILE
|
|
HOMO
|
LUMO
|
BAND GAP
|
HOMO
|
LUMO
|
BAND GAP
|
|
TDAB
|
-5.08
|
-0.77
|
4.30
|
-5.27
|
-0.97
|
4.30
|
|
HTM1
|
-5.02
|
-0.76
|
4.26
|
-5.23
|
-0.96
|
4.26
|
|
HTM2
|
-5.19
|
-0.88
|
4.31
|
-5.33
|
-1.03
|
4.31
|
|
HTM3
|
-4.81
|
-0.68
|
4.13
|
-5.01
|
-0.93
|
4.09
|
|
HTM4
|
-4.99
|
-0.73
|
4.26
|
-5.21
|
-0.94
|
4.27
|
|
HTM5
|
-5.28
|
-0.99
|
4.29
|
-5.35
|
-1.08
|
4.27
|
|
HTM6
|
-4.66
|
-0.53
|
4.13
|
-4.96
|
-0.86
|
4.09
|
|
HTM7
|
-4.95
|
-0.70
|
4.25
|
-5.17
|
-0.92
|
4.25
|
|
HTM8
|
-5.39
|
-1.12
|
4.27
|
-5.37
|
-1.12
|
4.25
|
|
HTM9
|
-4.40
|
-0.36
|
4.03
|
-4.79
|
-0.73
|
4.06
|
When the sun illuminates the PSC, electrons must be ejected from the perovskite active layer whose band energy gap is 2eV or less. For the HTM, the band energy gap has to be more than 2eV to avoid the parasitic loss of energy from the sun. The TDAB and HTM 1-9 show a band energy gap of between 4.0 to 4.3eV; thus, the low parasitic loss is expected to occur when used with the perovskite material. The solvent acetonitrile does not affect the band energy gap, as observed in Figure 6. On the other hand, HTM3, HTM6and HTM9, which mono, di, and tri substitution of –NH2 respectively, were have lower values of band energy gaps. This has been due to the highest HOMO energy levels attained because the –NH2 is the most influential electron-donating group among the selected groups and with a smaller bandgap, a redshift is expected to occur [29].
3.5 Charge transport properties
The reorganization energy (λh/e ) refers to the energy change of the system, which is caused by the structural relaxation after the gain or loss of electrons. After a molecule has gained or lost an electron to form an anion or cation, the energy required for geometry modification is called reorganization energy. A change in dihedral angle gives a good prediction of a molecule's reorganization energy, but the reorganization energy of a molecule is inversely proportional to the charge mobility of the molecule. Thus lower reorganization energy of holes is a relevant factor for a hole transport material [30]. The reorganization energy is of two types: reorganization energy for the hole(λh) and electronic reorganization energy(λe). To optimize the anions and cations of the TDAB molecule and its derivatives to get the reorganization energies. The λh and λe energies calculated using the following equations[31–33]:
$${\lambda _h}=(E_{0}^{+} - {E_+})+(E_{+}^{0} - {E_0})$$
2
$${\lambda _e}=(E_{0}^{ - } - {E_ - })+(E_{ - }^{0} - {E_0})$$
3
Where \(E_{0}^{+}\)(\(E_{0}^{ - }\))denotes the energy of cations (anions) resultant by optimizing the structure of neutral molecules. \({E_+}\)(\({E_ - }\)) is the cation (anion) energy calculated using the optimized cation (anion) structure. \(E_{0}^{+}\)(\(E_{0}^{ - }\)) is the neutral molecular energy determined in the cationic (anionic) state. E0 denotes the energy of the neutral molecule in its ground state. The calculated reorganization energies of the hole for HTM1-HTM9 are present in Table 3 and show in Fig. 7. From the Table 3, the order of hole reorganization energies are as follows: HTM8 > HTM9 > HTM3 > HTM5 > HTM6 > HTM2 > HTM7 > TDAB ≈ HTM1 > HTM4.
Table 3
Charge transfer integral (V), Reorganization energies (λ), and charge transfer rate (K) for the TDAB and HTM1-HTM9.
|
molecule
|
λholes
(eV)
|
λelectrons (eV)
|
λTotal
(eV)
|
Vholes (eV)
|
Velectrons (eV)
|
K(holes)
(s−1)
|
K (electrons)
(s−1)
|
|
TDAB
|
0.170
|
0.315
|
0.484
|
0.022
|
0.017
|
3.93E+12
|
3.99E+11
|
|
HTM1
|
0.165
|
0.307
|
0.472
|
0.040
|
0.028
|
1.36E+13
|
1.17E+12
|
|
HTM2
|
0.252
|
0.340
|
0.592
|
0.005
|
0.004
|
6.18E+10
|
1.42E+10
|
|
HTM3
|
0.340
|
0.294
|
0.634
|
0.114
|
0.042
|
1.36E+13
|
3.07E+12
|
|
HTM4
|
0.159
|
0.309
|
0.468
|
0.032
|
0.020
|
9.42E+12
|
5.80E+11
|
|
HTM5
|
0.295
|
0.299
|
0.594
|
0.020
|
0.013
|
6.72E+11
|
2.67E+11
|
|
HTM6
|
0.274
|
0.297
|
0.571
|
0.051
|
0.028
|
5.83E+12
|
1.31E+12
|
|
HTM7
|
0.170
|
0.316
|
0.486
|
0.035
|
0.015
|
9.58E+12
|
2.96E+11
|
|
HTM8
|
0.469
|
0.333
|
0.802
|
0.051
|
0.011
|
6.57E+11
|
1.38E+11
|
|
HTM9
|
0.350
|
0.338
|
0.688
|
0.106
|
0.011
|
1.06E+13
|
1.21E+11
|
From Table 3, we can find that λhole of HTM4, HTM1 and HTM7 (0.159,0.165 and 0.170 eV, respectively) are smaller than other respective HTMs. Furthermore, it was observed that HTM 1, HTM 4 and HTM 7 with mono, di and tri substitutions of the –CH3, respectively; this means that HTM4, HTM1 and HTM7 their hole transfer rate might be higher than other HTMs. Comparing λhole and λelec values of the four HTM4, HTM1, HTM2 and HTM7 indicate that the λhole< λelec. This also implies that the hole carrier mobility of such HTMs is greater than the electron carrier mobility. This means that these chemicals have the most significant hole-transporting potential.
3.6. Charge transfer rate (K)
It is widely known that reorganization energy (λ) no single parameter can explain the nature of charge transfer; consequently, we estimated the hole and electron transfer integrals and the intrinsic mobilities. The hole mobility of nine molecules was investigated using the Marcus theory. Marcus theory has been frequently used to determine the hole hopping rate (Kh) at room temperature, which may be stated as [34, 35]:
$${k_h}=\frac{{{V^2}}}{\hbar }{\left( {\frac{\pi }{{{\lambda _h}{k_B}T}}} \right)^{1/2}}\exp \left( {\frac{{ - {\lambda _h}}}{{4{k_B}T}}} \right)$$
4
V is the charge transfer integral, h is the reorganization energy, kB is the Boltzmann constant, while T is the temperature (we usually use T = 300 K.) [36, 37]. According to the preceding equation, the hole hopping rate Kh is influenced by two crucial parameters: V and λ are broken into two parts: the electron transfer integral Ve and the hole transfer integral Vh [38]. The specific structure of molecular stacking is difficult [39–40], but the level-splitting approach gives good accessibility to face-to-face stacking [40], and this configuration can improve − coupling [41]. Vh is the hole transfer integral, and it can be calculated as follows [42–46]:
$${V_h}=\frac{{{E_{HOMO}} - {E_{HOMO - 1}}}}{2}$$
5
Vh is hole transport integral, EHOMO and EHOMO−1 are the HOMO level and HOMO-1 level of face-to-face model HTMs dimer [40]. For a good HTM, the hole transfer rate must be more than the electron transfer rate in magnitude to ensure effective charge extraction and transfer to prevent electron and hole recombination. From Table 3 and Fig. 8, HTM 9, having the highest hole transfer rate compared to other molecules, is not suitable as HTM because of its higher magnitude of the electron transfer rate. Thus HTM6 showed the highest hole transfer rate of 1888.5 x 10−10 s−1 with a minimum magnitude of the electron transfer rate.
3.7 Absorption spectra
The absorption properties were characterized using the TD-DFT method with a 6-311G basis set on the ground state optimized structures in both gas and solvent (acetonitrile) to obtain information about the involved in the electronic transitions. The calculated maximum absorption wavelength (λmax)of TDAB and HTM1-HMT9 in the gas and solvent state are listed in Table 4.
Table 4
The ground state maximum absorption (λ max ) wavelength of TDAB and HTM1-HTM9 in gas and acetonitrile.
|
GAS PHASE
|
SOLVENT PHASE
|
|
#
|
λmax
|
f
|
orbital contribution
|
% value
|
#
|
λmax
|
f
|
orbital contribution
|
% value
|
|
TDAB
|
337.47
|
0.0096
|
H-1 ->L+1
|
32.44
|
TDAB
|
346.31
|
0.0172
|
H-1 ->L+1
|
27.0539
|
| |
|
|
H ->L
|
64.11
|
|
|
|
H ->L
|
69.62
|
|
HTM1
|
339.12
|
0.0149
|
H-1 ->L+1
|
23.99
|
HTM1
|
348.25
|
0.0253
|
H-1 ->L+1
|
18.43581
|
| |
|
|
H ->L
|
72.01
|
|
|
|
H ->L
|
75.975
|
|
HTM2
|
337.54
|
0.003
|
H-1 ->L
|
6.42
|
HTM2
|
346.22
|
0.0084
|
H-1 ->L
|
37.81021
|
| |
|
|
H-1 ->L+1
|
37.49
|
|
|
|
H-1 ->L+1
|
5.233907
|
| |
|
|
H-1 ->L+2
|
2.03
|
|
|
|
H-1 ->L+2
|
2.262065
|
| |
|
|
H ->L
|
35.47
|
|
|
|
H ->L
|
18.87191
|
| |
|
|
H ->L+1
|
11.44
|
|
|
|
H ->L+1
|
30.78927
|
| |
|
|
|
|
HTM3
|
357.99
|
0.0377
|
H-1 ->L+1
|
4.929172
|
|
HTM3
|
344.77
|
0.0285
|
H-1 ->L+1
|
7.93
|
|
|
|
H ->L
|
85.60338
|
| |
|
|
H ->L
|
82.05
|
|
|
|
H ->L+1
|
3.401875
|
|
HTM4
|
339.21
|
0.0108
|
H-1 ->L
|
2.39
|
HTM4
|
348.29
|
0.0176
|
H-1 ->L
|
6.48216
|
| |
|
|
H-1 ->L+1
|
26.27
|
|
|
|
H-1 ->L+1
|
18.87191
|
| |
|
|
H ->L
|
65.05
|
|
|
|
H ->L
|
63.35102
|
| |
|
|
H ->L+1
|
2.80
|
|
|
|
H ->L+1
|
7.846345
|
|
HTM5
|
337.79
|
0.0076
|
H-1 ->L
|
15.69
|
HTM5
|
346.48
|
0.0184
|
H-1 ->L
|
28.48011
|
| |
|
|
H-1 ->L+1
|
24.49
|
|
|
|
H-1 ->L+1
|
7.790194
|
| |
|
|
H ->L
|
41.03
|
|
|
|
H ->L
|
33.2977
|
| |
|
|
H ->L+1
|
11.25
|
|
|
|
H ->L+1
|
24.44403
|
| |
|
|
H ->L+3
|
2.18
|
HTM6
|
354.85
|
0.0087
|
H-2 ->L
|
2.128397
|
|
HTM6
|
344.09
|
0.006
|
H-1 ->L
|
28.42
|
|
|
|
H-1 ->L
|
30.96845
|
| |
|
|
H ->L
|
13.38
|
|
|
|
H ->L
|
16.57843
|
| |
|
|
H ->L+1
|
51.71
|
|
|
|
H ->L+1
|
45.42189
|
|
HTM7
|
226.63
|
0.0019
|
H-2 ->L+8
|
3.44
|
HTM7
|
349.1
|
0.0165
|
H-1 ->L
|
11.045
|
| |
|
|
H-2 ->L+11
|
2.52
|
|
|
|
H-1 ->L+1
|
16.00422
|
| |
|
|
H-1 ->L+1
|
14.96
|
|
|
|
H ->L
|
55.93223
|
| |
|
|
H-1 ->L+6
|
8.61
|
|
|
|
H ->L+1
|
13.37583
|
| |
|
|
H-1 ->L+9
|
3.47
|
HTM8
|
346.95
|
0.0226
|
H-1 ->L
|
19.90679
|
| |
|
|
H ->L+2
|
14.58
|
|
|
|
H-1 ->L+1
|
3.794462
|
| |
|
|
H ->L+3
|
5.61
|
|
|
|
H ->L
|
27.91689
|
| |
|
|
H ->L+7
|
6.18
|
|
|
|
H ->L+1
|
41.68575
|
| |
|
|
H ->L+10
|
3.71
|
HTM9
|
358.64
|
0.0184
|
H-1 ->L+1
|
5.763013
|
|
HTM8
|
355.67
|
0.0099
|
H-1 ->L+1
|
23.39
|
|
|
|
H ->L
|
65.00052
|
| |
|
|
H ->L
|
70.78
|
|
|
|
H ->L+1
|
22.36066
|
|
HTM9
|
351.69
|
0.0151
|
H-1 ->L+1
|
6.16
|
|
|
|
|
|
| |
|
|
H ->L
|
88.22
|
|
|
|
|
|
The absorption spectrum of each HTM is represented in Fig. 9&10, the absorption of TDAB and HTM1-HMT9 in the gas phase was observed to occur within the UV region; thus, no absorption occurred in the visible region that will cause a parasitic loss due to decreased amount of energy from the sun to cause the excitation in the perovskite active layer. Instead, all the energy from the sun in the visible region of the spectrum will cause electron transitions in the perovskite active layer. Thus the TDAB and HTM1-HMT9 are transparent in the visible region of the spectrum in gas-phase calculations, with HTM 7 having the lowest value of λ max. A redshift was also observed in solvent phase calculations, and this can be explained by the use of high dielectric constant solvent, acetonitrile, which contributes to the electron density, causing a decrease in the band gap.