4.1 Location of the sVLFE clusters
The W area is located offshore between the outer ridge and the outer wedge regions (Figure 2b). Based on tectonic surveys, this region has a thick shear zone resulting from the accumulation of underthrust sediment near the plate boundary (e.g., Tsuji et al. 2014). Full-wave inversions of the active seismic data (Kamei et al. 2013) and receiver function analyses (Akuhara et al. 2020) suggest that this thick shear zone is rich in fluid. Based on these previous studies, we considered that the existence of pore fluids could have promoted sVLFE activity in the W area during this episode. Shiraishi et al. (2020) proposed that the distribution of sVLFE activity is controlled by the subduction of small-scale ridges. The most active part of the W area corresponds to the area where an sVLFE cluster was observed during the 2016 episode; these events were located on the down-dip side of a subducted ridge. This indicates that the dominant sVLFE region might be controlled by structural heterogeneities, such as the geometry of the plate interface, and that structural heterogeneities cause micro-scale heterogeneities of the pore fluid distribution.
The outer wedge up-dip of the E area has a thin shear zone according to the MCS reflection survey (Figure 8 of Hendriyana and Tsuji 2021). Hendriyana and Tsuji (2021) analyzed in detail tremors that occurred in 2015 and 2016 and proposed that the difference in the thickness of the share zone controls the tremor activity; tremors did not directly occur below the outer wedge in the E area, which has a thin shear zone. Toh et al. (2020) hypothesized that the absence of sVLFE activity up-dip of the E area is due to the presence of the paleo-Zenith Ridge, which suppresses fluid flow from down-dip, and that this ridge forms a fracture network on the upper plate. Our results do not contradict either hypothesis. In addition, if the existence of the subducted paleo-Zenith Ridge suppresses the fluid flow from down-dip, as proposed by Toh et al. (2020), the plate interface beneath the outer ridge area should accumulate fluid. In this case, the fluid from down-dip does not reach the outer wedge area. This heterogeneous distribution of fluids might be related to the active sVLFEs at the outer ridge, as well as the inactivity at the outer wedge in the E area.
4.2 Migration of sVLFE activities
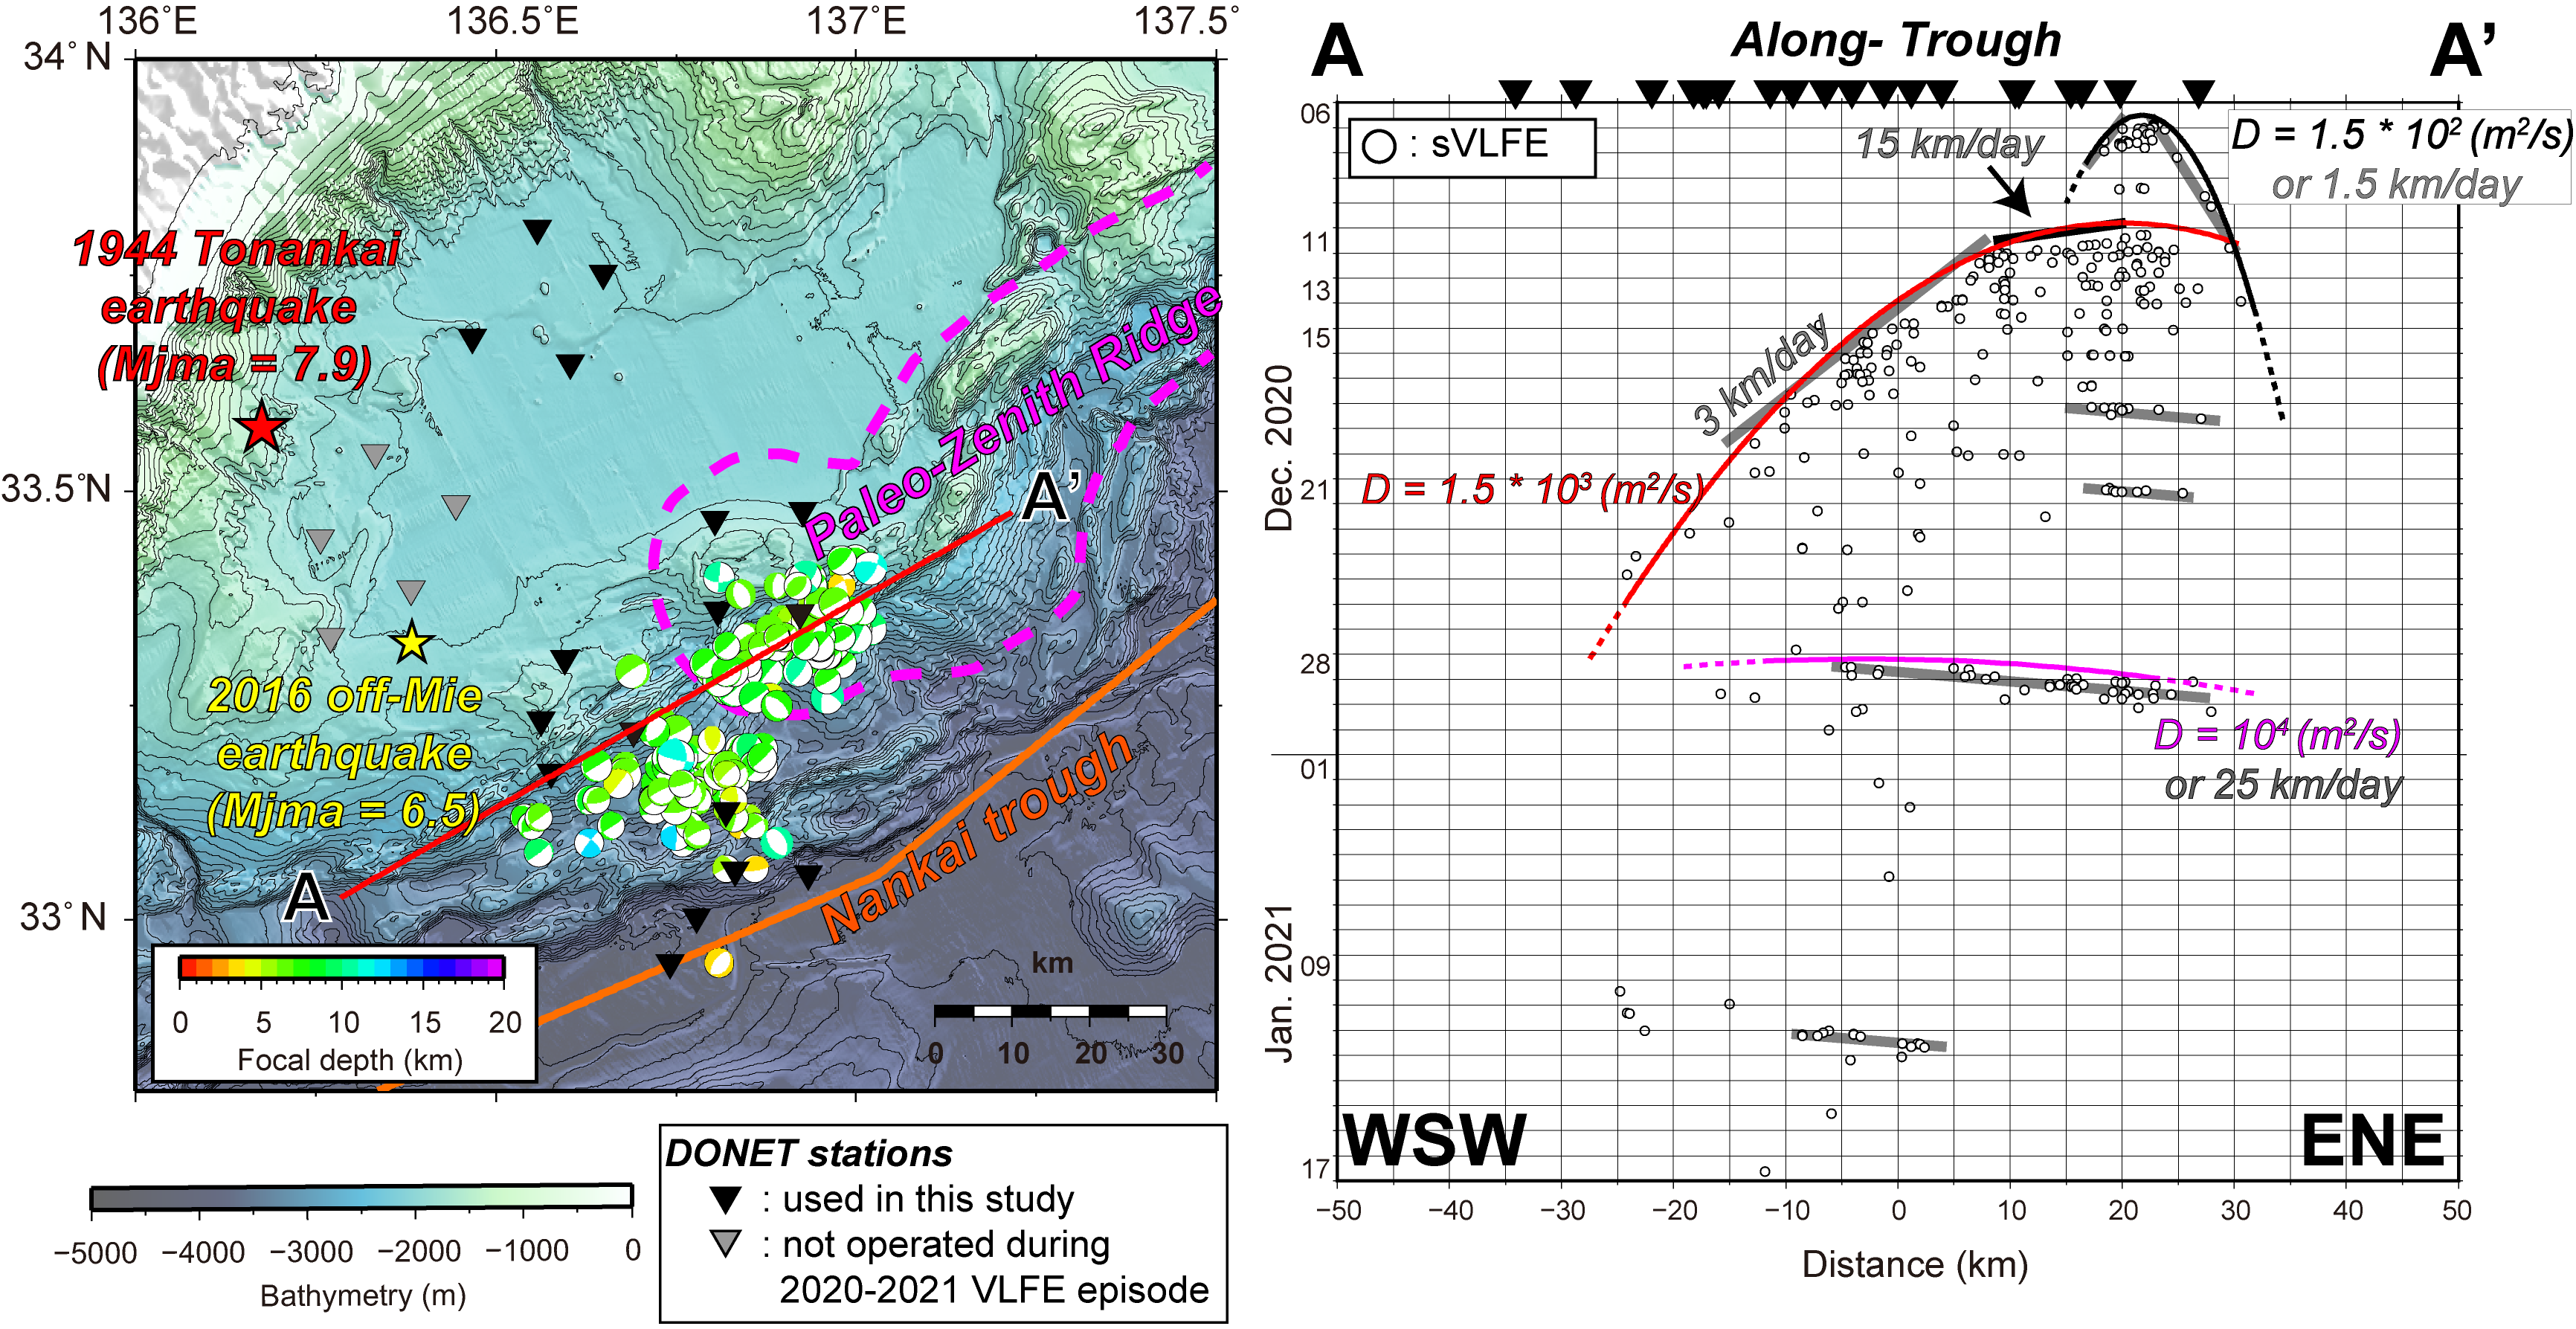
Slow earthquakes, including sVLFEs, often show migration, and most researchers believe that this is due to the diffusion of pore fluid or stress (e.g., Ide 2010; Kato and Nakagawa 2020); however, constant velocity migration sometimes occurs (e.g., Yamashita et al. 2015). The diffusion coefficient D is used to express the rate of the spatial evolution as , where t denotes the time. The April 2016 sVLFE activity can be well fitted with D = 3 × 10³ m2 s−1 (the blue dotted line in Figure 3a) or 4 km day−1 in both the along-trough and along-dip directions (Nakano et al. 2018).
In the activity during Stage 1, in the E area, studied here, D = 1.5 × 10² m2 s−1 (the black line in Figure 3a) or 1.5 km day−1 fits the expansion front of the activity area well in both the trough-parallel and trough-orthogonal directions (Figure 3a and b). During Stages 2–4 of the activity in the W area, the spatio-temporal distribution of the sVLFEs projected in the along-trough direction can be fitted with D = 1.5 × 10³ m2 s−1 (the red line in Figure 3a) via diffusion. If we assume a linear velocity for the migration front, 15 km day−1 for Stage 2 and 3 km day−1 for Stages 3 and 4 are obtained. The migration in the along-dip direction is not as clear. As can be seen, the rate of area expansion is larger in the W area than in the E area.
The migration velocity may be related to the pore pressure and the energy released during the activity. Kano et al. (2018) carefully investigated deep tremor activities and demonstrated that, at locations where the migration velocity is small, the released energy per event is small, the pore fluid pressure is high, and the number of tremors is large, and vice versa. The E area had a slower migration velocity (Figure 3a and b), lower released energy per event, and larger number of sVLFE occurrences compared with the W area (Figure 2b and d). Even though we do not have sufficient information on the values of the fluid pressure, the fluid pressure may be higher in the E area than in the W area if we assume that the relationship obtained by Kano et al. (2018) applies here.
If the relationships between the number of events, moment release per event, and migration velocity observed in this study always hold at the same locations, the conditions for sVLFE occurrence, such as the fluid pressure and stress state, are defined by the location. However, the rate of area expansion is different from past activities even in the same activity area. For example, in the W area, the diffusion coefficient was slightly smaller than that observed in April 2016. The 2016 sVLFE activity was triggered by the April 1, 2016, off-Mie earthquake (Mw = 6.5) on the down-dip side of the western active area (Nakano et al. 2018), whereas the episode investigated here occurred spontaneously. This difference might reflect a temporal change in the stress level or the coupling status around the plate boundary in the source area. Another possibility is that these activities migrated in opposite directions; the 2016 activity started at the western edge of the activity area (distance = −25 km in the along-trough direction plot of Figure 3a). In this case, the migration velocity might also depend on the migration direction. Even though we cannot currently identify why the migration velocities are different, these observations provide a constraint on mechanical models of sVLFE occurrence.
Migrations with much higher velocities than the activity front toward the northeast, opposite to the direction of the activity area expansion, occurred in Stage 5. This is similar to the rapid tremor reversal (RTR; Houston et al. 2011) observed in tectonic tremor activity. We refer to this migration as RTR in this study because of their similarities. The migration is well fitted with a constant velocity of approximately 25 km day−1 or a diffusion coefficient of D = 104 m2 s−1 (the pink line in Figure 3a). Other RTR-like swarm activities occurred in the E area during Stage 4 and in the W area during Stage 6, with locations close to the ending and beginning points, respectively, of the RTR in Stage 5 (Figure 3b) with very similar migration speeds. Therefore, we assume that these swarms share the nature of the main RTR, and we refer to them as sub-RTR activity (Figure 3). By taking a closer look at the main RTR activity using the source locations obtained in this study with Kagan angles of less than 30°, it can be observed that the migration consists of two groups on lines approximately 10 km apart (Figure 3b) and that their activities occurred simultaneously. These features suggest that the main RTR occurred with some width in the direction orthogonal to the direction of propagation. The occurrence of these RTR-like activities may indicate a temporal change in the propagation efficiency of the fluid pressure and/or the stress level during this episode or the existence of pore-pressure waves in the plate interface (Cruz-Atienza et al. 2018).
The main RTR and sub-RTR-3 were also reported in a land-based analysis (Takemura et al. 2021), in which the migration velocity was twice as large as that in this study. This difference could be explained by the difference in the location accuracy between the two catalogs. When we compare our sVLFE catalog with that of Takemura et al. (2021) and consider common events as those with a difference in occurrence time within 10 s, 75 events can be matched. In general, the sVLFE distribution of these events based on the catalog of Takemura et al. is wider than that in our result, and the average horizontal differences are 0.06° and 0.07° in longitude and latitude, respectively. From this comparison, we conclude that the difference in the migration speeds estimated here and by Takemura et al. (2021) is the result of the different accuracies of the locations in the two catalogs.
4.3 Possible sVLFE activities close to the trough axis
The sVLFEs for which a CMT solution was accurately obtained in this study are primarily distributed in the area surrounded by stations of Nodes B, C, and D (Figure 2). Activity south of the KMC stations close to the trough axis was rare. Only during Stage 6 were a few sVLFEs observed. In addition, the activity in this region was not detected during the past episodes in November 2015 or April 2016 (Nakano et al. 2018). Beneath the Node C stations, the low-velocity zone in the accretionary prism is thinner than that beneath the KMB and KMD stations (Tonegawa et al. 2017). Tonegawa et al. suggested that sVLFEs are activated in sporadically distributed low-velocity and mechanically weak volumes within the accretionary prism where fluids significantly reduce the shear strength of the faults. In that case, the sVLFE activity should be higher between the KMB and KMD stations than near the KMC stations, which is consistent with the sVLFE distribution during this episode and that in 2016 (Figure 2a and b).
However, we observed low-frequency signals that were very similar to sVLFEs (Figure 5a) at station KMC21, which is closest to the trough axis (Figure 2a). Visual detections of similar signals during the sVLFE episode demonstrated that their activity peaked in the middle of January 2021, during Stage 6 just after sub-RTR-3 (Figure 3), and continued until February 2, 2021 (Figure 5b). One of these events corresponds to an ordinary earthquake detected by the Japan Meteorological Agency; however, others do not. As these signals were not detected at other stations in most cases, we could not estimate their locations or focal mechanisms. However, these observations imply the occurrences of small-scale sVLFEs close to the trough axis. Because the up-dip side of the sVLFE activity area is important for tsunami source predictions, this activity needs to be carefully monitored. From the correspondence between the SSE and sVLFEs (Nakano et al. 2016), the investigation of the up-dip end of the sVLFE activity is also important to determine how shallow of a depth the background SSE reached.