Patients
All consecutive patients with CHB (hepatitis B surface antigen positive for more than 6 months), who underwent liver biopsy from May 2016 to January 2021 at Shenzhen Third People’s Hospital (SZTPH), Shenzhen, China, were studied. The patients who had received US B-mode examination, and LSM via point-shear-wave elastography (P-SWE) within one week prior to liver biopsy were included. Exclusion criteria were: (a) age less than 18 years; (b) received antiviral treatment in 6 months prior to liver biopsy; (c) combined with any other liver diseases, including autoimmune hepatitis, alcoholic liver disease, ascites, and HCC; (d) co-infection with any other viral hepatitis; (e) liver samples smaller than 10 mm or containing less than 6 portal tracts; (f) missing required serological results; (g) unsuccessful P-SWE. According to the eligibility criteria, we successfully enrolled 385 patients, among which 284 patients who had complete data required were finally included for analysis (Figure 1). This study was approved by the ethics committee of SZTPH. Written informed consent was obtained from each enrolled patient.
US B-mode and P-SWE Examinations
A conventional US examination followed by a P-SWE was conducted after the patient had undergone an overnight fast (at least 8 hours). The examinations were performed by using one of the following two US systems: Philips iU22, and Mindray Resona7. Both systems have the function of P-SWE and are routinely used in SZTPH. For the conventional US examination, a linear-array probe (L9-3 for Philips iU22, L11-3U for Mindray Resona7) was used to capture US B-mode images of the liver surface, while a convex-array probe (C14L5 for Philips iU22, SC6U-1 for Mindray Resona7) was used to capture B-mode images of the liver parenchyma and spleen. During the examination, the patient was instructed to maintain the supine position with both hands extended to the head, and static B-mode images were scanned. Right after the conventional US examination, the patient was required to maintain the supine position with right arm at maximum abduction. Then, the sonographer changed the scanning mode to P-SWE for LSMs. Among the included 284 patients, 155 received examinations on the Philips system, and the rest (n = 129) received examinations on the Mindray system.
Clinical Data Acquisition
The clinical data used in our study include patient demographic and serological parameters, which were determined on the same day of US examinations. The demographic data contain five parameters, including sex, age, height, weight, and body mass index. The serological data comprise eighteen parameters18,19, as follows: peripheral platelet count (PLT), alanine aminotransferase (ALT), aspartate aminotransferase (AST), gamma-glutamyltransferase (GGT) level, serum albumin (ALB), alkaline phosphatase (ALP), glucose (GLU), total cholesterol (TC), total bilirubin (TB), triacylglycerol, uric acid (UA), C-reactive protein (CRP), and serous markers of hyaluronic acid (HA), amino terminal of procollagen type III peptide (PIIIP), collagen type IV (CIV), laminin (LN), AST/PLT, and AST/ALT.
Pathological Examination
The pathological examination was performed within less than one week following the US examination. A US-guided percutaneous liver biopsy on the right liver lobe was performed by using a 16-gauge biopsy needle (MC1616 [16G, 16cm], BARD, New Jersey, USA). The biopsied liver sample was 10-20 mm in length, containing at least 6 portal areas, which was made into paraffin sections and stained with Sirius Red (S1020, Wuhan Haotian Bioscience Technology Limited Company, Hubei, China). Liver fibrosis was semi-quantitatively assessed according to the METAVIR system4, and grades ≥F2 indicated significant fibrosis. The pathological results served as ground truth for the subsequent model training and validation.
Model Development
We devised a deep learning-based data integration network (DI-Net) to fuse the information of US images of liver parenchyma, liver stiffness values and patients’ clinical parameters for diagnosing ≥F2 in the included CHB patients. The DI-Net (Figure 2) has two branches: Branch-1 and Branch-2, respectively with input of B-mode image of liver parenchyma and clinical + LSM data. Branch-1 is a DCNN model backboned by ResNet5020 for automatic extraction of deep features from B-mode images (the feature set is termed as B, 512 in size, see details in the Supplementary Material). Branch-2 compacted the clinical parameters (C) and liver stiffness values (S) into a single feature vector (C+S, 23 in size). At the backend of the model (Figure 2, Step-3), the two branch features were fused via an efficient feature fusion module which consists of three feature units (FUs). The first FU, FU-1, has two fully-connected (FC) layers with the number of neurons reduced from 512 to 23, such that the B features stemming from Branch-1 can be condensed to a feature set with a dimension matched with the number of C+S parameters. The second FU, FU-2, also has two FC layers, and the number of neurons for each layer is identical to that of the C+S parameters. As such, the C+S parameters can be combined internally first to enhance their associations with the class labels prior to the fusion with the B features. Finally, the feature vectors output from FU-1 and FU-2, each with a size of 23, were concatenated together by FU-3 to yield a comprehensive feature set (46 in size), which was then processed by two FC layers (the number of neurons are 46 and 2, respectively, see Step-4 of Figure 2) for predicting the ultimate class labels: ≥F2 or <F2.
Model Training and Validation
Patients were divided into two cohorts according to the US systems under which they received examinations. The patients who underwent examinations on the Philips system (n = 155) contributed to a main cohort, and the corresponding data yielded an internal dataset for model training and cross-validation. The remaining patients who underwent examinations on the Mindray system (n =129) served as an independent cohort, and the corresponding data yielded an additional dataset for external validation of the model trained on the internal dataset.
We used five-fold cross-validation to train and validate the DI-Net on the internal dataset. Specifically, the data in the internal dataset was divided into five subsets with no patient overlap, among which three subsets was used for training (see details in the Supplementary Material), one of the remaining two subsets for model optimization, and the rest for validation. By altering the training, optimization and validation folds five times, each fold was tested once. The models trained in the internal dataset were additionally validated on the external dataset. As there were five models trained on the internal dataset through cross-validation, the class probabilities predicted by the models were averaged for final decision making in the external validation.
Evaluation Metrics and Comparative Methods
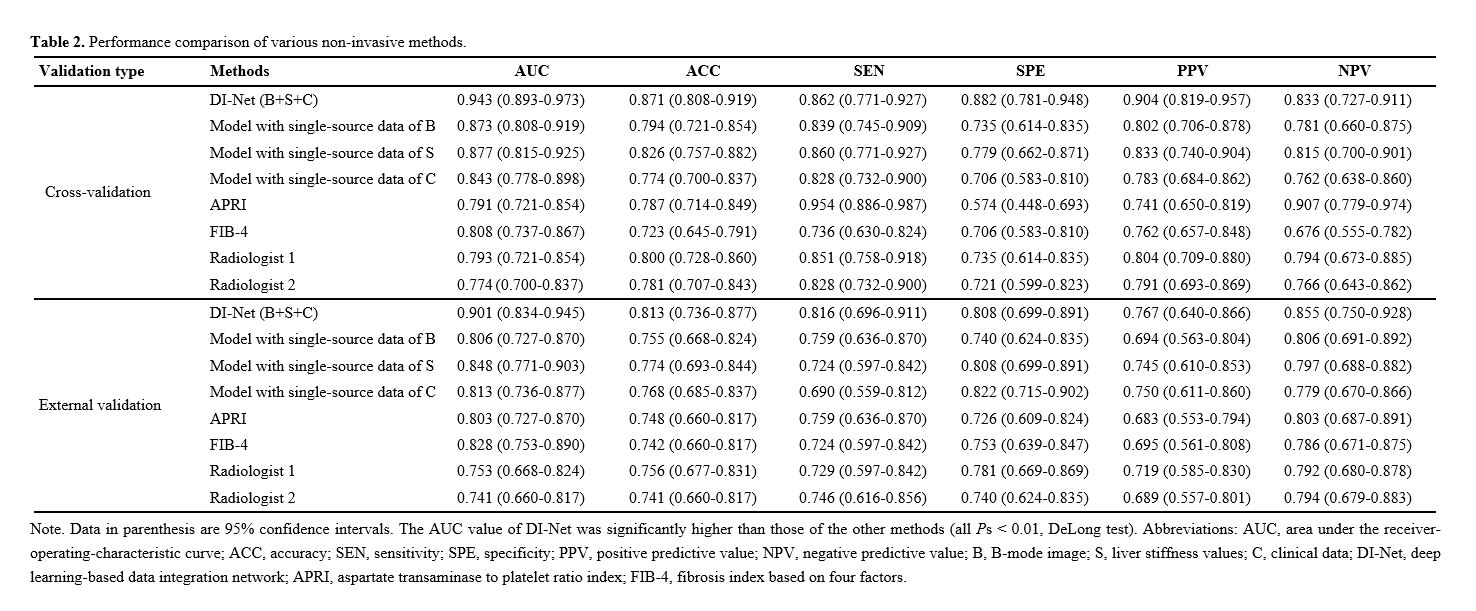
The diagnostic capacity of DI-Net was evaluated in terms of accuracy (ACC), sensitivity (SEN), specificity (SPE), positive predictive value (PPV), negative predictive value (NPV), the receiver-operating-characteristic (ROC) curve, and the area under the ROC curve (AUC). We compared the performance of DI-Net against the following methods: 1) single-source data-based models, i.e. the models trained with single-source data of B-mode images, liver stiffness values, or patients’ clinical parameters. 2) fibrosis biomarkers9,10, including APRI and FIB-4. 3) interpretations by skilled radiologists. More details of the comparative methods are presented in the Supplementary Material.
Statistical Analysis
Continuous variables of the patients’ data were expressed as mean ± standard deviation and compared by Student’s t test, while the categorical variables were expressed as a number (percentage) and compared by chi-square test. For the quantitative results of ACC, SEN, SPE, PPV, NPV and AUC, 95% confidence intervals (CIs) were calculated using the Clopper-Pearson method21. We used DeLong test22 to evaluate the differences between the ROC curves and the associated AUC values. P values were two-sided, and the values less than 0.05 indicated statistical significance. All statistical tests were performed on the software of MedCalc (Version 18.2) and MATLAB (Version R2019a).