Synthesis and characterization of G5.NHAc-PEG-PBA@Cu(II)/TPZ (GPPCT)
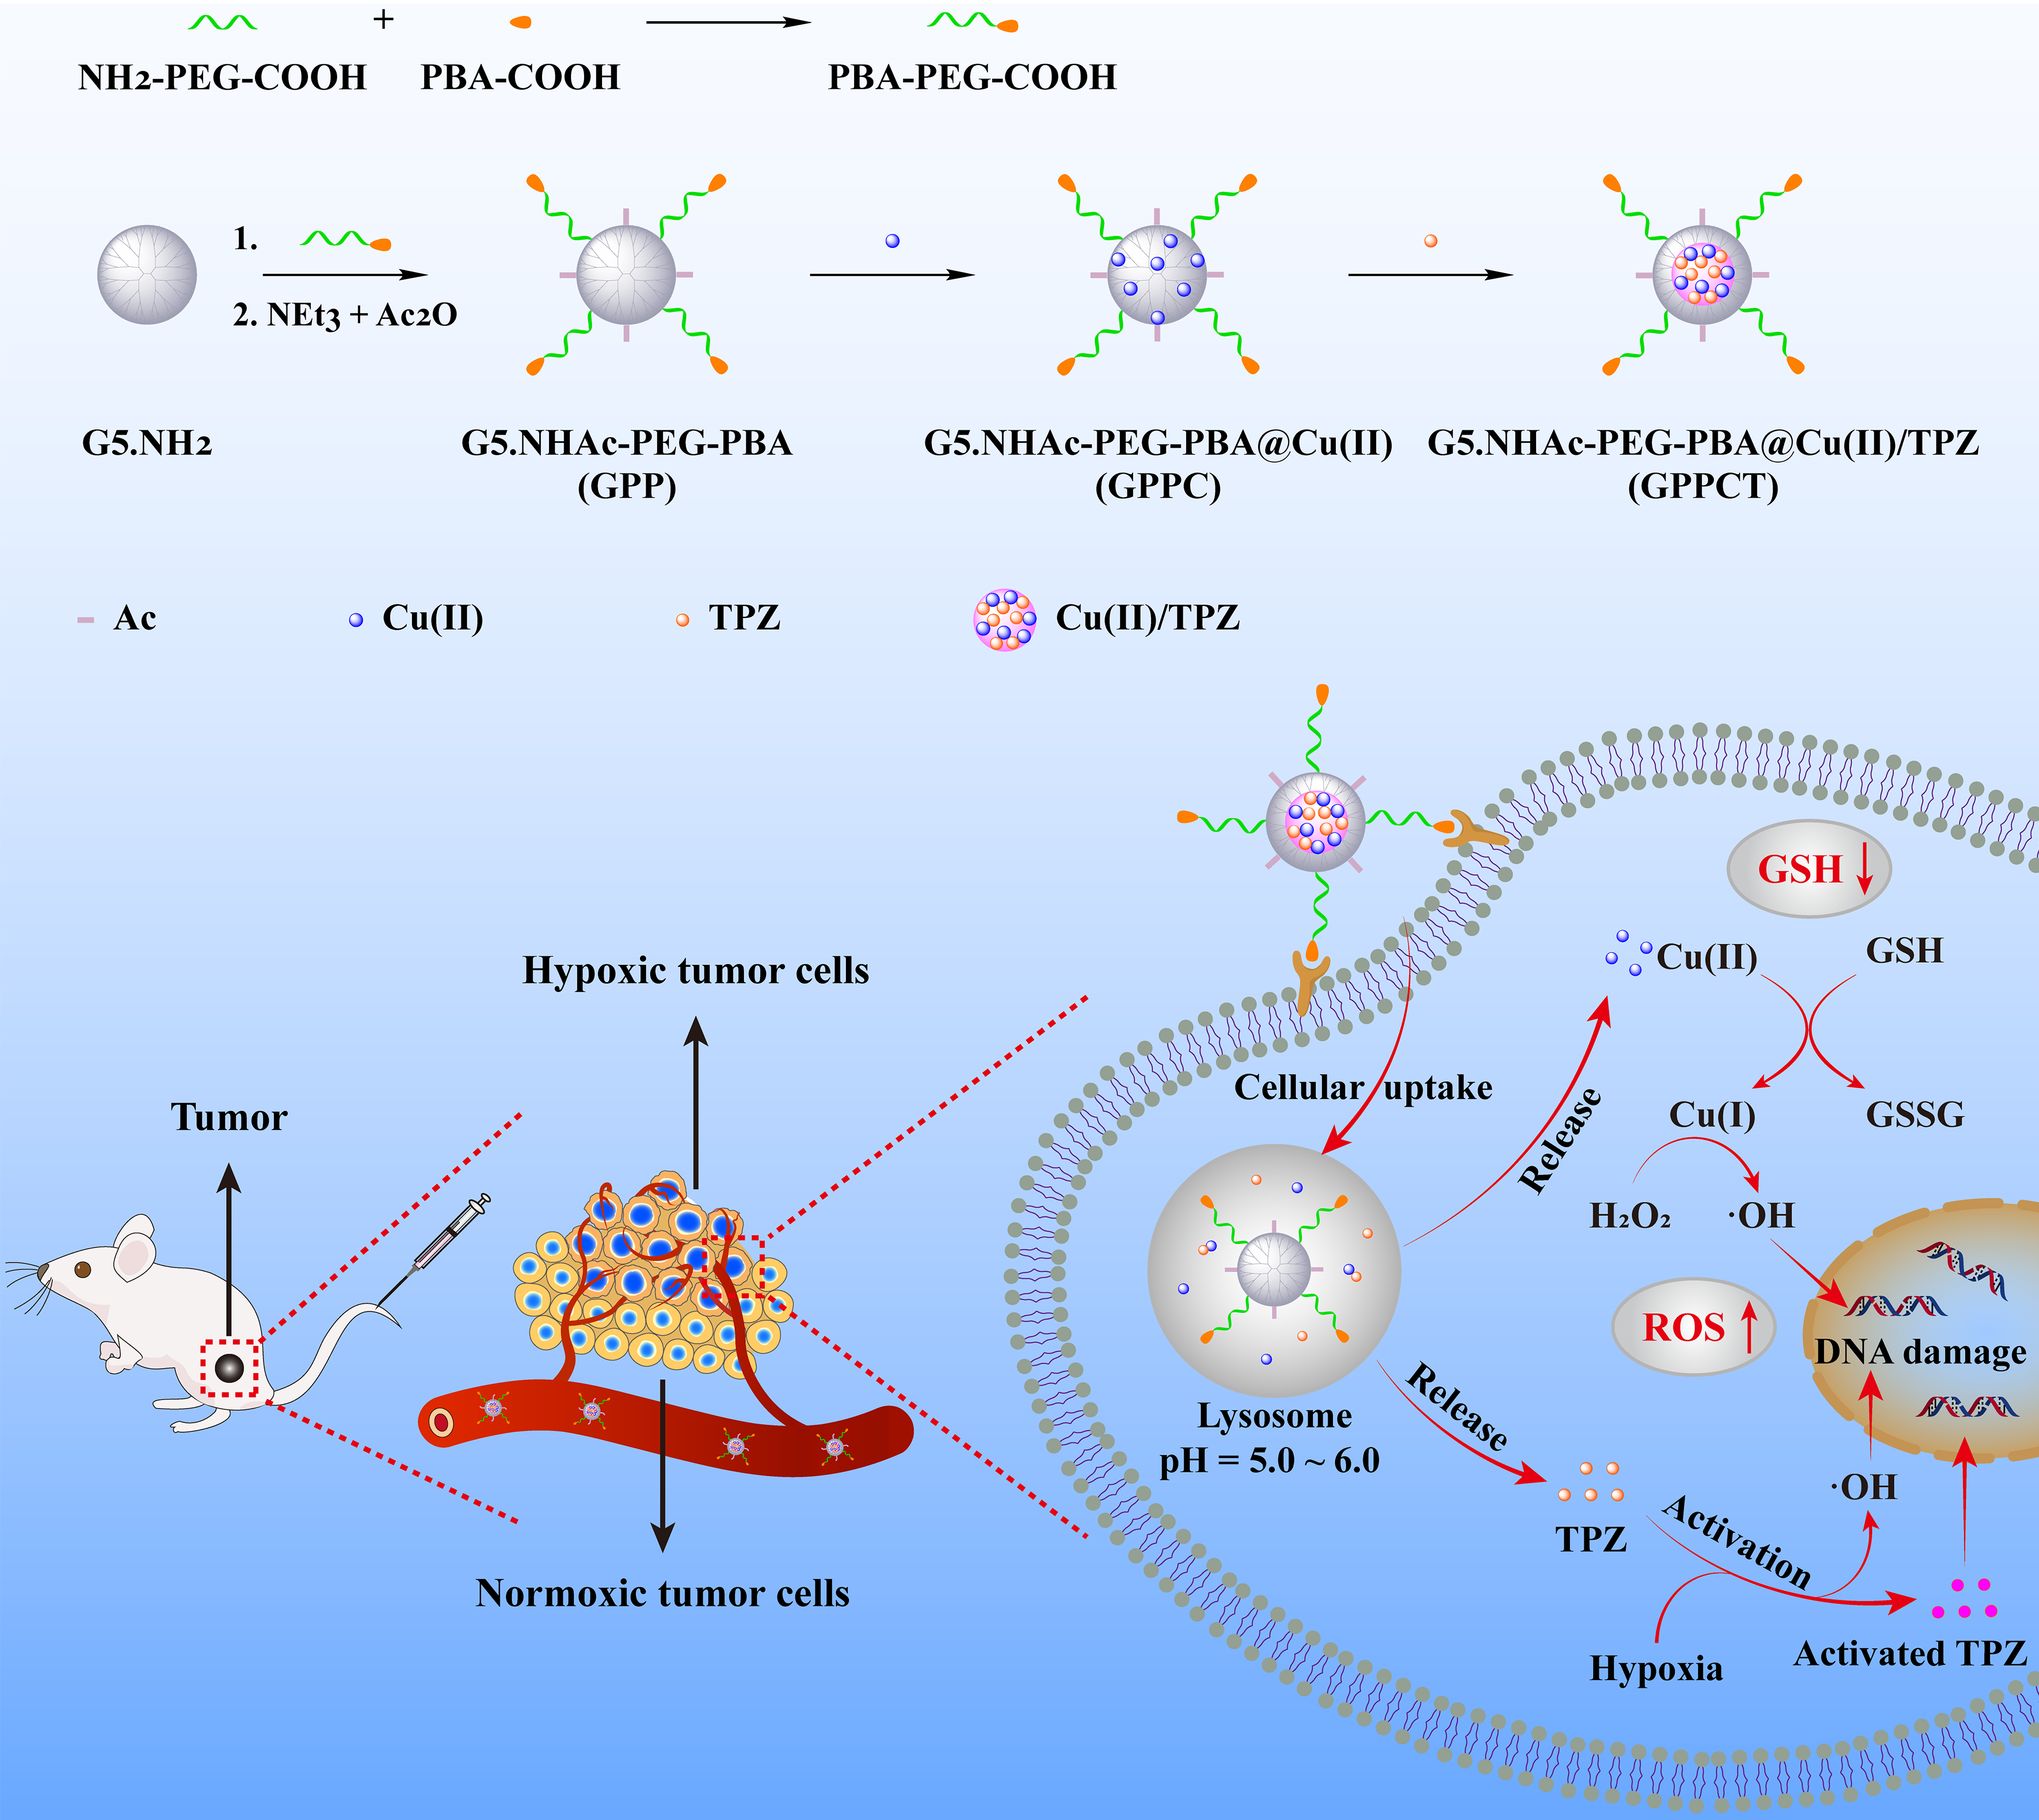
In this study, targeted nanocarrier G5.NHAc-PEG-PBA (GPP) to cancer cells overexpressing sialic acid residues were firstly synthesized by conjugate 4-carboxylphenylboronic acid (PBA) on G5 dendrimer via PEG chain and then acetylation of remaining amino groups on surface. The structure of GPP was confirmed by 1H NMR spectra in Fig. 1a. The appearing of characteristic peak of PBA at 7.60-7.78 ppm, PEG at 3.61 ppm, and acetyl groups at 1.88 ppm illustrated the successful synthesis of GPP. By integral calculation, each GPP possessed about 6.8 PEG, 2.9 PBA and 73.3 acetyl groups (Additional file 1: Fig. S2a and Fig. S2b). As a non-targeted control, G5.NHAc-mPEG (GmP) (Additional file 1: Fig. S3) with an average of 7.0 mPEG and 74.3 acetyl groups was synthesized by conjugate mPEG on the surface of G5 (Additional file 1: Fig. S2c and Fig. S2d). Then, Cu(II) were coordinated within dendrimers by the tertiary amines, and TPZ molecules were loaded via the formation of hydrophobic Cu(II)/TPZ nanocomplexes to obtain G5.NHAc-PEG-PBA@Cu(II)/TPZ (GPPCT) and G5.NHAc-mPEG@Cu(II)/TPZ (GmPCT). UV-vis spectra in Fig. 1b and Additional file 1: Fig. S4 demonstrated the stepwise loading of drugs in GPP and GmP. After the chelating Cu(II), GPPC displayed an obvious absorption peak at 603 nm, indicating that Cu(II) had been successfully loaded into GPP. And the peak at 499 nm in GPPCT proved the encapsulation of TPZ and the formation of Cu(II)/TPZ complexes in nanoplatforms. The loading content (LC) and entrapment efficiency (EE) of TPZ in GPPCT and GmPCT were calculated to be 2.26 %/ 2.38 % and 65.03 %/ 66.67 %, respectively (Additional file 1: Table S1). In addition, the amount of Cu(II) in nanocomplexes was also measured by ICP-OES, and the average number of Cu(II) in each GPPCT and GmPCT was calculated to be 17.69 and 18.07. Finally, the morphology of GPPCT and GmPCT were evaluated by TEM in Fig. 1c and Additional file 1: Fig. S5a. Both nanoplatforms showed regular spherical structure with good mono-dispersity, and the mean size of GPPCT and GmPCT were about 4.72 ± 0.80 nm and 4.74 ± 0.87 nm (Fig. 1d and Additional file 1: Fig. S5b), respectively. Moreover, both nanoplatforms had a similar mean hydrodynamic diameter of 150 nm (Fig. 1e, Additional file 1: Table S2 and Fig. S6), and kept good stability in water, PBS and DMEM media within seven days (Additional file 1: Fig. S7). As a result, targeted GPPCT and non-targeted GmPCT with similar size and drug content had been successfully synthesized for further comparison. To ensure the safe application of nanoplatforms in vivo, the hemolysis rate of GPPCT ([TPZ]=2.5, 5, 10, 15, 20 μM) was evaluated in Fig. 1f. The red blood cells in the positive control group ruptured and the solution turned red, while the hemolysis rate of GPPCT nanoplatform was less than 5 %, indicating their good blood compatibility. Therefore, Cu(II) and TPZ loaded GPPCT nanoplatform with good colloidal stability and hemocompatibility were successfully synthesized for biomedical applications.
To mimic the physiological environment, TME and weak acidic environment in lysosome, the drug release profiles of GPPCT at pH 7.4, 6.5 and 5.5 were studied respectively by ICP-OES for Cu and UV-vis spectroscopy for TPZ. As shown in Fig. 2a, the amount of Cu released at pH 5.5 within 48 h was about 3.15 times higher than that released at pH 7.4 (46.05 % vs 14.56 %). And a similar pH-sensitive release profile of TPZ could also be observed in Additional file 1: Fig. S8a, and a significantly higher amount of TPZ were released at weak acidic than at physiological situation. The pH-sensitive release property of GPPCT should be attributed to the easier dissociation of Cu(II)/TPZ complex at a lower pH [12]. As a result, GPPCT nanoplatform may decrease the side effects by reducing drug release during body circulation, and release Cu(II) and TPZ quickly at weak acidic tumor sites for efficient CDT and chemotherapy.
Then the generation of ROS by GPPCT in different situations was determined by measuring the degradation of methylene blue (MB) with UV-vis spectroscopy. As shown in Fig. 2b, the absorption at 664 nm did not change after mixing with only H2O2 or GPPC for 4 h, indicating the good stability of MB under these situations. With the addition of H2O2, GPPC induced the degradation of MB, and the absorption intensity of MB decreased 26.44 %. This proved that Cu(II) in GPPC could react with H2O2 to generate ·OH by Fenton reaction and degrade MB. More interesting, when GSH was added, the degradation rate accelerated significantly with the increase of GSH concentration, and the absorption intensity decreased almost triple at 10 mM GSH, indicating that about 76.72 % of MB were efficiently degraded. This should be mainly due to that GSH may reduce Cu(II) to Cu(I), which has a higher Fenton reaction efficiency. And it is worth noting that GPPCT may further enhance the MB degradation rate to 88.79 % with the aid of TPZ, illustrating their capability in massive ·OH production. To verify the function of TPZ, UV-vis spectra of MB in the present of TPZ was monitored in Additional file 1: Fig. S8b. It could be seen that TPZ can degrade MB efficiently with/without the existence of H2O2, and the degradation may become more thoroughly at a high GSH concentration. This result indicated that due to the excessive GSH at TME, TPZ may further increase the inhibition effect of GPPCT nanoplatforms at tumor sites. Furthermore, the degradation process of MB over time in Fig. 2c illustrated that ·OH groups could be sustainable and sufficient produced by GPPCT nanoplatform in the existence of GSH, illustrating their long-term and efficient therapeutic effect on malignant tumors. Finally, ROS generation at different pH environments (5.5, 6.5, and 7.4) were evaluated in Fig. 2d. Clearly, the degradation rate of MB enhanced with the decrease of pH and increase of GSH concentration, and the degradation rate could reach 92.12 % at pH 5.5 in the present of GSH, illustrating that remarkable ·OH groups may be generated by GPPCT in TME. Therefore, in view of the high drug loading efficiency and pH responsive drug release, GPPCT could be an excellent nanoplatform for synergistic CDT and chemotherapy due to the high toxic radical producing efficiency and hypoxia-responsive TPZ conversion at tumor acidic microenvironment with high endogenous H2O2 and excessive GSH.
Cellular uptake and cytotoxicity of GPPCT
4T1 breast cancer cell lines overexpressing sialic acid residues were chosen as model cells in this study. To simulate hypoxia situation, hypoxia model of 4T1 cells were set by incubating with CoCl2·6H2O (100 μM) for 24 h according to previous studies [29] (Additional file 1: Fig. S9a), and the expression of hypoxia inducible factor HIF-1α was verified by Western blot in Additional file 1: Fig. S9b and Fig. S9c. Compared with normoxic 4T1 cells, the HIF-1α expression of hypoxia 4T1 cells enhanced significantly, indicating the successful construction of hypoxia cell model. Therefore, mouse fibroblast L929 cells, normoxic 4T1 cells, and hypoxic 4T1 cells were applied firstly to verify the compatibility of GPP nanocarrier by CCK-8 method. As shown in Additional file 1: Fig. S10, the viability of different cells was higher than 80% after incubation with GPP in the studied concentration range, indicating that GPP had no obvious cytotoxicity as a nanocarrier.
To evaluate the cellular uptake and targeted drug delivery of GPPCT, laser confocal microscope (Fig. 3a) and flow cytometry (Fig. 3b) were used to examine the red fluorescence of TPZ after incubation with normoxic and hypoxic 4T1 cells for 6 h. It could be clearly seen that red fluorescence signals were concentrated well in cytoplasm of both normoxic and hypoxic 4T1 cells after incubation with nanoplatforms, and GPPCT group showed much brighter signals in comparison with GmPCT group. This demonstrated that GPPCT could be selectively uptaken by 4T1 cells through the specific recognition between PBA on the surface of GPPCT and the overexpressed sialic acid on 4T1 cell membranes. The targeting property of GPPCT was further proved by the result of flow cytometry in Fig. 3b. The fluorescence intensity of both GPPCT and GmPCT groups enhanced with the increase of TPZ concentration, and the fluorescence intensity of GPPCT group was significantly higher than that of GmPCT group (p<0.001). More interesting, the fluorescence intensity of GPPCT group in hypoxia 4T1 cells was significantly stronger than that of normoxic 4T1 cells, and more red spots in the nucleus could be observed in Fig. 3a. This should be ascribed to that hypoxia-responsive TPZ can be activated under hypoxic conditions and enter the nucleus more effectively, which may exert drug activity more efficiently to hypoxic tumors [30]. In addition, the cellular Cu content after incubation with GPPCT and GmPCT nanoplatforms were also measured by ICP-OES in Fig. 3c in order to further verify their targeting property. With the increase of nanoplatforms concentration, the cellular Cu concentration increased significantly, indicating that both nanoplatforms could be endocytic into cells due to their suitable nano-size. More importantly, GPPCT nanoplatforms displayed a significantly higher Cu concentration than non-targeted GmPCT group (p<0.001), indicating that compared with GmPCT, GPPCT can be more effectively uptaken by 4T1 cells due to the selective binding of PBA with sialic acid residues overexpressed on 4T1 cells. In conclusion, targeted GPPCT nanoplatform can be specifically uptaken by 4T1 cells overexpressing sialic acid, and released TPZ could be more efficiently activated at hypoxic tumor cells, which may enhance the therapeutic effect on hypoxic tumors.
Fig. 4 shows the viability of L929, normoxic 4T1, and hypoxic 4T1 cells co-cultured with TPZ, GPPC, GPPCT and GmPCT at different TPZ concentrations (0, 2.5, 5, 10, 15, 20, 25 μM) for 24 h. For free TPZ, the viability of all three kinds of cells decreased with the increase of drug concentration, and hypoxic 4T1 cells displayed a much lower viability than normoxic 4T1 cells and L929 cells at TPZ concentration over 10 μM. This difference should be attributed to the responsive formation of highly toxic TPZ radicals within hypoxic cells, which may induce single-strand/double-strand DNA breakage through the mediation of topoisomerase II and chromosomal destruction [31-33]. In contrast, GPPC nanoplatforms displayed an obvious toxicity on both normoxic and hypoxic 4T1 cells, but almost no inhibition on mouse fibroblast L929 cells was observed. This result suggested that Cu(II) complexed in GPPC could exert inhibitory effect specifically on tumor cells with high endogenous H2O2 level, and do less harm to normal cells. Notably, for hypoxic 4T1 cells, the viability of GPPCT group was significantly lower than TPZ or GPPC group alone at studied concentrations (p<0.001), indicating the synergistic effect of hypoxia-enhanced chemotherapy and CDT by GPPCT. In Fig. 4d, the inhibitory effect of GPPCT between different cell lines were systemically compared. Obviously, L929 cells displayed the highest cell viability, because GPPCT displayed the inhibition effect specific to tumor cells. Hypoxic 4T1 cells displayed a significantly poorer viability than normoxic 4T1 cells at a low GPPCT concentration, probably due to that hypoxic-sensitive TPZ could be converted to toxic TPZ radicals responsively within hypoxic cells and enhance the therapeutic effect. With the increase of drug concentration, the viability of both hypoxic and normoxic 4T1 cells decreased rapidly, indicating that GPPCT nanoplatforms could effectively inhibit both hypoxic and normoxic tumor cells at a high drug concentration. In addition, the IC50 values of GPPCT to different cells were calculated in Additional file 1: Table S3. The IC50 value of GPPCT on L929 cells was as high as 24.05 μM, which was 2.1 times higher than normoxic 4T1 cells (11.70 μM), and 4.8 times higher than hypoxic 4T1 cells (5.03 μM). This result further verified that GPPCT did no significant harm to normal cells, but could specifically inhibit tumor cells, and even exhibit an enhanced therapeutic effect on hypoxic cells less susceptible to general chemotherapy. The safety indexes of hypoxic and normoxic 4T1 cells were 4.78 and 2.06, respectively, verifying the good safety of the nanoplatforms. In conclusion, GPPCT can be used as an ideal targeted nanoplatform for the synergistic hypoxia-responsive chemotherapy and CDT of cancer cells overexpressing sialic acid residues.
Determination of ROS and GSH/GSSG Levels in Cells
To illustrate the treatment mechanism of GPPCT nanoplatforms at cellular level, 2’,7’-dichlorofluorescin diacetate (DCFH-DA) was used as a fluorescent indicator to detect reactive oxide species formed in cells. In Fig. 5a, 4T1 cells incubated with GPPC displayed obvious green fluorescence signals in comparison with PBS control. This result indicated that toxic ·OH were generated by Fenton-like reaction between Cu(II) released from GPPC nanoplatform and endogenous H2O2, inducing the formation of 2’-7’dichlorofluorescein (DCF) with fluorescence in cells. And the green fluorescence in cells treated with GPPCT under normoxic or hypoxic conditions was much brighter than that of GPPC group, suggesting that TPZ can produce additional reactive radicals, in consistent with the result in Fig. 2b and Additional file 1: Fig. S8b. Further analysis showed that hypoxic 4T1 cells incubated with GPPCT showed much stronger fluorescence signal than normoxic 4T1 cells due to the activation of TPZ under hypoxia condition to toxic BTZ radical and ·OH. Fig. 5b showed the quantitative analyzation of fluorescence intensity by flow cytometry. Compared with the control group, nanoplatform-treated cells possessed a significantly higher fluorescence intensity (p<0.001), and GPPCT caused a much stronger fluorescence signal than GPPC in both hypoxic 4T1 cells (p<0.001) and normoxic 4T1 cells (p<0.05) due to the encapsulation of TPZ. More importantly, the fluorescence intensity of GPPCT in hypoxic 4T1 cells was significantly higher than that in normoxic 4T1 cells, while there is no significant difference between GPPC treated 4T1 cells. This further demonstrated that TPZ can produce more reactive radicals under hypoxia conditions, which may effectively increase the therapeutic effect of GPPCT on hypoxia tumors. Moreover, the GSH content in 4T1 cells under normoxic and hypoxic conditions were measured to further verify the function of GSH in tumor treatment. As shown in Fig. 5c, it can be clearly seen that GSH content in hypoxic 4T1 cells was significantly higher than normoxic 4T1 cells, which would facilitate the reduction of Cu(II) to Cu(I) and promote the Fenton reaction efficiency for CDT. After co-culture with GPPC, the GSH content in normoxic and hypoxic cells decreased significantly (p<0.001) due to the consumption of GSH for Cu(II)/Cu(I) reduction. In addition, the GSH/GSSH ratio of GPPCT group was significantly lower than that of GPPC group (p<0.001), and there was no significant difference between normoxic and hypoxic cells. This result suggested that more GSH in hypoxic cells may be consumed to help converting TPZ to radicals with high toxicity, as demonstrated by the higher fluorescence in Fig. 5a and the low viability in Fig. 4. In turn, the GSH depletion may break the redox homeostasis in tumor cells, increase the cellular accumulation of ROS [10], and further improve the therapeutic efficacy of GPPCT. Therefore, GPPCT nanoplatform may efficiently produce toxic ROS, reduce the GSH level in cancer cells, and successfully enhance the therapeutic effect to tumors.
In vivo antitumor effect of GPPCT
To verify the therapeutic effect of GPPCT in vivo, BALB/c nude mice transplanted with 4T1 tumors were randomly divided into 6 groups (PBS, GPP, GPPC, CPPCT, GmPCT, and TPZ, n=5) when the tumor size reached about 200 mm3. Intravenous administration was planned on day 1, 4, 7, 10, 13, and 16 (Fig. 6a), and body weight (Fig. 6b) and relative tumor volume (Fig. 6c and Additional file 1: Fig. S11) were measured every 3 days. There were no mice dead in all groups during the treatment, and their body weight showed no significant decrease in Fig. 6b, indicating that nanoplatforms had no obvious toxic and side effect. As shown in Fig. 6c, the relative tumor volume of PBS and GPP groups increased by 14-15 times, indicating that pure nanocarrier GPP had no inhibition effect on tumors. Although the relative tumor size of free TPZ group displayed a lower tumor growth rate as 10.24 times, the therapeutic effect is still quite poor due to its fast metabolism in blood circulation and the low uptake in tumor cells. In contrast, GPPC group showed a significantly better inhibition effect with an increase of only 6.27 times (p<0.001). This should be attributed to not only the long circulation and specific accumulation of targeted GPPC nanoplatforms at tumor sites, but also the effective generation of toxic ·OH by Cu(II) with high endogenous H2O2 and excessive GSH at TME for CDT. Notably, the relative tumor size of GPPCT group was the lowest, which was only about 5.1 % of GmPCT group, 22 % of TPZ group and 37 % of GPPC group (p<0.001). The magnificent inhibition effect of GPPCT could be mainly due to the specific accumulation and efficient uptake of drugs at tumors, and the synergistic therapeutic effect of CDT by Cu(II) and hypoxia-enhanced chemotherapy by TPZ in killing both normoxic and hypoxic tumors in vivo, which is consistent with in vitro results in Fig. 3. After all mice were sacrificed on day 21, tumor tissues were extracted and weighted as shown in Fig. 6d. Among different groups, the tumor weight of GPPCT group was the lightest, indicating the best therapeutic effect. Therefore, targeted GPPCT nanoplatforms could effectively inhibit the growth of sialic acid overexpressed 4T1 tumors by the synergistic therapeutic effect of hypoxia-enhanced chemotherapy and CDT.
To illustrate the therapeutic mechanism in vivo, H&E, TUNEL, Ki-67, HIF-1α, and DHE staining were performed on tumor sections to evaluate the necrosis, apoptosis and proliferation of tumor cells, the therapeutic effect on hypoxic tumor cells, and the ROS production in tumors (Fig. 7a). The reduced blue signal in H&E staining and the increased green fluorescence in TUNEL staining indicated that most tumor cells in GPPCT group were necrotic and apoptotic. According to Additional file 1: Fig. S12a, the apoptosis rate of GPPCT group was calculated to be 95.9 %, which was significantly higher than that of GmPCT (78.48 %), GPPC (48.92 %), and free TPZ (30.91 %) (p<0.001). A similar ascending sequential order of cell proliferation was observed in the Ki-67 immunohistochemical analysis result (Additional file 1: Fig. S12b), and GPPCT displayed the lowest Ki-67 expression level as 8.37 %, indicating the reduction of cell proliferation by GPPCT nanoplatforms. Since TPZ could be metabolized in hypoxic cells to produce DNA-damaging radicals and kill hypoxic cells selectively, the expression of HIF-1α in tumors was detected by hypoxyprobe immunofluorescence assay to assess the ratio of hypoxic cells in tumor region in Fig. 7a. Strong green fluorescence signal of HIF-1α could be observed in the tumor section of PBS group, indicating that large number of hypoxic cells existed in solid tumor in vivo by the rapid growth of tumor. In contrast, the tumor section after GPPCT treatment displayed almost no green fluorescence signal. As calculated in Additional file 1: Fig. S12c., the HIF-1α expression level of GPPCT group was only 5.52 % of PBS group, while that of TPZ, GPPC, and GmPCT groups was 37.90 %, 49.25 %, and 31.19 %, respectively, demonstrating that GPPCT could effectively inhibit hypoxic tumors in vivo by specific targeting and combination therapy. In addition, local ROS production in tumor region was also detected by DHE staining. For GPPCT, GmPCT, GPPC, and free TPZ groups, the red fluorescence signals appeared in tumor section indicated the generation of ROS at tumor sites in vivo. And the average red fluorescence intensity of GPPCT group was significantly higher than that of free TPZ, GPPC, and GmPCT group (p<0.001) as shown in Additional file 1: Fig. S12d. This result verified that GPPCT nanoplatforms could produce toxic ROS more efficiently at tumor than other groups, which should be mainly due to three reasons. Firstly, GPPCT could specifically accumulate at tumor sites and be efficiently uptaken by tumor cells via the binding between PBA on GPPCT and sialic acid residues overexpressed on 4T1 cells for the targeted delivery of Cu(II) and TPZ. Secondly, the excessive intracellular GSH would be depleted by the reduction of Cu (II) to Cu(I) and the activation of TPZ in hypoxic tumor cells, which may suppress the cellular antioxidative system for ROS scavenging. Thirdly, abundant of ·OH groups would be produced efficiently by the Fenton-like reaction between Cu(I) and endogenous H2O2, and effectively inhibit solid tumor with the hypoxia-activated TPZ radicals in a synergistic manner.
Considering the highly invasive and aggressive property of breast cancer 4T1 model, the lung tissues in different groups were collected and H&E stained to assess their metastasis to distant organs (Fig. 7b). A large number of metastatic sites could be clearly seen in the lungs of PBS and GPP group, while the treatment groups of TPZ and GPPC displayed a lower number of pulmonary metastatic sites, indicating monotherapy could slightly reduce the breast cancer metastasis. Notably, compared with GmPCT group, GPPCT group showed a relatively intact lung structure with almost no metastasis, demonstrating the tumor invasion could be effectively inhibited by GPPCT. Therefore, GPPCT nanoplatforms could be an effective tumor strategy to inhibit the growth and metastasis of tumors by the combination of hypoxia-enhanced chemotherapy and CDT.
In vivo biodistribution and biosafety of GPPCT
To understand the biological distribution of GPPCT and GmPCT in vivo, the contents of copper in heart, liver, spleen, lung, kidney and tumors at different time intervals were determined by ICP-OES (Fig. 8a, b, c). For both targeted and non-targeted nanoplatforms, the Cu content in liver, lung and tumor increased significantly after intravenous injection, and peaked at 2 h. Then the Cu concentration in all major organs decreased to normal level after 72 h by metabolization, indicating that the injected nanoplatforms were almost completely cleared from the body within 3 days. More importantly, the Cu content in tumor tissue of targeted GPPCT group was significantly higher than GmPCT group within 8 h after injection (p<0.01). This result indicated that GPPCT nanoplatforms could effectively accumulate at tumor sites by the specific recognition of PBA to sialic acid resides overexpressed on 4T1 cancer cells, and be safely excreted from the body.
In addition, the biotoxicity of nanoplatforms for major organs after different treatments were evaluated by H&E staining assays in Fig. 8d. To our relief, no apparent inflammation or cell necrosis and apoptosis were observed in heart, liver, spleen, and kidney, indicating the excellent biocompatible of GPPCT nanoplatforms and no extra damage to normal organs after treatment. Finally, the routine blood and blood biochemical analysis were performed after GPPCT treatment. No obvious abnormality was observed in Additional file 1: Fig. S13, suggesting the good compatibility of GPPCT, and the proper liver and kidney function after GPPCT treatment. In conclusion, GPPCT nanoplatforms could be specifically accumulated at tumor overexpressing sialic acid residues, and be metabolized without significant damage to normal organs, which is of great importance for in vivo biomedical applications.