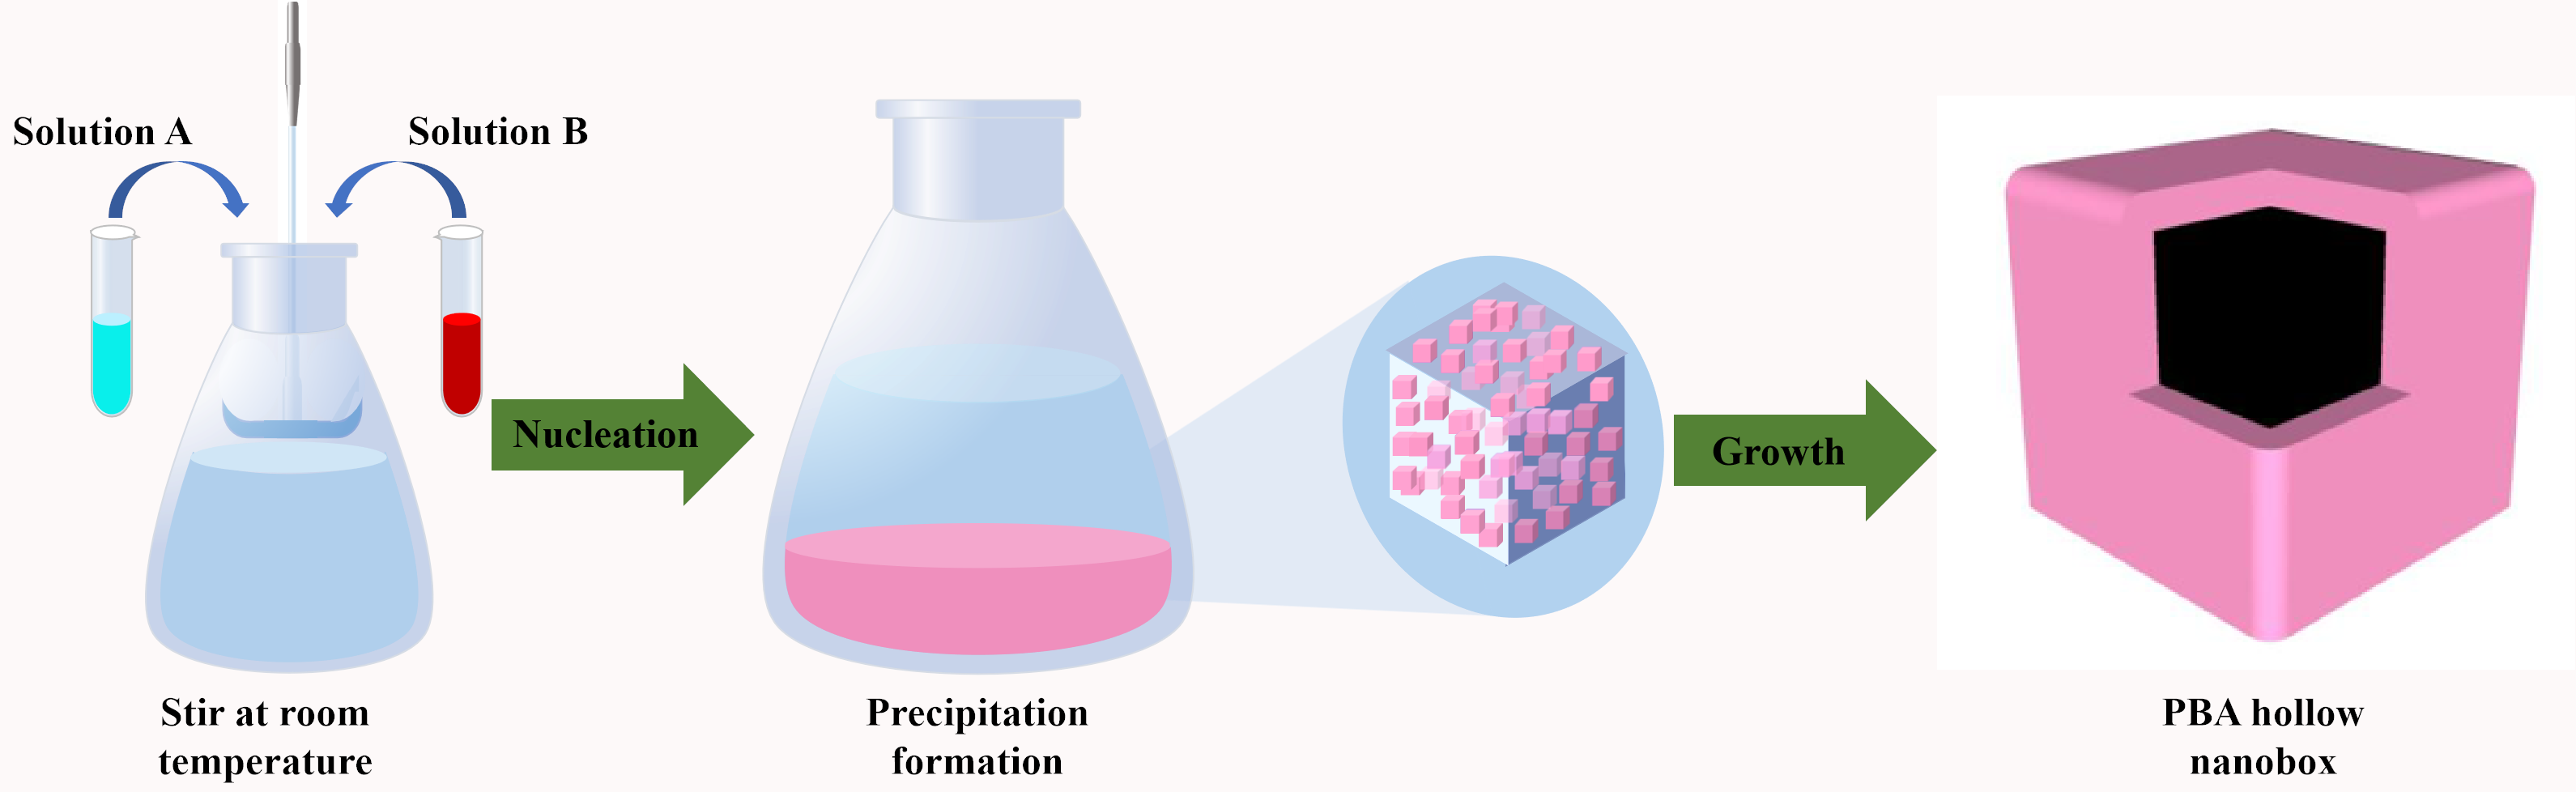
In this experiment, PBAs powder was synthesized by a simple precipitation method.
For K-PBM
|
K3[Fe(CN)6] + Mn(CH3COO)2 → KxMn[Fe(CN)6] + 2CH3COOK1−x
|
(Eq. 1)
|
|
K3[Fe(CN)6] + Mn(NO3)2 → KxMn[Fe(CN)6] + 2K1−xNO3
|
(Eq. 2)
|
For K-PBC
|
K3[Fe(CN)6] + Co(NO3)2 → KxCo[Fe(CN)6] + 2K1−xNO3
|
(Eq. 3)
|
XRD and SEM were carried out to study the phase, composition and micromorphology of the prepared samples, and the results are shown in Fig 1. In the XRD images of all PBA products, the positions of the characteristic diffraction peaks were basically the same and the diffraction peaks were sharp and strong, indicating that these samples had high crystallinity. In addition, in the SEM image as shown in the figs1.c-e, all of them had regular structure of nanobox. It could be seen that by replacing Fe(Ⅱ) in KFe(Ⅱ)Fe(Ⅲ)(CN)6 with similar transition metal ions such as Mn(Ⅱ) or Co(Ⅱ) the products still maintain a cubic framework structure and are arranged in an orderly manner. The XRD patterns of PBM in Fig. 1a were very consistent with the standard card of KMnFe(CN)6·2H2O (JCPDS 51-1896)[17]. Moreover, the characteristic peaks of PBM1 and PBM2 at 17.5, 24.2, 24.9, 25.4 and 35.4° corresponded to (002), (202), (220), (202) and (040) crystal planes[18]. Comparing their characteristic peaks, the characteristic peak intensity of PBM1 is higher and the adjacent impurity peaks are less, indicating that the purity of PBM1 is purer. The SEM images in Figs. 1c and 1d showed that the product is a nanobox structure. PBM1 was superior to PBM2 in terms of regular morphology and uniform size of particles[19]. As shown in Fig. 1b, the XRD pattern of PBC was very similar to the standard card of Co3[Fe(CN)6]2·10H2O (JCPDS 46-0907). The characteristic peaks at 17.2°, 24.4°, 34.8°, 39.1°, 43.0°, 50.1°, 53.3°, 56.5°, and 68.1° are assigned to (200), (220), (400), (420), (422), (440), (600), (620) and (642) planes[17], respectively. Fig. 1e shows the SEM image of PBC, which clearly shows the nanobox structure with a particle size of about 400 nm. Compared with the three samples, PBC is the smallest of the three, followed by PBM1. In addition, unobtrusive peaks can also be found in XRD patterns, indicating that the prepared samples have superior crystallinity, which is related to the slow nucleation process controlled with the assistance of sodium citrate.
Energy dispersive X-ray spectroscopy (EDX) was performed on the PBA sample to determine the proportion of each element. The analysis report in Fig. 2a shows that the ratio of k: Mn: Fe: O is 1.43: 1: 0.85: 0.16. Therefore, the molecular formula of PBM1 can be determined as K1.43Mn[Fe(CN)6]0.85·0.16H2O according to these measurement results. Through similar operations, the molecular formula of PBM2 is K1.51Mn[Fe(CN)6]0.91·0.05H2O and PBC is K0.41Co[Fe(CN)6]0.72. The morphology and microstructure of the obtained samples were further characterized byTEM. TEM images (Figs. 3a, 3c and 3e) showed that all PBA successfully prepared hollow nanoboxes. These nanospheres have an advanced hollow box structure, which can provide more active sites and faster diffusion channels, thereby obtaining higher ion diffusion kinetics and excellent electrochemical performance[20]. As depicted in Figs. 3b, 3d and 3f, the distribution range of K, Mn(Co), Fe, C and N fell uniformly in the hollow nanoboxes[21]. Combined with XRD, SEM, EDX and TEM data, it can be confirmed that the nanoboxes with hollow structure has been successfully prepared. Unlike the smooth surface of PBC naobox, the rough surfaces of PBM1 and PBM2 nanobox can effectively provide a large number of active sites and diffusion pathways. Different from the irregular and uneven nanoboxes of PBM2, the box structure of PBM1 is more perfect. It can't be ignored that the shell thickness of the sample is extremely important, because the thicker shell will introduce impurities, while the thinner shell may cause instability of the hollow box skeleton[22]. It can be clearly observed from the figure that compared with PBM2 and PBC, the shell thickness of PBM1 is between them, and the thickness is moderate.
In order to further determine the elemental composition, chemical valence and electronic state of PBA materials, the samples were characterized by XPS. XPS spectra of PBM1 are shown in Figs. 4(a-c). Full spectrum (Fig. 4a) contains Mn2p, Fe2p, C1s, K2p and N1s peaks. As shown in Fig. 4b, in the high resolution XPS spectrum of Mn 2p, the peaks at 641.8 and 653.7 eV are designated as Mn 2p3/2 and Mn 2p1/2, which are directly divided into two corresponding sub-peaks, and a satellite peak appears at 645.6 eV in the middle, indicating that the valence state of Mn in the sample is only positive divalent. Accordingly, in Fig. 4c, the spectrum shows that the peaks of Fe2p3/2 and 2p1/2 appear at 708.6 eV and 721.6 eV, and the corresponding sub-peaks have no satellite peaks, which belong to Fe2+ in [Fe(CN)6]4+ and Fe3+ in [Fe(CN)6]3+, respectively[23]. It is worth noting that the orbital peaks and binding energies in the fitting curves of Fe2p in the three samples are in the same position, which confirms the existence of iron cyanide ions. The elements displayed in the scanning spectrum (Fig. 4d) of PBM2 correspond to PBM1 one by one, and the fitting curve of its Fig. 4e Mn2p is basically consistent with that of Fig. 4b, except that the position where binding energy appears changes slightly. The above proves the successful preparation of PBM materials. The scanning spectrum of PBC (Fig. 4g) includes Mn2p, Fe2p, C1s, K2p and N1s peaks. As shown in Fig. 4f, it can be observed that the binding energies of Co2p1/2 and Co2p3/2 appear at 779.7 and 782.4eV, and there is a satellite peak at 786.7eV in the middle, which reveals the existence of Co2+, combined with the spectrum of Fe2p (Fig. 4g) can be proved the successful synthesis of PBC materials[24].
In order to understand the electrochemical properties of the prepared materials, cyclic voltammetry and rate tests were carried out. Fig. 5a shows the first three cyclic voltammetry curves of PBM1 in the potential range of 2.0-4.0 V and the scan rate of 0.1 mV s−1. The reduction/oxidation peaks distributed at at 3.68/4.13 V and 3.93/4.25 V could be assigned to the Fe3+/Fe2+ and Mn3+/Mn2+, respectively. The phenomenon of these overlapping of PBM1 indicates the excellent reversibility of sodium ion. It could be observed two symmetrical oxidation/reduction peaks at 3.36/3.18 V in the first cycle, corresponding to the extraction and insertion of Na+. From the second cycle, the oxidation-reduction peak (3.32/3.19 V) was well maintained suggested the highly reactive reversibility and good structural stability25. Fig. 5b shows the rate curve at a current density of 0.05 to 1 A/g. At current densities of 0.05, 0.1, 0.2, 0.5 and 1 A/g, the reversible discharge specific capacities of the PBM1 cathode are 109.6, 95.0, 71.1, 38, and 19.1 mAh/g, respectively. At a large current density of 0.5 A/g, 64% of the initial specific capacity can still be maintained. When the current density goes back to 0.05 A/g again, the reversible discharge specific capacity is 114.1 mAh/g, indicating that PBM1 has superior rate performance. The reversible discharge specific capacities of PBM2 at current densities of 0.05, 0.1, 0.2, 0.5 and 1 A g−1 are 65.4, 51.6, 33.5, 17.8 and 11.1 mAh/g, respectively. At a large current density of 0.5 A/g, the specific capacity is only 27% of the initial value. When the current density goes back to 0.05 A/g again, the reversible discharge specific capacity is 69.1 mAh/g, and the overall performance is inferior to PBM1. As for PBC, there is almost no reversible specific capacity at a current density of 0.05-1A/g without further discussion. The reason for the extremely low energy storage performance of the PBC cathode may be that the content of K+ in the PBC material is too small, which is only 0.41, far less than 1.43 of PBM1 and 1.51 of PBM2. There is no large amount of free K+ movement inside, so that the number and size of the material gap points are not up to the standard. At the same time, the smooth surface of its microscopic nanobox cannot provide sufficient active gap points and diffusion pathways[26]. The last point is that its thinner shell thickness causes the hollow skeleton to be not strong enough. Comparing the charge/discharge curves of PBM1 (Fig. 5c) and PBM2 (Fig. 5d), noticed that although both are charged/ discharged with constant current at a voltage of 2.0-4.0 V. The initial charging voltage of PBM1 is around 2.5 V and the voltage of PBM2 is 2.75 V, and the initial discharge voltage is the same. The lower initial charging voltage may be the reason why the rate performance of PBM1 surpass PBM2.In order to have a deeper understanding of the electrochemical performance of the PBM cathode, the cycling and impedance performance of PBM1 and PBM2 were tested. Fig. 6a is the cycle performance curve of the PBM cathode material at a current density of 0.1A/g. The initial reversible specific capacity of PBM1 is 75.1 mAh/g, and the highest specific capacity is 91.1 mAh/g. After 300 cycles of charging and discharging, the specific capacity is 75.4 mAh/g, which has no attenuation compared with the initial specific capacity and can still maintain the highest specific capacity of 82%, which proves that PBM1 has excellent cycle performance[27]. The initial specific capacity of PBM2 is 60 mAh/g, and the highest is 69.0 mAh/g. The specific capacity after 300 cycles is 42.2 mAh/g, which is 30% attenuated compared with the initial specific capacity, which is equivalent to the highest specific capacity of 61%. Comparing the cycle charge and discharge curves of PBM1 (Fig. 6b) and PBM2 (Fig. 6c), the initial discharge voltage of PBM1 during each cycle of 300 cycles is about 2.5V, which is lower than the 2.75V of PBM2. This phenomenon also appears in the rate performance, which is more certain that this is why the electrochemical performance of PBM1 is superior. In addition, since the energy storage capacity of the electrode material is directly related to its impedance, in order to compare the reaction kinetics of the PBM1 and PBM2 electrodes, electrochemical impedance spectroscopy analysis was carried out. The frequency spectrum is shown in Figure 6(b). A concave semicircle is formed in the high frequency area and the middle frequency area, and a straight line is formed in the low frequency area. The semicircle in the high-frequency region and the long diagonal line in the low-frequency region correspond to the charge transfer process and the Warburg diffusion process, respectively. Obviously, the charge transfer resistance (Rct) of PBM1 is lower, which is more conducive to Na+ and electron migration. The reason why the electrochemical performance of PBM1 is better than that of PBM2 is that the electrode material of PBM1 has higher purity, more regular particles and more suitable shell thickness. After characterizing the physical and electrochemical properties of the three electrode materials, the results show that Mn2+ is easier to combine with potassium ions to form a rough surface, and acetate ions can form uniform particle and shell thickness[28].