Decoction preparation
All TCM materials were purchased from Beijing Tong Ren Tang Group (Beijing, China) and decocted twice. For the first decoction, the medicinal material was submerged in cold water and soaked for 30–60 min. Then, the water was decanted, and the medicinal material was placed in a casserole or ceramic pot. The vessel was then placed on fire, and the medicinal material was brought to boil, following which, the heat was turned down, and the medicinal material continued to decoct for 30 min. The first decocted liquid was then decanted. For the second decoction, the medicinal materials were submerged in hot water. The heat was turned up, and the mixture was boiled. The heat was then lowered, and the mixture was decocted for 20 min. The second decocted liquid was then decanted. The mixture was frequently stirred during both decoctions. Both decoctions were mixed, and the decocted liquid was placed in a rotary evaporator (Hei-VAP Core, Heidolph Instruments, Schwabach, Germany) and concentrated according to the corresponding proportions. The M D and H D liquids were sealed, stored at 4 °C, and heated to 30–40 °C before intragastric administration to the experimental animals.
Untargeted liquid chromatography-mass spectrometry (LC-MS) analysis
The foregoing compound was analyzed by LC-MS. All chemicals and solvents were analytical or HPLC grade. Methanol, acetonitrile, formic acid, and water were purchased from Merck KGaA (Darmstadt, Germany). The 2-chlorophenylalanine was acquired from GL Biochem (Shanghai, China). The devices used were: Vortex oscillator (TYXH-1; ZOLLO, Shanghai, China), High Speed Benchtop Refrigerated Centrifuge (TGL-16MS; LUXIANGYI, Shanghai, China), High Performance Liquid Chromatography system (Acquity UPLC/HPLC; Waters, USA), HPLC column (Acquity UPLC HSS T3; Waters), Mass Spectrometer (Q Exactive™ Plus Hybrid Quadrupole-Orbitrap™; ThermoFisher, US), and centrifuge (Sigma 1-16K, Sigma,-Aldrich, Darmstadt, Germany).
The sample was thawed slowly on ice, and 0.5 mL of it was freeze-dried. Then 800 μL of 80% (v/v) methanol was added to each sample. The samples were then mixed by vortexing, ultrasonicated at 4 °C for 30 min, cooled to -40 °C for 1 h, vortexed for 30 s, maintained at 4 °C for 30 min, and centrifuged at 10,800 × g for 15 min at 4 °C. Then 5 μL internal standard (0.14 mg/mL dichlorophenylalanine) was added to 200 μL supernatant, and the mixture was transferred to a liquid chromatography (LC) vial. The vials were stored at -80 °C until the LC-MS analysis.
The chromatographic conditions were as follows: column temperature, 40 °C; mobile phase A, 0.05% (v/v) formic acid; mobile phase B, acetonitrile solution; flow rate, 0.3 mL/min; sample volume, 3 μL; and automatic sampler temperature, 4 °C. The MS conditions in positive mode were as follows: heater temperature, 300 °C; sheath gas flow rate, 45 arb; auxiliary gas flow rate, 15 arb; tail gas flow rate, 1 arb; electrospray voltage, 3.0 kV; and capillary temperature, 350 °C; The MS conditions in negative mode were as follows: heater temperature, 300 °C; sheath gas flow rate, 45 arb; auxiliary gas flow rate, 15 arb; tail gas flow rate, 1 arb; electrospray voltage, 3.2 kV; and capillary temperature, 350 °C. Scanning mode: the first-level full scan range was m/z 70–1,050. For the data-dependent second-level MS (DD-MS2; TOPN = 10), the resolutions were 70,000 (primary MS) & 17,500 (secondary MS). Collision mode: high energy collision dissociation (HCD) was used.
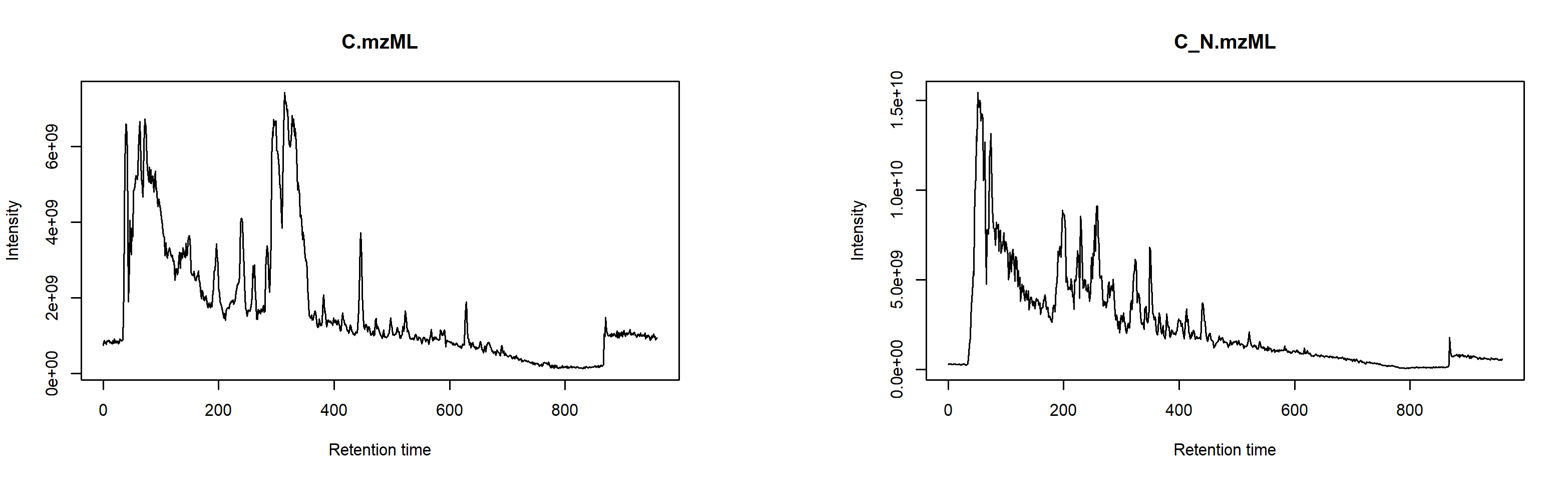
Compound Discoverer v. 2.0 (Thermo Fisher Scientific, Waltham, MA, USA) was used to extract and preprocess the LC/MS detection data. The data were retrieved with the Orbitrap Traditional Chinese Medicine Library (OTCML; Thermo Fisher Scientific), normalized and post-edited in Microsoft Excel 2010 (Microsoft Corp., Redmond, WA, USA), and organized into a 2D data matrix comprising the molecular weight (MW), mass/charge ratio (m/z), retention time (RT), peak strength, and database-matching results. A TIC diagram of the LC/MS in the positive and negative ion modes is shown in Supplementary Fig. S1.
Network pharmacological analysis
The components with the highest content in the foregoing samples were selected using an in silico ADME model in the Traditional Chinese Medicine Systems Pharmacology (TCMSP) database. The latter compared and queried each component. Unique molecular ID and relative target information were obtained. Duplicate components and those with no corresponding ID were removed. Ingredients with unique molecular ID in the top 50 positive and negative ion modes were obtained. The ADME system used here predicted oral bioavailability (OB) and drug-likeness (DL). Compounds were retained only if their OB ≥ 30% and their DL ≥ 0.18 based on the criteria set by the TCMSP v. 2.3 database (https://tcmsp-e.com). A TCMSP target prediction model was used to forecast the putative target proteins of each active component. The names of the foregoing target proteins were retrieved from the Uniprot database (https://www.uniprot.org). The qualifier used was “confirmed” on a species that was “human.” The generic names of the genes corresponding to the target proteins were identified. The data were imported into Cytoscape v. 3.8.2 (https://cytoscape.org/download.html) to construct a drug-component-target-pathway network. The output was presented as an intuitive network graph.
Radiation-induced intestinal injury was searched in the GeneCards (https://www.genecards.org) and OMIM (https://www.omim.org) databases to obtain the genes associated with acute intestinal radiation injury. The online Wayne figure tools (https://bioinfogp.cnb.csic.es/tools/venny/) was used to screen for intersections among the target genes of the active ingredients in the compound and the genes related to acute intestinal radiation damage. In this manner, potential targets for the treatment of acute intestinal radiation damage might be detected. The intersecting genes were entered into the String (https://string-db.org) database to obtain protein-protein interactions (PPI) plots. The network view summarized the predicted association networks with other proteins. The nodes represented the proteins while the edges represented the predicted functional associations. The node size reflected the interaction levels in the network. The data were downloaded from the String database into Cytoscape 3.8.2 to plot a target-path network graph. The Metascape (ttps://metascape.org/gp/index.html#/main/step1) database was used for the gene ontology (GO) and Kyoto Encyclopedia of Genes and Genomes (KEGG) analyses. Cytoscape 3.8.2 was used to plot the drawings.
Animals and radiation source
Eighty-five specific pathogen-free male Sprague-Dawley (SD) rats with body weight in the range of 280–300 g were purchased from SPF (Beijing) Biotechnology Co. Ltd., Beijing, China. All animal experiments complied with relevant experimental animal welfare principles, which were approved by the Ethics Committee of the Academy of Military Medical Science, Beijing, China (No. IACUC-DWZX-2020-783). All experimental animals were maintained in a room at the Experimental Animal Center of the Academy of Military Medical Sciences. The relative humidity was 55 ± 2%, the temperature was 25 ± 2 °C, and the photoperiod was 12 h light/12 h dark. The γ-radiation source was 60Co, and it was procured from the Institute of Radiation and Radiation Medicine of the Academy of Military Medical Sciences. The rats with very poor survival status and abdominal aorta blood were euthanized by a peritoneal overdose of pentobarbital sodium (100 mg/kg, IV). Unless otherwise specified, each experiment was performed in triplicate.
Experimental grouping
Eighty-five male SD rats each weighing 280–300 g were randomly assigned to one of the five following groups: control (Control), model (Radiation), positive drug (Gln), medium-concentration decoction (M D), and high-concentration decoction (H D). The rats used in the survival analysis were randomly assigned to one of the five foregoing groups. All groups except the Control had 12 rats. The Control had only five rats. After adaptive feeding for 3 d, the rats were fasted for 8 h before irradiation. Except for the Control, all groups were subjected to a single whole-body irradiation with 10-Gy of 60Co γ-rays. The acute intestinal radiation injury assessments focused on the duodenum and terminal ileum alone as these parts of the small intestine are less physiologically active than the rest of the small intestine and are, therefore, more likely to receive the full radiation dose. This study conformed to the 3R principle, and we tried to optimize the experimental scheme.
In vivo drug administration
The LXGY decoction consisted of ginseng radix, astragalus membranaceus, water cow’s horn, tree peony bark, dan-shen root, tractylodes atractylodes, pueraria root, rehmanniae glutinosa, rhizoma coptis, and other ingredients. The Chinese herbal decoction pieces were decocted twice. The M D and H D treatments were concentrated to 2.73 g/mL and 5.46 g/mL crude Chinese herbal medicine, respectively, at double and quadruple the equivalent doses administered to adult humans, respectively. They were stored at 4 °C until later use. The positive drug was glutamine in capsule form (Jiangsu Shenhua Pharmaceutical Co., Jiangsu, China). The contents of the glutamine capsule were mixed with 0.9% (w/v) physiological saline to make a 3 g/kg suspension for intragastric administration.
Western blotting
Radioimmunoprecipitation assay (RIPA) buffer and cocktail protease and phosphorylase inhibitors (Servicebio, Hubei, China) were added to rat jejuna, and the tissues were homogenized at 4 °C using a low temperature crushing homogenizer (JXFSTPRP-I-02, JINGXIN, Shanghai, China) and centrifuged at 4 °C ,12,000 × g for 5 min (Centrifuge 5425, Eppendorf, Germany). The supernatants were conserved, and protein loading buffer (Servicebio, Wuhan, China) was added to them. The proteins were separated by 10% sodium dodecyl sulfate-polyacrylamide gel electrophoresis (SDS-PAGE) and transferred to a nitrocellulose membrane. The membrane was incubated with anti-β-Catenin, anti-C-MYC, and anti-phospho-MEK (anti-p-MEK), anti-MEK, anti-phospho-ERK (anti-p-ERK), anti-ERK, anti-GAPDH (Cell Signaling Technology, Danvers, MA, USA), and anti-WNT3A antibodies (Zen-Bioscience; www.zen-bio.cn) and incubated at 4 °C overnight. The membrane was then rinsed in Tris/Tween-20 buffer (TBST; Servicebio, Wuhan, China) and incubated with horseradish peroxidase (HRP)-bound secondary antibodies. The bands of Western blotting are displayed and analyzed by imaging system (ChemiDoc Imaging System 12003153-S, BIO-RAD, US).
RT-qPCR
RT-qPCR was performed to elucidate the Wnt pathway of the intestinal stem cells. The intestinal tissue was homogenized with RNA extraction compound (G3013; Wuhan ServiceBio Technology Co. Ltd., Wuhan, China). Reverse transcription was performed with a ServiceBio® RT First-Strand cDNA Synthesis Kit (G3330; Wuhan ServiceBio Technology Co.) according to the manufacturer’s instructions. The cDNA was amplified by RT-qPCR. The primers were synthesized by Invitrogen (Carlsbad, CA, USA) and are listed in Supplementary Table S3. The mRNA levels were normalized to glyceraldehyde-3-phosphate dehydrogenase.
Hematoxylin-eosin (HE) staining and immunohistochemistry (IHC)
Five rats were randomly selected at days 3, 5, and 10 after irradiation. After the blood was collected from the abdominal aorta, the rats were euthanized as described previously. Small intestines were excised, and 3 cm of the upper segment of each jejunum was immersed in 4% (v/v) paraformaldehyde (PFA) for 72 h. The jejuna were sectioned into 5-μm slices, embedded in paraffin, and subjected to HE staining.
The jejunum paraffin sections were rehydrated in 100%, 95% (v/v), and 80% (v/v) ethanol for 10 min per treatment and rinsed with phosphate-buffered saline (PBS). The samples were incubated with 1% (v/v) bovine serum albumin (BSA) at room temperature (25–27 °C) for 30 min, subjected to primary antibody, incubated at 4 °C overnight, and washed thrice in PBS. The corresponding secondary antibody was applied to the samples, and they were incubated in a thermostatic chamber at 37 °C for 30 min. The samples were then rinsed thrice in PBS, rinsed with distilled water, and re-stained with hematoxylin. The samples were then dehydrated and sealed. Thirty intact crypts or villi were counted per section. The numbers of positive cells per crypt or villus were reported as means ± standard deviation (SD). At least five rats were used per group. The antibodies used were anti-Lgr5 (Novusbio, US), anti-CyclinD1 (Servicebio, Wuhan, China), anti-claudin-1 (Servicebio, Wuhan, China), and anti-occludin (Servicebio, Wuhan, China).
HE staining and IHC analyses
HE and IHC staining of the small intestine were observed under a microscope (Leika, Germany). For each group, suitable fields of vision for each tissue section were photographed using imaging software (Leika, Germany). The entire field of view was filled with tissue image to ensure uniform background lighting for all pictures. Villus length (μm) and crypt depth (μm) were measured with ImagePro Plus v. 6.0 (Media Cybernetics Inc, Rockville, MD, USA) for ≥ 5 sections per time point per group. The lower right corner scale was the standard. The IHC results were semi-quantitatively analyzed using ImageJ (Java 1.8.0_172, National Institutes of Health, Bethesda, MD, USA). The foregoing measurements were independently made by three observers blinded to the treatments.
Enzyme-linked immunosorbent assay (ELISA)
Except for the Control, five rats were randomly selected per group and per time point and ≥ 3 mL blood was drawn from each abdominal aorta. The blood was stored at room temperature and centrifuged at 4,000 × g for 15 min at 4 °C. The supernatants were collected and stored at -80 °C until the ELISA was performed with a Rat D-Lactate ELISA Kit (Shanghai Xin Fan Biotechnology Co. Ltd., Shanghai, China). The D-lactate standard was diluted and added to the test kit plate according to the manufacturer’s directions. The diluted sample was added to the plate hole, and the corresponding solution was added to the sample and mixed with it. The mixture was incubated for 30 min, and the assay was conducted. A standard curve was plotted using the absorbances of a D-lactate standard dilution series, and the D-lactate concentration of each sample was interpolated from the graph based on the sample absorbance.
Statistical analysis
SPSS v. 19.0 (IBM Corp., Armonk, NY, USA) was used to analyze the data which were expressed as means ± SD. The repeated-measurement statistical method was used to analyze the data at various time points per group. P < 0.05 indicated statistically significant difference between treatment means. Survival rate was determined with a Kaplan-Meier survival curve, and the pairwise comparisons were made with log-rank (Mantel-Cox) and Gehan-Breslow-Wilcoxon tests. The survival analyses and graphs were plotted with GraphPad Prism v. 7 (GraphPad Software, La Jolla, CA, USA). LSD and one-way ANOVA were used to determine all variances. Heterogenous variances were analyzed with Welch (W), Brown-Forsythe (B), and Games-Howell tests. Rat body weights were repeated-measurement data and subjected to a correlated ANOVA.