Search results and study characteristics
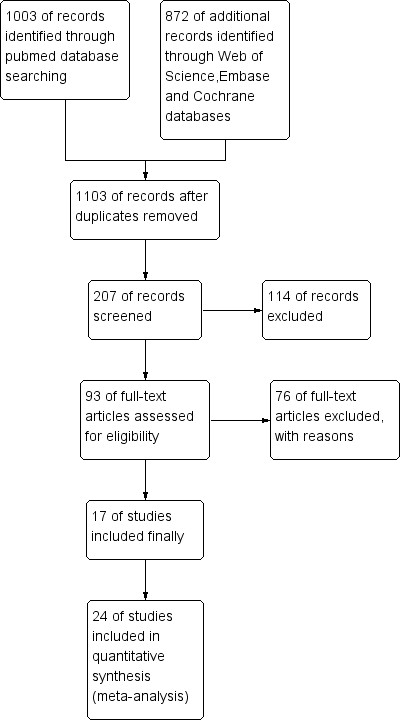
We obtained 1003 records from the PubMed database and 872 records from the Web of Science, Embase and Cochrane databases. Excluding duplicated articles, 1103 articles remained. We browsed the titles and abstracts of the articles, and 207 articles remained. 93 of the full-text articles were assessed for eligibility, but 76 articles were excluded for reasons (49 were mainly about IMN therapy, 8 did not provide enough data, 6 did not meet the accuracy of the test, 13 were without healthy controls). Finally, the meta-analysis included 17 articles, including 24 studies. Article selection flow chart is shown in Figure 1.
Table 1
Informations of the qualified studies.
|
Year
|
Study
|
Country
|
Sample
|
Biomarker
|
Method
|
Test
group
|
Control
group1
|
Control group2
|
Control group3
|
Control group4
|
TP
|
FP1
|
FP2
|
FP3
|
FP4
|
FN
|
TN1
|
TN2
|
TN3
|
TN4
|
|
2009
|
Beck [15]
|
USA
|
Serum
|
PLA2R
|
WB
|
37
|
8
|
15
|
30
|
7
|
26
|
0
|
0
|
0
|
0
|
11
|
8
|
15
|
30
|
7
|
|
2011
|
Hoxha [16]
|
Germany
|
Serum
|
PLA2R
|
IFT
|
100
|
17
|
90
|
153
|
|
52
|
0
|
0
|
0
|
|
48
|
17
|
90
|
153
|
|
|
2012
|
Murtas [17]
|
Italy
|
Serum
|
PLA2R
|
WB
|
186
|
|
92
|
96
|
|
111
|
|
0
|
0
|
|
75
|
|
92
|
96
|
|
|
2013
|
Behnert [18]
|
Germany
|
Serum
|
PLA2R
|
IIF-CBA
|
165
|
|
|
50
|
50
|
85
|
|
|
0
|
0
|
80
|
|
|
50
|
50
|
|
2014
|
Tomas [19]
|
France
|
Serum
|
THSD7A
|
WB
|
118
|
35
|
76
|
44
|
|
6
|
1
|
0
|
0
|
|
112
|
34
|
76
|
44
|
|
|
2015
|
Kim [20]
|
Korea
|
Serum
|
PLA2R
|
ELISA
|
93
|
14
|
41
|
12
|
|
41
|
0
|
0
|
0
|
|
52
|
14
|
41
|
12
|
|
|
2015
|
Rood [21]
|
The Netherlands
|
Urine
|
LIMP-2
|
Proteomics
|
5
|
|
5
|
3
|
|
5
|
|
0
|
0
|
|
0
|
|
5
|
3
|
|
|
2015
|
Yang [22]
|
China
|
Serum
|
PLA2R
|
IIF
|
20
|
10
|
|
5
|
|
12
|
2
|
|
0
|
|
8
|
8
|
|
5
|
|
|
2016
|
Li1 [23]
|
China
|
Serum
|
PLA2R
|
ELISA
|
82
|
22
|
40
|
20
|
|
51
|
7
|
0
|
0
|
|
31
|
15
|
40
|
20
|
|
|
2016
|
Li2 [23]
|
China
|
Serum
|
PLA2R
|
IIF-CBA
|
82
|
22
|
40
|
20
|
|
53
|
8
|
0
|
0
|
|
29
|
14
|
40
|
20
|
|
|
2017
|
Wang1 [24]
|
China
|
Serum
|
PLA2R
|
WB
|
578
|
114
|
64
|
20
|
|
394
|
29
|
0
|
0
|
|
184
|
85
|
64
|
20
|
|
|
2017
|
Wang2 [24]
|
China
|
Serum
|
THSD7A
|
WB
|
578
|
114
|
64
|
20
|
|
8
|
1
|
0
|
0
|
|
570
|
113
|
64
|
20
|
|
|
2017
|
Zhang [25]
|
China
|
Serum
|
PLA2R
|
TRFIA
|
69
|
9
|
94
|
286
|
|
49
|
0
|
0
|
0
|
|
20
|
9
|
94
|
286
|
|
|
2018
|
Radice [26]
|
Italy
|
Serum
|
PLA2R
|
IIF
|
252
|
32
|
80
|
43
|
72
|
178
|
9
|
1
|
0
|
0
|
74
|
23
|
79
|
43
|
72
|
|
2019
|
Cheng [27]
|
China
|
Serum
|
PLA2R
|
ELISA
|
146
|
|
51
|
62
|
|
102
|
|
0
|
0
|
|
44
|
|
51
|
62
|
|
|
2019
|
Ma1 [28]
|
China
|
Serum
|
circRNAs in exosomes
|
RT-PCR
qPCR
|
10
|
|
|
10
|
|
10
|
|
|
0
|
|
0
|
|
|
10
|
|
|
2019
|
Ma2 [28]
|
China
|
Urine
|
circRNAs in exosomes
|
RT-PCR
qPCR
|
10
|
|
|
10
|
|
10
|
|
|
0
|
|
0
|
|
|
10
|
|
|
2019
|
Zaghrini1[29]
|
France
|
Serum
|
PLA2R
|
ELISA
|
1012
|
|
|
52
|
|
687
|
|
|
0
|
|
325
|
|
|
52
|
|
|
2019
|
Zaghrini2[29]
|
France
|
Serum
|
THSD7A
|
ELISA
|
1012
|
|
|
52
|
|
28
|
|
|
0
|
|
984
|
|
|
52
|
|
|
2020
|
Huang [30]
|
China
|
Serum
|
PLA2R
|
ELISA
|
142
|
|
187
|
40
|
|
110
|
|
0
|
0
|
|
32
|
|
187
|
40
|
|
|
2020
|
Maifata1 [31]
|
Malaysia
|
Serum
|
PLA2R
|
ELISA
|
47
|
22
|
|
24
|
|
13
|
1
|
|
0
|
|
34
|
21
|
|
24
|
|
|
2020
|
Maifata2 [31]
|
Malaysia
|
Urine
|
PLA2R
|
ELISA
|
47
|
22
|
|
24
|
|
13
|
1
|
|
0
|
|
34
|
21
|
|
24
|
|
|
2020
|
Maifata3 [31]
|
Malaysia
|
Serum
|
THSD7A
|
ELISA
|
47
|
22
|
|
24
|
|
4
|
2
|
|
0
|
|
43
|
20
|
|
24
|
|
|
2020
|
Maifata4 [31]
|
Malaysia
|
Urine
|
THSD7A
|
ELISA
|
47
|
22
|
|
24
|
|
0
|
0
|
|
0
|
|
47
|
22
|
|
24
|
|
| 1: SMN control group, 2: other glomerular disease control group, 3: healthy control group, 4: other immune disease control group. Li1 indicates the study with ELISA method. Li2 indicates the study with IIF-CBA method. Wang1 indicates the study of biomarker PLA2R. Wang2 indicates the study of biomarker THSD7A. Ma1 indicates the study of circRNAs in exosomes from serum. Ma2 indicates the study of circRNAs in exosomes from urine. Zaghrini1 indicates the study of biomarker PLA2R. Zaghrini2 indicates the study of biomarker THSD7A. Maifata1 indicates the study of PLA2R from serum. Maifata2 indicates the study of PLA2R from urine. Maifata3 indicates the study of THSD7A from serum. Maifata4 indicates the study of THSD7A from urine. |
The characteristics of the included studies are shown in Table 1. The studies included 20 serum samples and 4 urine samples. Biomarkers included PLA2R, THSD7A, LIMP-2 and circular RNA in exosomes. PLA2R was detected by Western blotting (WB) in three studies, by enzyme-linked immunosorbent assay (ELISA) in seven studies, by immunofluorescence test (IFT) in one study, by indirect immunofluorescence cell-based assay (IIF-CBA) in two studies, by indirect immunofluorescence (IIF) in two studies and by time-resolved fluoroimmunoassay (TRFIA) in one study. THSD7A was detected by WB in two studies and by ELISA in three studies. LIMP-2 was detected by Proteomics. Circular RNAs in exosomes were detected by reverse transcription polymerase chain reaction (RT–PCR) followed by quantitative PCR (qPCR) in two studies. 15 studies used SMN patients as controls, and 14 studies used other glomerular disease patients as controls.
Quality evaluation
The quality evaluation of the selected studies was based on the QUADAS-2, which is shown in Figure 2. Overall, the quality evaluation of the included studies was reliable, but 11 studies had unclear risks in terms of flow and timing, and 2 studies had higher risks in terms of flow and timing. At the same time, 6 studies were unclear on the risks of the index test.
Diagnostic value of PLA2R in IMN
As shown in Figure 3a, in our meta-analysis, the random-effect model was chosen because I2 was 88.47% (P<0.01), implying a high degree of heterogeneity in the study sample. The combined sensitivity was 60% (95% CI: 53%-67%), and the combined specificity was 100% (95% CI: 97%-100%). The combined PLR was 153.30 (95% CI: 21.80-1076.30), the combined NLR was 0.40 (95% CI: 0.34-0.48), and the combined DOR was 382.00 (95% CI: 53.00-2777.00). Figure 3b shows a summary of the receiver operating characteristics (SROC) of the 95% confidence profile and the 95% predicted profile, with an AUC of 0.81 (95% CI: 0.77-0.84), indicating that the diagnostic accuracy of PLA2R in IMN is relatively acceptable.
Diagnostic value of THSD7A in IMN
As shown in Figure 4a, in our meta-analysis, the random-effect model was chosen because I2 had a combined sensitivity of 72.08% (P<0.05), which implies a high degree of heterogeneity in the study sample. The combined sensitivity was 3% (95% CI: 1%-5%), and the combined specificity was 99% (95% CI: 97%-100%). The combined PLR was 4.00 (95% CI: 1.20-13.90), the combined NLR was 0.98 (95% CI: 0.96-1.00), and the combined DOR was 4.00 (95% CI: 1.00-14.00). The SROC summary chart with 95% confidence contour and 95% prediction contour is shown in Figure 4b. The AUC was 0.52 (95% CI: 0.48-0.57), indicating that THSD7A has a relatively low level of influence on the diagnostic accuracy of IMN.
Diagnostic value of other biomarkers in IMN
There was one study testing LIMP-2 in urine with proteomics. The sensitivity was 100% (95% CI: 48%-100%), and the specificity was 100% (95% CI: 63%-100%). There were two studies testing circRNAs in exosomes in serum and urine. The sensitivity was 100% (95% CI: 69%-100%), and the specificity was 100% (95% CI: 69%-100%).
Predicted posterior probability of PLA2R and THSD7A in IMN
As shown in Figure 5, the pre-test probability of PLA2R was 20%, and the post-test probability of PLA2R was 97%. The pre-test probability of THSD7A was 20%, and the post-test probability of THSD7A was 50%. This means that PLA2R and THSD7A can improve the diagnosis of IMN.
Subgroup and sensitivity analysis of PLA2R
The causes of heterogeneity were analyzed by subgroup analysis. As shown in Table 2, the diagnostic accuracy rate of PLA2R testing in Asia was higher than that in Europe. There were also other factors, such as method, sample, controls and sample size.
Table 2
Subgroup analysis of PLA2R in the diagnosis of IMN
|
Subgroup
|
N
|
Sensitivity
|
Specificity
|
PLR
|
NLR
|
AUC
|
|
Region
|
|
|
|
|
|
|
|
America
|
1
|
-
|
-
|
-
|
-
|
-
|
|
Europe
|
5
|
0.61(0.54-0.68)
|
1.00(0.57-1.00)
|
1853.5(0.8- 4.1e+0.6)
|
0.39(0.32-0.47)
|
0.76(0.72-0.80)
|
|
Asia
|
10
|
0.58(0.47-0.69)
|
0.99(0.93-1.00)
|
51.1(8.20-317.10)
|
0.42(0.32-0.55)
|
0.82(0.79-0.85)
|
|
Method
|
|
|
|
|
|
|
|
WB
|
3
|
-
|
-
|
-
|
-
|
-
|
|
IFT
|
1
|
-
|
-
|
-
|
-
|
-
|
|
IIF-CBA
|
2
|
-
|
-
|
-
|
-
|
-
|
|
TRFIA
|
1
|
-
|
-
|
-
|
-
|
-
|
|
IIF
|
2
|
-
|
-
|
-
|
-
|
-
|
|
ELISA
|
7
|
0.55(0.40-0.69)
|
1.00(0.97-1.00)
|
151.60(9.00-2559.30)
|
0.45(0.32-0.63)
|
0.88(0.85-0.91)
|
|
Sample
|
|
|
|
|
|
|
|
serum
|
15
|
0.62(0.56-0.68)
|
1.00(0.97-1.00)
|
206.90(22.20-1930.60)
|
0.38(0.32-0.45)
|
0.79(0.76-0.83)
|
|
urine
|
1
|
-
|
-
|
-
|
-
|
-
|
|
Control
|
|
|
|
|
|
|
|
SMN
|
11
|
0.57(0.47-0.66)
|
0.98(0.94-1.00)
|
36.50(9.30-143.80)
|
0.44(0.35-0.54)
|
0.81(0.77-0.84)
|
|
SMN+other glomerular disease
|
8
|
0.63(0.57-0.68)
|
1.00(0.82-1.00)
|
131.00(3.20-5442.00)
|
0.38(0.32-0.44)
|
0.73(0.69-0.76)
|
|
Other immune disease
|
3
|
-
|
-
|
-
|
-
|
-
|
|
Sample size
|
|
|
|
|
|
|
|
≤300
|
10
|
0.53(0.44-0.62)
|
0.99(0.95-1.00)
|
69.80(10.80-451.60)
|
0.47(0.38-0.58)
|
0.79(0.75-0.82)
|
|
>300
|
6
|
0.69(0.65-0.72)
|
1.00(0.88-1.00)
|
678.40(5.00-91324.20)
|
0.31(0.28-0.35)
|
0.74(0.70-0.77)
|
Subgroup and sensitivity analysis of THSD7A
Table 3 shows that the diagnostic accuracy rate of THSD7A in serum is higher than that in urine.
Table 3
Subgroup analysis of THSD7A in the IMN diagnosis
|
Subgroup
|
N
|
Sensitivity
|
Specificity
|
PLR
|
NLR
|
AUC
|
|
serum
|
4
|
0.03(0.02-0.06)
|
0.99(0.97-1.00)
|
3.7(1.2-11.7)
|
0.98(0.96-1.00)
|
0.55(0.5-0.59)
|
|
urine
|
1
|
-
|
-
|
-
|
-
|
-
|
Publication bias evaluation
The publication bias of the included studies was evaluated by Deeks' funnel plot asymmetry test. As shown in Figure 6, the results showed that the PLA2R (P=0.80) and THSD7A (P=0.61) studies had no publication bias. P<0.05 indicates publication bias.