Production of bacterial cellulose
BC was obtained by static culture fermentation with Komagataeibacter sucrofermentans ATCC 700178 (from the American Type Culture Collection) as described in Rodrigues et al. [62]. Briefly, the culture medium was composed by 40 g/L molasses, 7 g/L Corn Steep Liquor, 0.5 % (m/v) ammonium sulphate, 2.7 g/L disodium hydrogen phosphate, 1.15 g/L citric acid and 1.5 % (v/v) of ethanol. Culture medium pH was adjusted to 5.5. The growth culture (inoculum) was incubated for 2d at 30 °C under static conditions. Afterwards, it was transferred to sterile containers with fresh culture medium, making up 10 % of their final volume. The containers were incubated in static conditions for 10 days at 30 °C. After cultivation, the obtained BC was purified using 0.1 M sodium hydroxide, 1% (v/v) Divosan Hypochlorite and water, each step lasting 24h, at room temperature. Then, BC was ground into a pulp using a blender and concentrated through centrifugation at 3667xg for 30 minutes, to 5 % (m/v) final solids and stored at 4 ºC, until use.
Compliance with ethical and procedural standards for animal experimentation
The study was performed at Instituto de Investigação e Inovação em Saúde (I3S), Universidade do Porto (Porto, Portugal). The experimental procedures followed the EU Directive 2010/63/EU and National Decreto-Lei 113/2013 legislation for animal experimentation and welfare. The rats’ housing, handling and experimentation were accredited by the Portuguese National Authority for Animal Health, Direção-Geral de Alimentação e Veterinária (DGAV) (approval nº 012910/2020-08-[7]. Although, the experimental design deviated in some points from the OECD Guideline 408, such as the duration, amount of test substance, timeframe and bloodwork analyses, its execution fully complied with the quality standards.
Animals, housing and feeding conditions
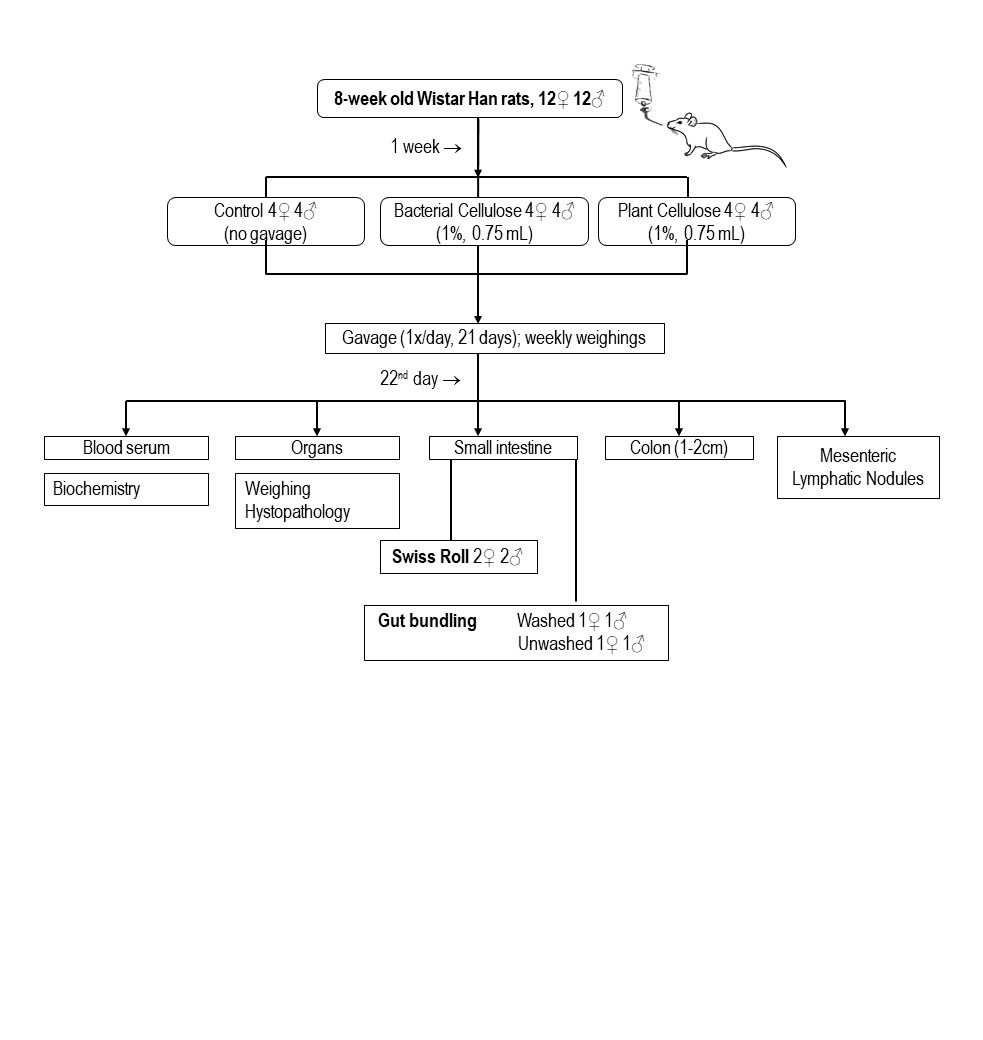
Eight weeks old Wistar Han IGS Rats [Crl:WI(Han)] (Wistar Rats), twelve males and twelve females, were used in this study. The rats were obtained from Charles River (Barcelona, Spain) and bread at I3S. On arrival the animals were examined for signs of health status, followed by a one-week adaptation period. They were kept under controlled environmental conditions for one week before starting the experiment. Afterwards, each male and female rat was randomly allocated in groups of 2 to compose the different experimental groups. After allocation, each rat was uniquely numbered with a color marker in their tail and placed in polycarbonate type III H cages with a stainless-steel wire lid and a polysulphone filtertopcage (Tecniplast), with corncob and carboard tubes as bedding materials. An artificial light/dark cycle with a sequence of 12 h was applied. The room was ventilated with about 15-20 air changes per hour. A temperature of 22 ± 2 °C and a relative humidity of 55 ± 15% was maintained.
Food and water were provided ad libitum to all animals during the experiment. They received a commercial 2014S Teklad rodent diet (Teklad diets, ENVIGO) based on 14.3 % crude protein, 4% fat, 48% carbohydrates and 4.1% crude fiber in addition to vitamins and fatty acids.
Test substance and dosing concentration
Given the high viscosity of BC, the aqueous concentration for daily oral gavage was adjusted to 1% (m/v) – as measured by gravimetry after drying overnight at 105 ºC. The ground BC suspension was then sterilized by autoclaving for 20 minutes, at 120 °C and 1 bar.
In parallel, 1% (m/v) aqueous suspension of commercial plant cellulose (PC), Avicel LM310 (kindly provided by FMC Biopolymers) was also prepared and sterilized.
All the cellulose suspensions were prepared beforehand and stored at 4 ºC. Before oral administration, the suspensions were warmed to room temperature and homogenized by vigorously vortex agitation.
21-day repeated-dose toxicity study
The study comprised two dose groups and one control group, each having four rats/sex (Table 3). Each rat from the dosing groups received a single dose of 0.75 mL of 1 % cellulose suspension (plant or bacterial), daily, for a period of 21 days. The administration was performed in the morning at a fixed time by oral gavage, using a polypropylene gavage needle of 1.3x1.3 mm without ball tip. The control group did not receive oral gavage.
Table 3 Test groups and substances administered.
|
Group
|
Test substance (21 days)
|
Nr. animals
|
|
Control
|
No gavage
|
4 male + 4 female
|
|
BC
|
1% Bacterial cellulose; 0.75 mL/day
|
4 male + 4 female
|
|
PC
|
1% Plant Cellulose - (Avicel LM 310); 0.75 mL/day
|
4 male + 4 female
|
The animals’ well-being was observed daily, and all the cages were inspected for possible deaths or moribund animals, twice daily. Detailed clinical observations were conducted prior to the first exposure to the compounds (pre-dose) and once a week thereafter. All animals were assessed for the following clinical signs: changes in the eyes, skin, fur, mucous membranes, secretions and excretions, autonomic activity and changes in their gait. Their individual body weight was recorded at start of the treatment (day 0), in weekly intervals thereafter, and before the euthanasia. By the end of experiment, the animals were deeply anesthetized with gaseous isoflurane in 0.2-0.3 L/min O2, and terminal blood was collected by intracardiac puncture into CAT serum Sep Clot Activator tubes (VACUETTE®) for analyses of the biochemical parameters. The blood samples collected for biochemistry were allowed to clot and the serum was obtained by centrifugation at 5000xg for 10 minutes. All animals were subjected to gross necropsy.
Clinical biochemistry tests
Serum markers analysis was performed at the Instituto de Ciências Biomédicas Abel Salazar (ICBAS) da Universidade do Porto (Porto, Portugal), using the IDEXX equipment, Catalyst One Chemistry Analyzer. The assessed parameters comprised alanine albumin (ALB), aminotransferase (ALT), alkaline phosphatase (ALP), aspartate aminotransferase (AST), total bilirubin (TBIL), blood urea nitrogen (BUN), chloride (Cl-), creatinine (CREAT), globulin (GLOB), glucose (GLU), osmolality, potassium (K+), sodium (Na+), total cholesterol (CHOL), total protein (TP) and urea.
Gross examination and histopathology
Following euthanasia, the kidneys, liver and spleen from all animals were collected, trimmed off of any adherent tissue for necropsy examination and weighted. The animals’ intestinal tract was also collected and processed by two different procedures [63] (Table 4), described in section Cellulose tracking- intestinal-tract histological processing.
The collected organs were fixed with 4% paraformaldehyde (PFA) and processed for paraffin-embedding in an automated tissue processor (Leica EG140C Pathology Embedding Center Paraffin Dispenser). Paraffin embedded specimens were cut in 5 μm-thick sections (MICROM HM325) and stained with hematoxylin & eosin (H&E), using an automated stainer (LEICA ST5010 Autostainer XL). Also, histological samples of the different regions of the intestinal tract from the different experimental groups were subjected to H&E staining. All H&E-stained samples were visualized using an optical microscope (BX61 Olympus) coupled to a DP74 digital camera (Olympus) and using bright field. Images were acquired using CellSens Imaging Software Version 1.16 (Olympus). The histopathological analysis was blindly conducted by an independent experienced pathologist.
Cellulose tracking –intestinal-tract histological processing
Gut bundling technique (GBT)
The GBT was adopted for half of the females and males from each experimental group (Table 4). The small and large intestines were exposed and collected. Afterwards, they were cut into three equal segments to obtain the duodenum, jejunum, and ileum regions. The distal colon and the mesenteric lymph nodes (MLN) from each animal were also collected. For one female and male of each experimental group, the lumen of each small and large intestinal segment was washed with phosphate buffer saline (PBS), while for the other female and male, the collected intestines were not washed. All the collected intestinal segments and the mesenteric lymph nodes were embedded in OCT (Optimal Cutting Temperature) compound (Tissue-Tek®, SakuraTM, The Netherlands), frozen using isopentane in liquid nitrogen and cryo-sectioned in 20 µm-thick sections using a cryostat (LEICA CM 1900).
Swiss roll technique (SRT)
For the remaining animals of each group, two males and two females (Table 4), the small intestines were collected and cut into three equal segments to obtain the duodenum, jejunum, and ileum regions (as with the GBT). Similarly, the distal colon was also collected, as well as the mesenteric lymph nodes from each animal. The lumen of each small and large intestine-portion was washed with PBS, cut longitudinally, opened so that the lumen is facing upward and then rolled. All these tissues were embedded in OCT compound (Tissue-Tek®, SakuraTM, The Netherlands), frozen using isopentane in liquid nitrogen and cryo-sectioned in 20 µm-thick sections using a cryostat (LEICA CM 1900).
Table 4 Histological processing methods for observation of the rats’ intestinal tract.
|
Group
|
Nº animals
|
|
Technique
|
|
|
|
# i
|
4M + 4F
|
2M + 2F
|
Gut bundling
|
1M + 1F
|
Washed
|
|
1M + 1F
|
Unwashed
|
|
2M + 2F
|
Swiss roll
|
2M + 2F
|
|
i –test group (Control, BC and PC); M – male; F – female;
Staining and microscopic observations
To assess the intestinal fate of cellulose, all collected samples from the distinct regions of the intestinal tract and the MLNs were subjected to cellulose staining using a Carbohydrate-binding module (CBM3A from Clostridium cellulolyticum) coupled to a green fluorescent protein (CBM-GFP) (NZYTech Ltd), as previously described with some modifications [64]. Briefly, the samples were fixed with a 4 % PFA solution for 30 min, followed by a washing step with PBS buffer. Permeabilization was carried out with 0.5 % Triton X-100 in PBS at room temperature, in a humid chamber; then the blocking step was performed with 10 % (v/v) fetal calf serum (FCS) in PBS for 1h. For actin-cytoskeleton staining, the slides were incubated with Phalloidin-TRITC (1/500 dilution from a stock solution 0.5 mg/mL) (Sigma- Aldrich) for 1h in a humid chamber. Then, the samples were washed with PBS (three times, 3 min each) and incubated with CBM-GFP (1/20 dilution from a stock solution 1 mg/mL) for 2 h at room temperature in a humid chamber. Sections were washed again with PBS and incubated with DAPI (1/1000 dilution from a stock solution 1 mg/mL) (Thermo Scientific) for 10 min, for nucleus visualization. Finally, the slides were washed with PBS (three times; 5 min each) and mounted with permafluor mounting media (Thermo Scientific). Fluorescent staining was visualized using a fluorescence microscope (BX61, Olympus) coupled to a DP74 digital camera (Olympus), using a set of three filters (DAPI 360-370/420nm Olympus U-MNU2; GFP 425-440/505-540nm, Chroma 31019; TRITC 530-550/575nm, Olympus MWIG3). Images were acquired using CellSens Imaging Software Version 1.16 (Olympus). Confocal images of fluorescent stained histological samples were also acquired using a Laser Scanning Confocal Microscope (FluoView 1000, Olympus) with a 60x oil, 1.35 NA objective lens. Z-stack images were acquired using the following laser lines: 405 nm laser (for DAPI), 488 nm laser (for GFP fluorophore) and 559 nm (for TRITC). Confocal pinhole was adjusted to 1.0 Airy unit of optical slice, and z-stacks were acquired every 0.5 μm between each z-section. Images were acquired with the software FV10-Ver4.1.1.5 (Olympus).
Statistical analysis
The obtained raw data were statistically analyzed using Graph Pad Prism software (version 5.01, windows). The values were expressed as the mean ± standard deviation of the mean (SD). Differences in data of body weight and body weight gain, organ weight, hematological and clinical biochemistry were statistically analyzed using Two-way repeated measure ANOVA, with Geisser-Greenhouse correction and Tukey post hoc test. All analyses and correlations were assessed at 95 % level of confidence (p < 0.05).