Materials
Romidepsin was obtained from Celgene Corporation (Summit, NJ, USA). RPMI 1640 medium, gemcitabine, tamoxifen, paclitaxel, α-tocopherol, TRI reagent, siomycin A, 3-(4,5-dimethyl-2-thiazolyl)-2,5-diphenyltetrazolium bromide (MTT) and Hoechst 33342 were purchased from Sigma-Aldrich Japan (Tokyo). N-Acetyl-cysteine (NAC) was obtained from Wako Pure Chemical (Tokyo, Japan). Vorinostat (N-hydroxy-N’-phenyloctanediamide) was purchased from Tokyo Chemical Industry Co. Ltd, Japan. Entinostat and panobinostat were obtained from MedChemExpress (Monmouth Junction, NJ, USA). FOXM1 siRNA and control siRNA were purchased from OriGene Technologies, Inc. (Rockville, MD, USA). MitoPeDPP and a MT-1 MitoMP detection kit were purchased from Dojindo Laboratories (Kumamoto, Japan).
Cells and culture
Human pancreatic cancer cell lines (Panc1 [RRID:CVCL_0480], CFPAC1 [RRID:CVCL_1119], MIAPaCa2 [RRID:CVCL_0428], BxPC3 [CVCL_0186] and Capan2 [RRID:CVCL_0026] were purchased from American Type Culture Collection (Manassas, VA, USA). Cells were cultured in RPMI-1640 medium (Sigma-Aldrich Japan) supplemented with 10% fetal bovine serum and 80 µg/ml gentamicin at 37oC in a humidified atmosphere of 5% CO2 in air.
Assay of cell growth
Human cancer cells were seeded into 24-well multidishes at 1.0 × 10⁴ cells/ml/well. The cells were cultured with various concentrations of drugs for 4-6 days. After culture with or without drugs, viable cells were examined by the MTT assay [12].
Assay of cell senescence
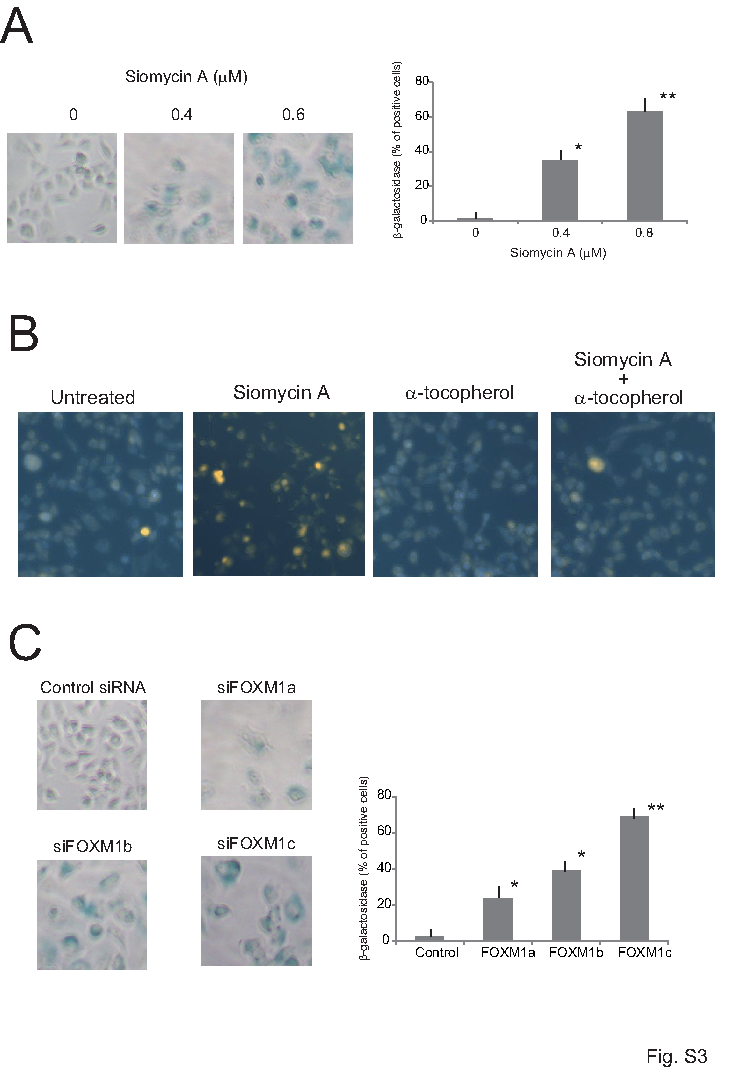
To examine cell morphology, cells were stained with Giemsa. Senescence-associated β-galactosidase activity was measured using a Senescence detection kit I (PromoKine, Heidelberg, Germany) according to the instructions provided by the manufacturer.
Assay of the cumulative cell number
The cell density of the drug-treated cells was kept at 2-8 x 10⁴/ml to maintain the growth phase in a 24-well multidish. The medium of treated cultures was replaced by fresh medium with drugs at least every 4 or 5 days to remove cell debris from dead cells. The viable cell number was measured by the MTT assay. The cumulative cell number was calculated from the MTT values and the dilution used when feeding the culture.
Transplantation Of Human Cancer Cells Into Nude Mice
Four-week-old female athymic nude mice with a BALB/c genetic background were obtained from CLEA Japan (Tokyo) and housed under specific pathogen-free conditions. Mice were subcutaneously inoculated with 2 × 10⁶ CFPAC1 cells (0.1 ml of 2 x 10⁷ cells/ml). Mice were given an intraperitoneal injection of 2 mg/kg romidepsin in 0.1 ml PBS and/or a subcutaneous injection of 15 mg/kg tamoxifen in 0.1 ml corn oil, with the first treatment given 5 days after the inoculation of tumor cells. Treatment was performed three times per week. Tumor volume was measured with vernier calipers. Mice were sacrificed by exposure to CO2 without removing animals from their home cage with a flow rate displacing 20% of the cage volume per minute. Death was confirmed by observation of pupil dilation as well as ceasing of breath (absence of chest fluctuation) and the heartbeat. Our protocol was approved by the animal ethics committee at Shimane University.
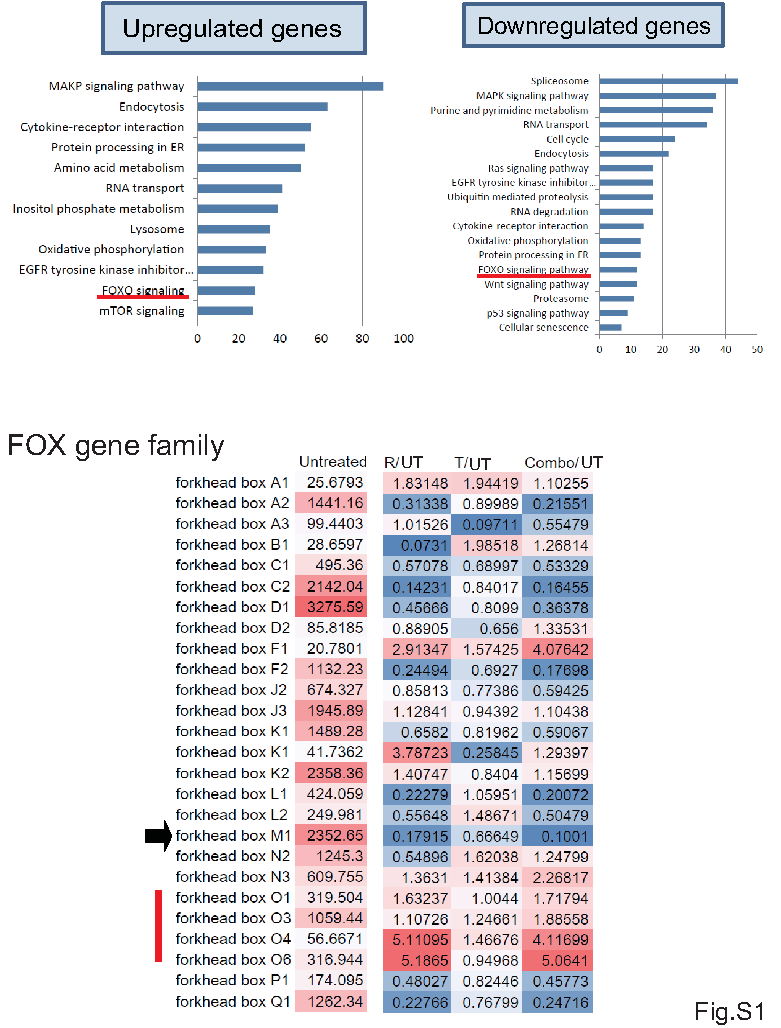
cDNA microarray analysis
Gene expression was measured using the Affymetrix Human Genome U133 Plus 2.0 array and the prescribed procedure outlined in the Affymetrix technical manual. Gene expression levels were normalized using the robust multiarray average method (Takara Bio Inc., Tokyo, Japan). Array data have been deposited in the Gene Expression Omnibus, accession number GSE182526.
Reverse Transcription-polymerase Chain Reaction (Rt-pcr)
Reverse transcription-polymerase chain reaction (RT-PCR)
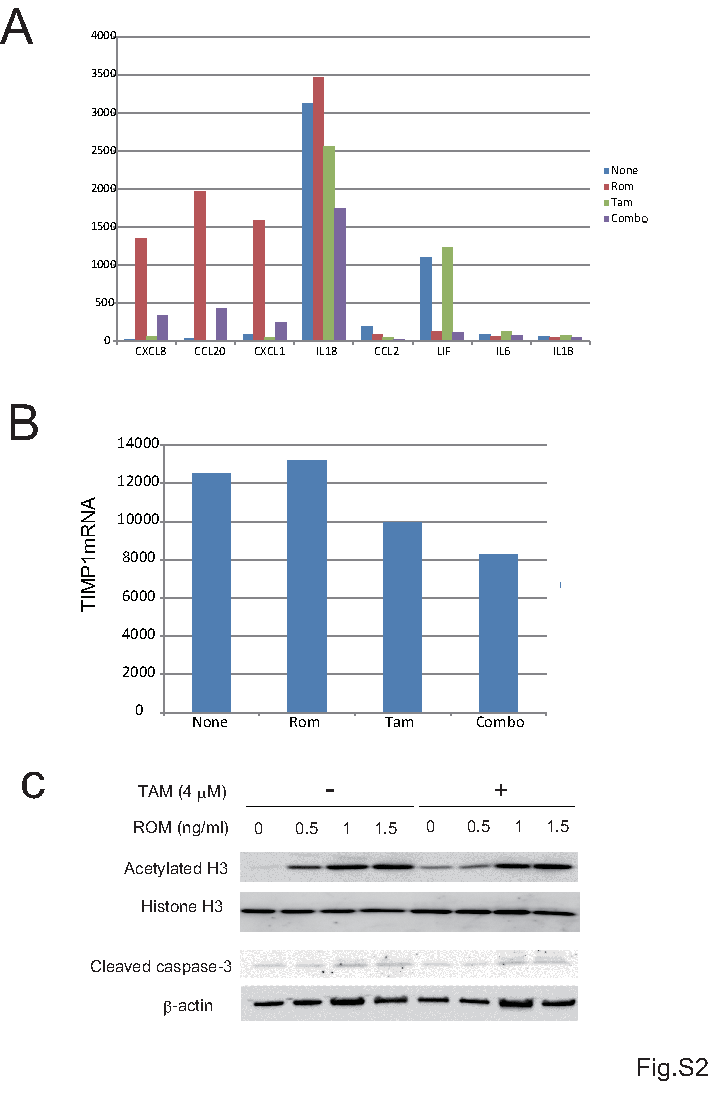
Total RNA was extracted from cells using TRI reagent (Sigma). Total RNA was converted to first-strand cDNA primed with random hexamer in a reaction volume of 20 µl using an RNA PCR kit (qPCR RT Master Mix, Toyobo Co. LTD, Osaka, Japan), and 2 µl of this reaction was used as a template in real-time PCR. The qPCR conditions were 95°C for 10 min followed by 40 cycles of 95°C for 15 sec, 60°C for 30 sec and 72°C for 30 sec. The levels of FoxM1 mRNA were quantified using the 2−ΔΔCT method. The threshold cycle values were normalized to the threshold value of glyceraldehyde-3-phosphate dehydrogenase. Primers for the reactions are shown in Table S1.
Western blot
Cells were packed after being washed with cold PBS and then lysed at 1.5 x 10⁷ cells/ml in sample buffer. The resultant lysate was resolved on SDS-polyacrylamide gel, as described elsewhere [7]. Primary antibodies were obtained from the following sources: anti-FOXM1, anti-FOXN3 and anti-FOXO3 antibodies (Abcam, Tokyo, Japan), anti-acetyl histone H3 (Lys9/27) and histone H3 antibodies (Medical & Biological Laboratories, Nagoya, Japan).
Sirna And Transfection
Panc1 cells were seeded at 5×10⁴cells/well in 24-well plates, and incubated for 4 days in culture medium in the presence of 20 nM siRNA directed against FOXM1. The cells were transfected using Lipofectamine RNAiMAX Reagent according to the manufacturer's instructions (Invitrogen, Carlsbad, CA, USA). The cells were seeded onto plates and transiently transfected with the desired concentrations of FOXM1 siRNA in Opti-MEM medium (Life Technologies Corp., Grand Island, NY, USA). Sequences of siRNA are shown in Supplementary Table S1. All experiments were conducted in triplicate using independent cultures.
Measurements of intracellular reactive oxygen species (ROS), mitochondrial lipid peroxidation (LPO) and membrane potential
The production of ROS was monitored using dihydroethidium (Muse Oxidative Stress kit, Millipore, Billerica, MA, USA). After incubation, fluorescence images were captured using an automated cellular imaging system (IN Cell Analyzer 2000, Cytiva, Tokyo, Japan) and ROS-positive cells were calculated. LPO was determined using MitoPeDPP [13]. Cells were washed twice with PBS, and then treated with 0.5 µM MitoPeDPP in Hanks’ HEPES buffer for 15 min at 37°C under dark conditions. After being washed once with PBS, the cells were treated with or without romidepsin and/or tamoxifen. After treatment, fluorescence images were captured using an automated cellular imaging system (IN Cell Analyzer 2000) and LPO was evaluated. The mitochondrial membrane potential was measured using an MT-1 MitoMP Detection kit (Dojindo) according to the instructions provided by the manufacturer. The cells were stained for detection of nuclei (Hoechst 33342) immediately before image acquisition. After treatment, fluorescence images were captured using an automated cellular imaging system (IN Cell Analyzer 2000) and mitochondrial membrane potential was evaluated.
Statistical analysis
The results are expressed as means±standard deviation (SD). Pairs of data were compared using Student’s t-test. Significant differences were considered to exist for probabilities below 5% (P<0.05). For the in vivo experiment, an F-test was performed to demonstrate statistical significance. Significant differences were considered to exist for probabilities below 5%.
.
.