Animals.
Ethical statement. All procedures complied with the guidelines of the Association for Assessment and Accreditation of Laboratory Animal Care, and the protocol was approved by the Institutional Animal Care and Use Committee of First Affiliated Hospital of Xinjiang Medical University (protocol number IACUC20191011-01).
Amino acids and bacterial strain.
D-isomers of amino acids, including phenylalanine (Phe), proline (Pro) and tryptophan (Trp), were purchased from Sigma. For bacterial cultures, D-AA stocks were prepared in 0.5 M HCl at concentrations between 150 and 200 mM. There were diluted into Mueller Hinton (MHB-II) broth that was neutralised to pH 7.4, and the stocks were then stored at - 80 °C. Staphylococcus aureus ATCC 25923 was used for this study. Four clinical Staphylococcus aureus strains that were characterised according to biofilm formation were isolated from PJI patients as described in our previous study31 (Supplementary Table 1). For all studies, the strains were cultured at 37 °C overnight in tryptic soy broth (TSB) media with agitation.
Induction and treatment of PJI in a rat model.
Eight-week-old male Sprague-Dawley (SD) rats were purchased from the Animal Centre of Xinjiang Medical University. Animal handling conditions included a humidity of 55 ± 5%, a temperature of 25 ± 2 °C, and a 12 h light/dark cycle. All rats were maintained under specific pathogen-free conditions and provided with autoclaved food and water ad libitum. The rats were anaesthetized using 10% hydrated chloral solution (Aladdin, 4 mL kg−1 body weight). The joint capsule of the right knee was opened through a medial parapatellar arthrotomy (Fig. 1A). After exposing the intercondylar notch, the femoral canal was reamed with sequentially larger needles until an orthopaedic-grade Kirschner wire (1.0 mm in diameter and 20.0 mm in length; Synthes) was exactly inserted in a retrograde fashion with 1 mm of wire protruding into the joint space (Fig. 1B-D). The arthrotomy site was sutured using with interrupted 4# Monocryl (Ethicon) and then injected with Staphylococcus aureus (1×10⁴ colony-forming units [CFUs] in 10 µL saline) (Fig. 1E,F). Finally, the skin was closed. Beginning the second week afer Kirschner wire implantation, a therapeutic dose of vancomycin (110 mg/kg twice daily) (Novaplus; Hospira, Inc., Lake Forest, IL) was administered by subcutaneous injection in the vancomycin gruop. On this basis, D-AAs were injected into the articular cavity once weekly in the vancomycin plus D-AAs group.
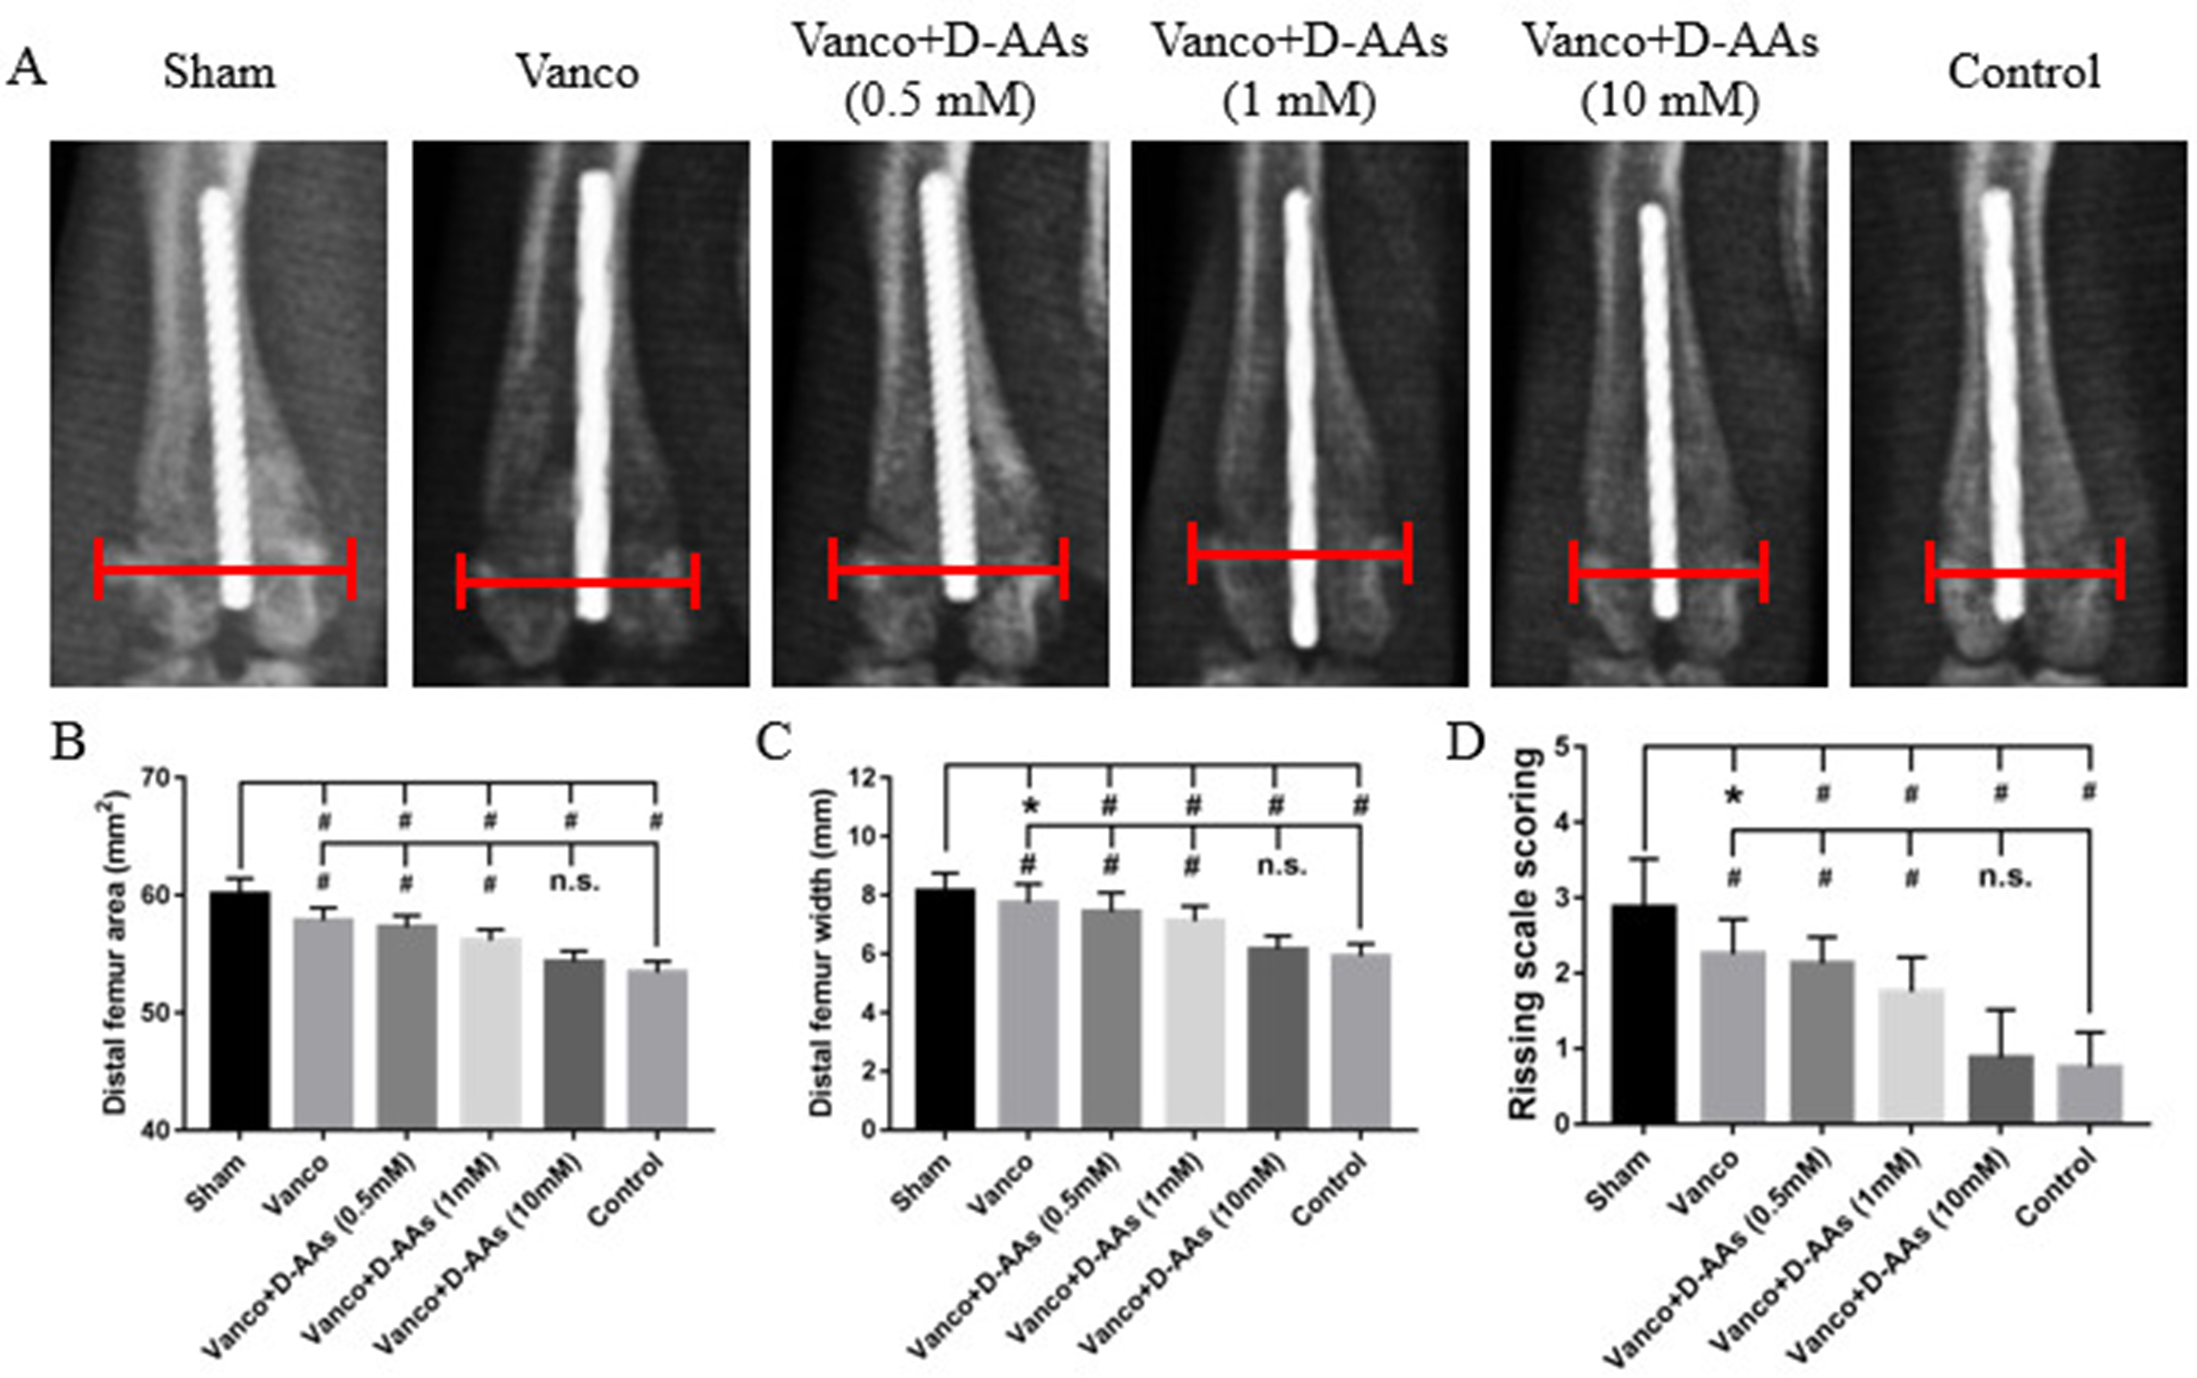
A preliminary experiment was performed first to identify the optimal dose of D-AAs. Rats were randomly assigned to the control group, sham group, vancomycin group, and D-AAs groups at various concentrations (0.5, 1, and 10 mM; n = 8 per group). After treatment for 6 weeks, lower concentrations of D-AAs (0.5 or 1 mM) exerted minimal effects on the local response (Supplementary Fig. 1). Based on this, in the formal experiment, the rats were randomised to the control group, sham group, vancomycin group, and a 10 mM D-AAs combined with vancomycin group ( n = 20 per group, where 8 rats were used for tissue homogenate, 8 rats were used for immunostaining and 4 rats were used for SEM analysis). Additionally, 16 rats were randomly assigned to the sham group and various concentrations of D-AAs groups (0.5, 1, and 10 mM) to evaluate the biofilm lysis potential of D-AAs alone after 6 weeks by SEM.
Systemic and local response analysis.
The weights of all rats were measured and recorded once every two weeks. Serum samples were collected from the left ventricle immediately after sacrifice. The serum concentrations of α2M, IL-1β, IL-6, IL-10, TNF-α, and PGE2 were determined by ELISA according to the manufacturer’s instructions (CUSABIO, China). ELISA results were quantified according to absorbance at 450 nm as assed using a microplate reader (Bio-Rad, Hercules, CA, USA), and these values were normalised according to the number of cells per well.
The weight-bearing activity of rats was assessed using ink blot analysis and was graded for each rat as full (3 points), partial (2 points), toe-touch (1 point), or non-weight-bearing (0 points)36. The front paws of the rats were covered with dark blue ink, and the hind paws were covered with red ink.
Radiographs were assessed using Image J software. The maximal femoral width was calculated perpendicular to the anatomical axis of the distal portion of the femur. The area of the distal 25% of the femur (from the midpoint of a line extending from the intercondylar notch to its intersection with a perpendicular line that bisected the third trochanter) was also measured. The local tissue response was evaluated at the time of implant-bone harvest according to the Rissing score37.
SEM analysis.
After acquisition, samples were fixed with 2.5% (w/v) glutaraldehyde and 0.15 M sodium cacodylate buffer for 3 h. Samples were then rinsed with 0.15 M sodium cacodylate buffer and fixed for 1h in 1% (v/v) osmium tetroxide in sodium cacodylate buffer. Samples were dehydrated with ethanol and then incubated with hexamethyldisilizane, and this was followed by drying in a desiccator overnight. Samples were sputter-coated with gold palladium and observed using a JEOL-6610 scanning electron microscope.
Biofilm formation and dispersal assays.
Biofilm formation was assessed under static conditions for 24 h in polystyrene 24-well plates (Corning, Inc., Corning, NY, USA). Briefly, after overnight incubation, the culture medium was removed and fresh medium containing either an individual D-AA or a 1:1:1 mixture of D-Trp: D-Pro: D-Phe was added at the indicated concentrations. After incubation for 24 h, the wells were washed with phosphate buffered saline (PBS) and then stained with 0.1% (w/v) crystal violet (Sigma Aldrich, St. Louis, MI, USA) at room temperature for 15 min. Next, biofilm biomass was examined by measuring the optical density at 570 nm of the crystal violet that was solubilised in 80% (v/v) ethanol. All assays were performed in triplicate.
Ex vivo bacterial burden.
After euthanasia, the peri-implant bone and soft tissues were harvested along with the implanted K-wires. The bone and soft tissues were homogenised using a sterile tissue grinder, and this was followed by inoculation of 20 μL aliquots onto sheep-blood agar plates (Hardy Diagnostics) for 24 h at 37 °C. The K-wires were sonicated for 10 min and then vortexed for 2 min. Subsequently, 20 μL of sonicated fluid was plated and incubated as described for tissue cultures. The number of CFUs was counted after overnight incubation of the plates. Additionally, to further confirm if the bone tissues, soft tissues, or K-wires retained any bacteria, the homogenates and sonicates were cultured again for an additional 48 h at 37°C. The presence or absence of bacterial CFUs was determined by assessing for the presence or absence of CFUs after 48 h culture of the plates.
Micro-CT analysis.
A high-resolution micro-CT (µCT) was conducted using a SkyScan 1172 Scanner. The data were subsequently reconstructed (NRecon v1.6), analysed (CTAN, v1.9), and re-established for 3D model visualisation (CTVol, v2.0). The coronal view of the 1.5 cm distal femur was selected for 3D histomorphometric analysis. Around the K-wire, a 3 mm region was identified as the region of interest. Three-dimensional structural parameters, including BMD (g cm−3), BV/TV, and Tb.Th (mm), were then analysed.
Histological analysis and immunostaining.
Following euthanasia, the right knee joints of rats were harvested and fixed in 4% paraformaldehyde for 24 h. Then, the knee joints were decalcified for 3 weeks and embedded in paraffin. Sagittal sections of the femur were processed for tartrate-resistant acid phosphatase (TRAP) staining and immunostaining.
For immunostaining, the sections were rehydrated and quenched with endogenous peroxidase before treatment with 0.1% trypsin for 30 min at 37 °C to retrieve the antigen. Then, 20% normal horse serum was used to block the sections to reduce non-specific staining. Sections were then incubated with primary antibodies against osterix (Abcam, 1:400, ab22552). A horseradish peroxidase streptavidin detection system (ZSGB BIO) was used to detect the immunoactivity, and this was followed by counterstaining with haematoxylin (ZSGB BIO). The number of positively stained cells was determined in a blinded manner using cellSens software (Olympus, Int, USA).
Statistical analysis.
Graphpad Prism 5.0 was used to analyse data and to draw diagrams. Significance was determined using a One-Way ANOVA for the comparison of animal systemic and local responses, radiographic findings, and µCT findings using the nonparametric Wilcoxon rank-sum test for the comparison of ex vivo CFUs between different treatment conditions and using the Fisher exact test for the comparison of the percentages of cultures that exhibited any bacterial growth. A p value of < 0.05 was considered significant.