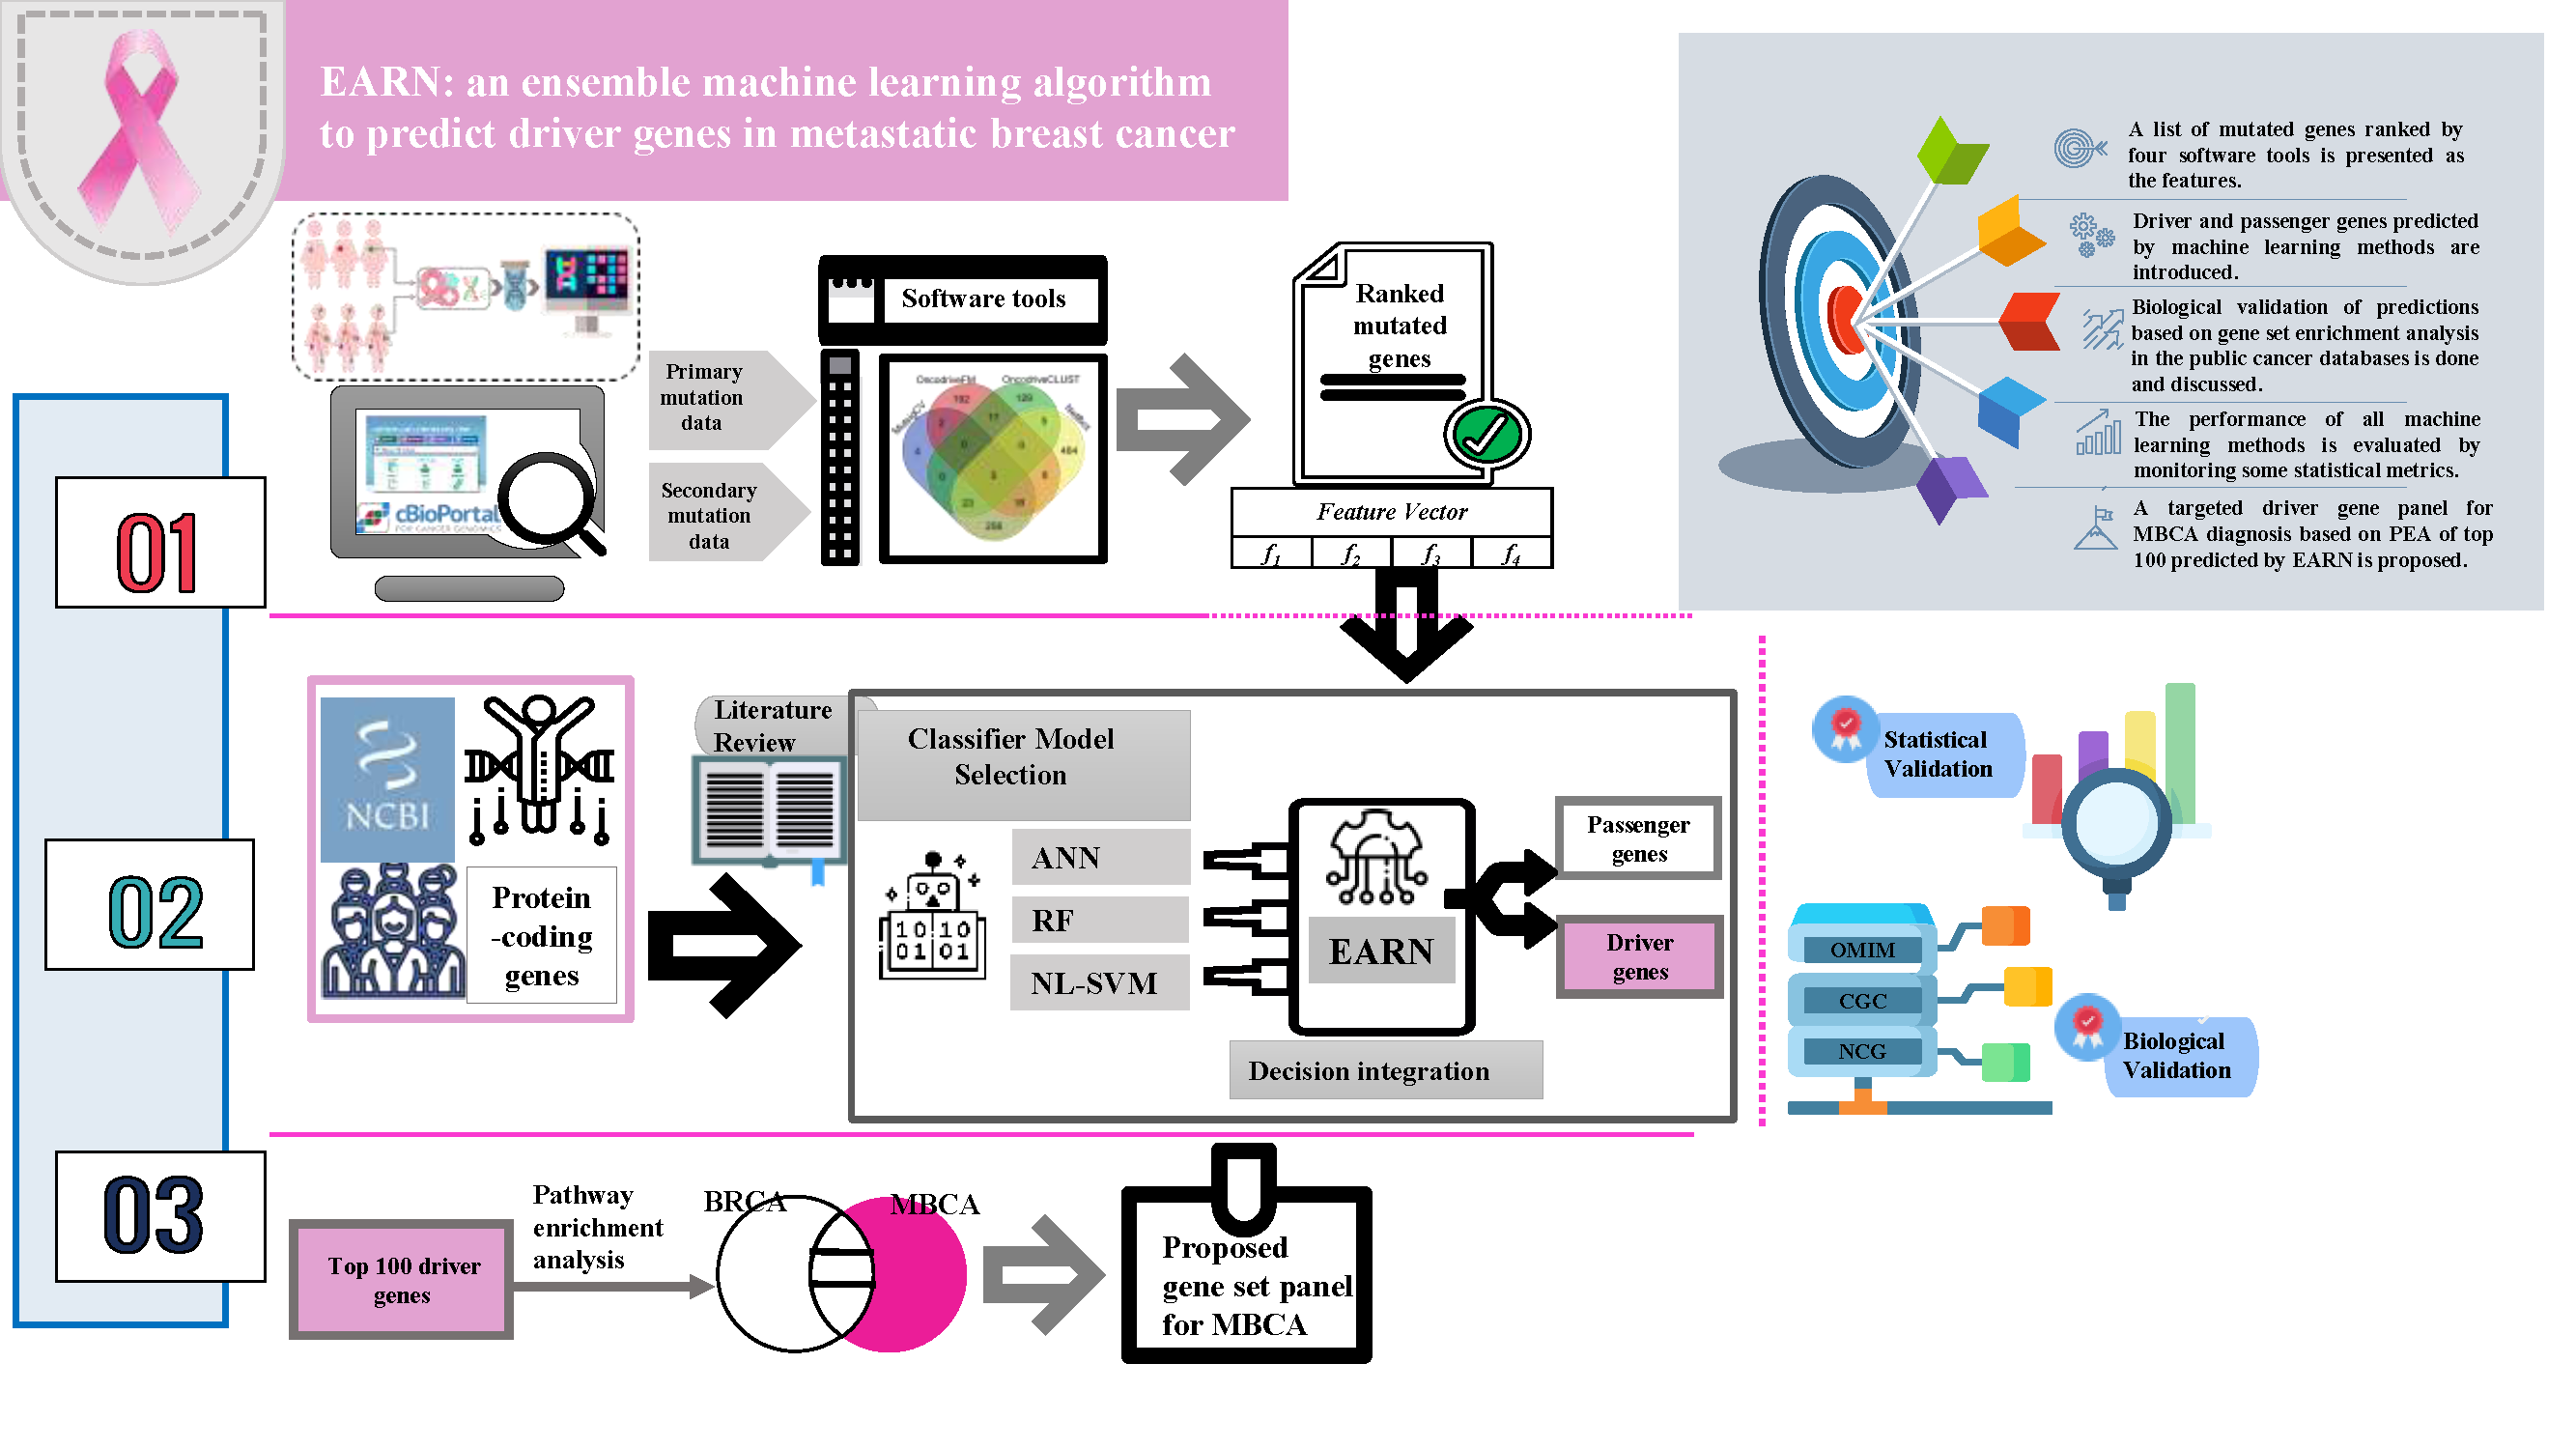
This study is an attempt to focus on the findings in five steps of BRCA and MBCA prognosis and diagnosis. 1. A list of mutated genes ranked by four software tools based on p-value is presented as the features. 2. Driver genes and passengers predicted by three individual machine learning methods, NLSVM, ANN, RF, and the proposed EC are introduced. 3. Biological validation of predictions based on gene set enrichment analysis is done 4. Statistical validation of all learning methods based on evaluation metrics is carried out. 5. A targeted gene panel for MBCA based on pathway enrichment analysis (PEA) is proposed.
3.1 BRCA
The description of the results for BRCA is presented in Additional file 5: Supplementary Results and Table S11 and S12. However, the comparative results of each algorithm for BRCA and MBCA are illustrated in the next section.
3.2 MBCA
3.2.1 Investigation of the diversity of features extracted from the original mutation file
Four software tools are used to extract and rank the list of mutated genes for MBCA as features based on p-value to be used for the machine learning implementation in the next step. The use of multiple tools for generating features creates an effective diverse committee for better classification. It is known that machine learning method can do better discrimination with higher-dimensional feature vectors and perform the classification with higher accuracy (26). To illustrate the existence of diversity in features and also for comparison between results of the tools, we plot the GeneVenn diagram (68) by setting p-value≤0.05 as the threshold. The plotting Venn diagram (p-value≤0.05) shows that the results of four software tools in the ranking of mutated genes for BRCA and MBCA are varied (fig. 4a). It means that the extracted features by these tools from the original mutation file are sufficiently diverse and can be applied for machine learning implementation step. The comparison shows that five genes, C12orf29, OXCT1, PIK3CA, GCNT4, and C8orf44, are just common among the outputs. Also, PIK3CA has been selected by all software tools in both cases of BRCA and MBCA [see the outputs of software tools for BRCA and MBCA, and comparison among mutated genes (p-value≤0.05) extracted by these tools for MBCA in Additional file 6: Table S13-S26].
3.2.2 Outputs of three individual classifiers and EARN
The three base classifiers and EARN predicted the labels and scores of 16698 protein-coding genes for MBCA. The percentage of the predicted driver and passenger genes using the four learning methods for BRCA and MBCA has been shown in Fig. 4b. These findings have been presented in an extra file [see Additional file 7: Table S27-S31].
3.2.3 Investigation of top 100 genes predicted by the four machine learning methods
The comparison of the top 100 genes predicted by the four methods using GeneVenn diagram tool shows that 16 genes are predicted by all four machines for MBCA (Fig. 4c). The results of the enrichment of these genes in public databases are considered in Table 2. Other common and unique driver genes predicted by methods are presented in the extra file [see Additional file 8: Table S32-S41]. Also, among the outputs of EARN100, BDNF, PRKCG, TH, PRKCD, and PIP5K1B are just predicted by this learning machine in the list of top 100 genes. Among these five genes, BDNF and PRKCG have been already introduced regarding metastatic cancers but the others are new.
Table 2 The 16 common genes predicted by all machines in the top 100. The confirmed genes as the known genes related to different primary cancers or primary breast tumors in OMIM, CGC, and NCG databases have been marked in the last two columns
|
Symbol
|
NSCGMCH (#)
|
NSCGMBH
(#)
|
PKGECC
|
PKGEBC
|
|
OXCT1*
|
#N/A
|
#N/A
|
#N/A
|
#N/A
|
|
KDR**
|
7
|
2
|
✓
|
#N/A
|
|
APEX1*
|
#N/A
|
#N/A
|
#N/A
|
#N/A
|
|
GCM2*
|
#N/A
|
#N/A
|
#N/A
|
#N/A
|
|
UNC13D*
|
#N/A
|
#N/A
|
#N/A
|
#N/A
|
|
NCOR1
|
#N/A
|
#N/A
|
✓
|
✓
|
|
KRAS
|
20
|
#N/A
|
✓
|
✓
|
|
THAP3*
|
#N/A
|
#N/A
|
#N/A
|
#N/A
|
|
SERPINE2
|
1
|
#N/A
|
#N/A
|
#N/A
|
|
BATF*
|
#N/A
|
#N/A
|
#N/A
|
#N/A
|
|
C8orf44*
|
#N/A
|
#N/A
|
#N/A
|
#N/A
|
|
C12orf29*
|
#N/A
|
#N/A
|
#N/A
|
#N/A
|
|
ZNF546*
|
#N/A
|
#N/A
|
#N/A
|
#N/A
|
|
KDM6B
|
1
|
#N/A
|
#N/A
|
#N/A
|
|
GCNT4*
|
#N/A
|
#N/A
|
#N/A
|
#N/A
|
|
FOXA1
|
#N/A
|
#N/A
|
✓
|
✓
|
| |
|
|
|
|
|
*Ten new genes that have not already been introduced in the databases.
** KDR is confirmed in HCMDB related to metastatic breast cancer in two studies.
NSCGMCH: Number of studies that have cited genes related to different metastatic cancers in the HCMDB
NSCGMBH: Number of studies that have cited these genes related to metastatic breast cancer in the HCMDB
PKGECC: Predicted known genes by EC associated with different cancers that are confirmed in OMIM, CGC, and NCG
PKGEBC: Predicted known genes by EC associated with Breast cancer that are confirmed in OMIM, CGC, and NCG
3.2.4 Biological validation of predictions based on gene set enrichment analysis
The biological analysis of genes predicted by EARN is performed based on two plans; (a) analysis of the results based on all predicted driver genes (labeled as +1) and (b) analysis of the findings based on the top-scoring genes. To investigate outputs of the EARN for MBCA from a biological point of view based on the label, we analyzed the results concerning the public databases. There is a gene-metastasis association data file (.xls) in the HCMDB that lists 2240 genes related to metastatic cancers based on experiments performed in various studies. 622 genes out of these genes were introduced for metastatic breast cancer specifically. It should be noted that all 37 genes in the positive training gene set have overlap with the gene list of HCMDB in relation to both of different metastatic cancers and metastatic breast cancer. These 37 genes must be excluded to analyze the results. Table 3 (a, b) present the frequency of driver genes enriched in the public databases for MBCA and BRCA.
Table 3 The enrichment rate of driver genes predicted by EARN. (a) MBCA, (b) BRCA
|
(a)
MBCA
|
All different cancers
|
Metastatic breast cancer
|
|
HCMDB
|
HCMDB
|
|
PGECCH
(#)
|
RGCHP
(#)
|
PGECH
(%)
|
PGEMCH (#)
|
RGMHP
(#)
|
PGEMH
(%)
|
|
292
|
2203
|
13.25%
|
73*
|
585
|
12.48%
|
|
(b)
BRCA
|
All different cancers
|
Breast cancer
|
|
OMIM, CGC, and NCG
|
OMIM, CGC, and NCG
|
|
PKGECC
(#)
|
RKGCP
(#)
|
PKGECC
(%)
|
PKGEBC
(#)
|
RKGBP
(#)
|
PKGEBC
(%)
|
|
1398
|
2403
|
58.18%
|
145
|
201
|
72.14%
|
|
*These 73 genes have been also cited in 108 studies of HCMDB [see Additional file 9: S42]
PGECCH: Predicted genes by EC associated with different metastatic cancers that are confirmed in HCMDB
|
|
RGCHP: Remained genes related to different metastatic cancers in the HCMDB after excluding positive training set
|
|
PGEMCH: Predicted genes by EC associated with Metastatic breast cancer that are confirmed in HCMDB
|
|
PKGECC: Predicted known genes by EC associated with different cancers that are confirmed in OMIM, CGC, and NCG
|
|
RKGCP: Remained known genes related to different cancers in the public databases after excluding positive training set
PKGEBC: Predicted known genes by EC associated with breast cancer that are confirmed in OMIM, CGC, and NCG
RKGBP: Remained known genes related to breast cancer in the public databases after excluding positive training set
|
Also, the top 50 genes predicted by all learning methods for MBCA are searched in the list of metastatic cancer-associated genes in the HCMDB. The comparison shows the enrichment score of 24%, 22%, and 16% for RF, ANN, and NLSVM compared to 24% for EARN. Although the value of enrichment in the top 50 is the same for EARN and RF, the number of studies that introduce these enriched genes is 59 for the EARN method compared to 22 for RF. Table 4 presents these genes and also provides more information about them.
Table 4 12 driver genes predicted by EARN50 which are confirmed for metastatic cancers in the HCMDB. Also, the rank number, score, and mutation count for these genes are provided in the table. The confirmed genes as the known genes related to any primary cancers or primary breast tumors in OMIM, CGC, and NCG databases have been marked in the last two columns
|
Symbol
|
Prediction score
|
Rank
|
PSMM
(51)
|
PSMM
(52)
|
NSCGMCH
|
NSCGMBH
|
MCMGM
|
PKGECC
|
PKGEBC
|
|
APEX1
|
0.900511991
|
5
|
0.50%
|
1.70%
|
1
|
#N/A
|
5
|
#N/A
|
#N/A
|
|
ARID1A
|
0.895213526
|
11
|
2.40%
|
5.10%
|
2
|
#N/A
|
24
|
✓
|
✓
|
|
KDM6B
|
0.894029187
|
13
|
1.40%
|
4.60%
|
1
|
#N/A
|
16
|
#N/A
|
#N/A
|
|
TBX3
|
0.893837209
|
14
|
2.80%
|
5.10%
|
1
|
#N/A
|
21
|
✓
|
✓
|
|
KDR*
|
0.890079401
|
17
|
0.90%
|
1.70%
|
7
|
2
|
9
|
✓
|
#N/A
|
|
SERPINE2
|
0.889205475
|
19
|
0.90%
|
0.80%
|
1
|
#N/A
|
4
|
#N/A
|
#N/A
|
|
TBL1XR1
|
0.871240171
|
27
|
0.90%
|
0.80%
|
2
|
#N/A
|
4
|
✓
|
✓
|
|
KRAS
|
0.868267682
|
30
|
1.40%
|
1.70%
|
20
|
#N/A
|
7
|
✓
|
✓
|
|
NOS3
|
0.861560093
|
31
|
2.40%
|
2.10%
|
1
|
#N/A
|
12
|
#N/A
|
#N/A
|
|
RAPGEF3
|
0.851947423
|
42
|
#N/A
|
2.50%
|
2
|
#N/A
|
6
|
#N/A
|
#N/A
|
|
SELE*
|
0.847865292
|
49
|
0.90%
|
1.30%
|
12
|
1
|
5
|
#N/A
|
#N/A
|
|
MME*
|
0.847698297
|
50
|
0.90%
|
2.50%
|
9
|
1
|
9
|
#N/A
|
#N/A
|
* These genes have been specifically introduced concerning metastatic breast cancer.
PSMM: Percentage of samples with one or more mutations based on initial mutation file
NSCGMCH: Number of studies that have cited genes related to different metastatic cancers in the HCMDB
NSCGMBH: Number of studies that have cited genes related to metastatic breast cancer in HCMDB
MCMGM: Mutation counts for mutated genes across 450 metastasis tumor samples based on the initial mutation file
PKGECC: Predicted known genes by EC associated with different cancers that are confirmed in OMIM, CGC, and NCG
PKGEBC: Predicted known genes by EC associated with Breast cancer that are confirmed in OMIM, CGC, and NCG
Furthermore, 38 genes listed by EARN50 have not been introduced in the HCMDB related to any metastatic cancers. So, these genes can be considered as new genes for more investigations [see Additional file 9: Table S43].
3.2.5 Statistical validation of three individual classifiers and EARN based on evaluation measures
For MBCA, a comparison of the metrics based on 3-fold cross-validation on the test data shows that EARN and ANN achieve the best precision with zero FPR. Also, accuracy, F1 score, average precision, and recall for EARN and ANN are better than the others, especially compared with NLSVM. It can be also observed that EARN has the best ROC-AUC (99.24%). Thus, in overall, the proposed EARN outperforms the other three learning methods. For comparison, evaluation metrics of learning methods for MBCA and BRCA are presented in table 5 (a, b).
Table 5 Validation of four learning methods by some evaluation metrics. (a) MBCA, (b) BRCA
|
|
Method name
|
F1 score
|
False Positive Rate
|
Maximum Precision
|
Average-Precision
|
recall
|
ROC-AUC*
|
|
(a)
MBCA
|
EARN
|
0.7961
|
0
|
1.0
|
0.8266
|
0.6701
|
0.9924
|
|
RF
|
0.7560
|
0.0008
|
0.9069
|
0.7873
|
0.6603
|
0.9418
|
|
ANN
|
0.7990
|
0
|
1.0
|
0.8074
|
0.6733
|
0.9680
|
|
NLSVM
|
0.3972
|
0.0154
|
0.3092
|
0.5852
|
0.5885
|
0.9770
|
|
(b)
BRCA
|
EARN
|
0.9313
|
0
|
1.0
|
0.9585
|
0.8749
|
0.9979
|
|
RF
|
0.8864
|
0.0019
|
0.9061
|
0.9171
|
0.8774
|
0.9719
|
|
ANN
|
0.8996
|
0
|
1.0
|
0.9417
|
0.8225
|
0.9873
|
|
NLSVM
|
0.5441
|
0.0279
|
0.4460
|
0.8590
|
0.8422
|
0.9926
|
* Receiver Operating Characteristic-Area under Curve
The comparative survey in table 5 shows when we use a larger mutation dataset (983 tumor samples for BRCA vs. 450 tumor samples for MBCA) for feature extraction, where positive set is larger (40 for BRCA vs. 37 for MBCA), and negative set is smaller (2151 for BRCA vs. 3473 for MBCA), EARN achieves better statistical results. Among all statistical validation metrics, F1 score as a measure of combining the precision and recall has been used to compare performance of the learning methods for both BRCA and MBCA (Fig. 4d).
3.3 BRCA and MBCA
3.3.1 Targeted gene panel discovery for MBCA based on pathway enrichment analysis (PEA)
In this section, a pathway-based biological analysis is carried out by ReactomeFIVIz tool (65–67). For EARN100, we find 63 (FDR<0.03) such pathways for BRCA and 42 (FDR<0.03) such pathways for MBCA. It is observed that 14 (FDR<0.03) enriched pathways are common among BRCA and MBCA (Fig. 5a), [see these specific and common pathways and the genes involved in each pathway in Additional file 10: Table S44]. These enriched pathways for BRCA are a subset of the other seven main pathways: Extracellular matrix organization, Signal Transduction, Gene expression (Transcription), Immune System, Hemostasis, Developmental Biology, and Metabolism of RNA. Also, the main pathways of MBCA include Gene expression (Transcription), Signal Transduction, Chromatin organization, Circadian Clock, Organelle biogenesis and maintenance, Neuronal System, and Metabolism. The common and specific main pathways (FDR<0.03) of BRCA and MBCA, and the frequency of genes involved in these main pathways are compared in Fig. 5b and Table 6. Given this, it can be found two (FDR<0.03) such common main pathways consist of Signal Transduction and Gene expression (Transcription) for BRCA and MBCA, and 5 (FDR<0.03) such specific main pathways for each of them.
Table 6 The common and specific main pathways for BRCA and MBCA
|
|
Number
|
Pathways
|
BRCA
|
MBCA
|
|
Number of genes
|
Name of genes
|
Number of genes
|
Name of genes
|
|
The specific main pathways for BRCA
|
1
|
Extracellular matrix organization
|
8
|
DCN, FN1, ICAM1, ITGA4, ITGAM, ITGAV, ITGB3, ITGB5
|
0
|
None
|
|
2
|
Immune System
|
15
|
FN1, GAB2, ICAM1, IL1RAPL1, IL1RN, IL2RB, ITGAM, ITGAV, ITGB5, JAK1, MSN, POU2F1, PTPN11, SMARCA4, SYK
|
0
|
None
|
|
3
|
Hemostasis
|
12
|
EGF, FN1, GRB7, ITGA4, ITGAM, ITGAV, ITGB3, PIK3CG, PRKCZ, PTPN11, SERPINA1, SYK
|
0
|
None
|
|
4
|
Developmental Biology
|
9
|
ACVR1B, GAB1, GAB2, GRB7, PTPN11, RELN, SMAD2, SMAD4, VLDLR
|
0
|
None
|
|
5
|
Metabolism of RNA
|
6
|
CPSF1, CPSF3, PCF11, PRPF40A, SF3A1, SF3B1
|
0
|
None
|
|
The specific main pathways for MBCA
|
6
|
Chromatin organization
|
0
|
None
|
7
|
TBL1XR1, NCOR1, HDAC3, GPS2, ACTB, KDM6B, PRMT1
|
|
7
|
Circadian Clock
|
0
|
None
|
2
|
NCOR1, HDAC3
|
|
8
|
Organelle biogenesis and maintenance
|
0
|
None
|
4
|
TBL1XR1, SIRT4, NCOR1, HDAC3
|
|
9
|
Neuronal System
|
0
|
None
|
7
|
ABAT, KPNA2, PRKCG, CACNA1E, PLCB1, GRIN1, KRAS
|
|
10
|
Metabolism
|
0
|
None
|
5
|
TBL1XR1, SIN3A, NCOR1, HDAC3, GPS2
|
|
The common main pathways for BRCA and MBCA
|
11
|
Signal Transduction
|
25
|
ACVR1B, EGF, ERBB3, FLT1, FN1, GAB1, GAB2, GRB7, ITGAV, ITGB3, JAK1, NOTCH4, NR4A1, PARD3, PPARG, PRKCZ, PTEN, PTPN11, RUNX1, SMAD2, SMAD4, SMURF1, SYK, TFDP1, TGFBR2
|
25
|
ACTB, AR, BDNF, BUB1B, CBFB, COL4A3, FOXA1, KDR, KPNA2, KRAS, NCOR1, NOS3, PDGFD, PIK3R1, PKN2, PLCB1, PRKCD, PRKCG, PRMT1, PTPRJ, RUNX1, STAG1, STAT1, WAS, YWHAE
|
|
12
|
Gene expression (Transcription)
|
19
|
ABL1, CBFB, CPSF1, CPSF3, MED23, NBN, NOTCH4, NR4A1, PCF11, POU2F1, PPARG, PTEN, PTPN11, RUNX1, SMAD2, SMAD4, SMARCA4, SMURF1, TFDP1
|
14
|
AR, BDNF, CBFB, GPS2, HDAC3, KLF4, KRAS, NCOR1, PRMT1, RUNX1, SIN3A, STAT1, TBL1XR1, YWHAE
|
Further investigation in Table 6 shows that 16 genes contribute to five enriched specific main pathways of MBCA. Among them, four genes are involved in more than one main pathway. In particular, NCOR1 and HDAC3 are engaged in four pathways. In three out of five pathways TBL1XR1 is active, and GPS2 gets involved in two pathways. Table 7 introduces 16 genes that are enriched in these five main pathways and provides more information about them.
Table 7 The plausible driver genes involved in the proposed main pathways related to MBCA
| |
|
|
|
|
Specific main pathways
|
|
PPDMB
|
KGCC
|
KGBC
|
IGMC
|
IGMB
|
Chromatin organization
|
Circadian Clock
|
Organelle biogenesis and maintenance
|
Neuronal System
|
Metabolism
|
|
NCOR1
|
1
|
1
|
#N/A
|
#N/A
|
✔
|
✔
|
✔
|
|
✔
|
|
HDAC3*
|
#N/A
|
#N/A
|
#N/A
|
#N/A
|
✔
|
✔
|
✔
|
|
✔
|
|
TBL1XR1
|
1
|
1
|
2
|
#N/A
|
✔
|
|
✔
|
|
✔
|
|
SIRT4
|
1
|
#N/A
|
#N/A
|
#N/A
|
|
|
✔
|
|
|
|
ABAT*
|
#N/A
|
#N/A
|
#N/A
|
#N/A
|
|
|
|
✔
|
|
|
KRAS
|
1
|
1
|
20
|
#N/A
|
|
|
|
✔
|
|
|
GRIN1*
|
#N/A
|
#N/A
|
#N/A
|
#N/A
|
|
|
|
✔
|
|
|
PLCB1*
|
#N/A
|
#N/A
|
#N/A
|
#N/A
|
|
|
|
✔
|
|
|
CACNA1E
|
1
|
#N/A
|
#N/A
|
#N/A
|
|
|
|
✔
|
|
|
PRKCG
|
1
|
#N/A
|
1
|
#N/A
|
|
|
|
✔
|
|
|
KPNA2*
|
#N/A
|
#N/A
|
#N/A
|
#N/A
|
|
|
|
✔
|
|
|
GPS2
|
1
|
1
|
#N/A
|
#N/A
|
✔
|
|
|
|
✔
|
|
SIN3A
|
1
|
#N/A
|
#N/A
|
#N/A
|
|
|
|
|
✔
|
|
ACTB
|
1
|
#N/A
|
1
|
#N/A
|
✔
|
|
|
|
|
|
KDM6B
|
#N/A
|
#N/A
|
1
|
#N/A
|
✔
|
|
|
|
|
|
PRMT1
|
#N/A
|
#N/A
|
2
|
#N/A
|
✔
|
|
|
|
|
* Five new genes that have not been already introduced in the public databases
PPDMB: Proposed plausible driver related to metastatic breast cancer
KGCC: Known genes related to cancers that are confirmed in OMIM, CGC, and NCG
KGBC: Known genes related to breast cancer that are confirmed in OMIM, CGC, and NCG
IGMC: Introduced genes related to different metastatic cancers in HCMDB
IGMB: Introduced genes related to metastatic breast cancer in HCMDB
This gene set can be considered as a targeted biomarker panel in the case of metastatic breast cancer to examine more in the next molecular and clinical analysis phase. More investigations on these genes can hopefully be helpful in MBCA prognosis and diagnosis. Table 7 shows that five genes, HDAC3, ABAT, GRIN1, PLCB1, and KPNA2 are new and not confirmed in the public databases for cancer prognosis. However, there is some evidence to suggest that these genes play a clinical role in cancer progression. HDAC3 contributes to four pathways alongside NCOR1. The other four genes engage in the Neuronal System pathway. The recent investigations on Basal-like breast cancer (BLBC), the most aggressive subtype of this cancer, have documented the expression of ABAT was considerably decreased in this cancer (69). Besides, alterations in the expression levels of ABAT have been reported in the promotion of breast cancer (70). ABAT was also identified as a biomarker for endocrine-responsiveness breast cancer patients (71). Furthermore, GRIN1 encodes GluN1 subunit of N-methyl-D-aspartate receptor (NMDAR). It has been shown that this subunit in more than 90% of all breast cancer subtypes is uniformly expressed to promote Breast-to-brain metastasis (B2BM) (72). Recently, the role of HDAC3 in the deregulation of P53 pathway in the aneuploid cancer cell lines has been analyzed (73). Also, HDAC3 is overexpressed in breast cancer patients. It has been illustrated that breast cancer stem cells, which are resistant to treatment and are responsible for metastasis, are the target of the histone deacetylase (HDAC) inhibitors (74). On the other, The results of enrichment in cBioPortal show that the above-mentioned 16 genes are altered in 243 (54%) of 450 MBCA samples in two studies performed in 2016 (51) and 2017 (52). Genomic alterations (Fig. 6) in these genes have been visualized using OncoPrint component (49, 50). Among them, the highest percentage of somatic mutation frequency (SMF) is observed in CACNA1E, NCOR1, KDM6B, and GPS2. Using the Needle Plot component (49, 50), we visualize SMF and can also map mutations on the linear protein and its domains for these four genes (Fig. 7).