Overall publication performance and growth rate
We first assessed the overall publication performance in NB research during the last 38 years. In total, 12,435 documents, including 11,970 (96.2%) articles and 465 (9.8%) reviews, were published by 36,908 authors from 86 countries. The total publications output was very low prior to 1990 (n=626, 5.0%) and began to increase extensively after 1991, reaching a peak in 2015 (n=572, 4.6%). Linear fitting of the data revealed an increase in the number of publications written between 1980 and 2018 (r2 = 0.92 [CI: 0.86 to 0.96]; p < 0.0001]). The average annual percentage growth rate indicating increasing annual scientific production was 11.8%. The highest annual growth rates were noted in 1986 (711%) and in 1990 (519.5%) while the lowest was recorded in 1998 (-91.1%). After 1991, the growth rates were stable, ranging from -20.3% to +31.5% (Figure 1, Table S1).
Citation rate and dynamics
Of 12,136 retrieved documents, a total of 316,017 received citations including self-citations and 289,357 were without self-citations. The average citation per item (CPI) was 28.35 ± 7.7. There was a consistent citation dynamic ranging from 29.5 CPI in 1980 to 30.8 CPI in 2010. After 2011, the CPI was 12.7, which was lower compared to the period 1980 – 2010, because most newly published articles had not been cited much at the time of data extraction for our study. While the number of single-authored documents remains stable over time (r2 = - 0.6, p = 0.24), the number of multi-authored documents increased significantly (r2 = 1.0, p = 0.003) (Figure 2, Table S2).
Most prolific authors
In the entire dataset of 36,908 authors, 25,873 authors (70.1%) published a single paper related to neuroblastoma and were considered “occasional” authors; 5,178 (14.0%) published two papers; 2,076 (5.6%) published three papers; 3,781 (10.2%) published four or more papers. Authors who published more than one paper were considered to be “core” authors. Of the top ten contributing authors, Berthold F (University of Cologne, Department of Pediatric Oncology and Hematology, University of Cologne, Koeln, Germany) was ranked first in the number of published articles (n=169), Matthay KK (Department of Pediatrics and Helen Diller Family Comprehensive Cancer Center, University of California, San Francisco, California, USA) had the highest h- and m-indices (63 and 2.2, respectively) while Seeger RC (Division of Hematology/Oncology, Children's Hospital Los Angeles, Los Angeles, USA) had the highest average citation per item count (100.2) (Table 1). Scientific productivity of the top authors on NB research over time is presented in Figure S1.
Core journals
In the time frame analyzed, there were 1,828 academic journals publishing papers related to neuroblastoma research. Journal of Neurochemistry had the highest publication output (n=319, 17.4%), followed by Cancer Research (n=295, 16.1%), Journal of Pediatric Surgery (n=278, 15.2%), and Pediatric Blood and Cancer (n=261, 14.3%). The most cited journals were Cancer Research (n=19,170), Journal of Clinical Oncology (n=16,426), Journal of Neurochemistry (n=10,221), Oncogene (n=9,223), and Journal of Biological Chemistry (n=9,197). Cancer Research (80) had the highest h index, following by Journal of Clinical Oncology (75), and Journal of Biological Chemistry (56). Table 2 summarized source impact of the top 20 journals publishing on NB.
Active countries
Eighty-six countries were involved in NB total research output. Among them, 9,999 (80.4%) of publications were contributed by the top twelve most productive countries, putting out more than 300 publications (Table 3). The United States of America (USA) published the most papers (n=4,328), had the highest h-index (141), and ranked first in terms of single country publications (n=2,284). Other high prolific countries were Japan (n=1,364), Italy (n=1336), and Germany (n=1128). The Netherlands had the highest rate of average article citations (n=39.12), followed by the USA (n=35.45), France (n=33.24), Sweden (n=33.16), and China (n=32.61).
International collaborations
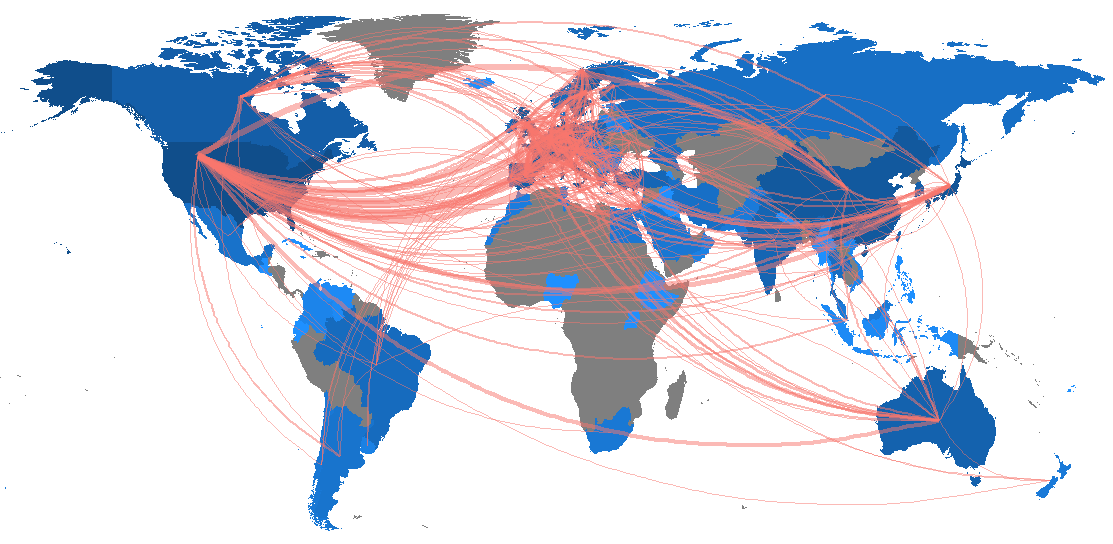
Researchers from the USA showed the highest collaboration performance with a total link strength (TLS) of 1,438, followed by Germany (TLS=852), the United Kingdom (TLS=829), Italy (TLS=801), and France (TLS=707). International collaboration analysis showed that 136 articles (30.0%) produced by Sweden had international authors, followed by authors from the UK (n=221, 24.3%), France (n=167, 22.3%), Germany (n=244, 21.6%), and the USA (n=918, 21.2%). The international collaboration network is presented in Figure S2. The number of links between any two countries represents the strength of collaboration, while the color intensity is proportional to the number of publications. The strongest collaboration was between the USA and Germany (frequency, n=160), the USA and Italy (n=156), the USA and the UK (n=137), and the UK and Italy (n=131).
Most cited NB papers and NB papers without a single citation
Of 12,435 publications related to NB, 12,136 (94.8%) were cited at least one time and 299 (2.4%) publications remain uncited after their publication. Table 4 demonstrates the top ten studies according to total number of citations. The review article entitled “Revisions of the international criteria for neuroblastoma diagnosis, staging, and response to treatment” published by Broder GM in Journal of Clinical Oncology in 1993 received the highest number of citations (n=1,450).
Keywords analysis
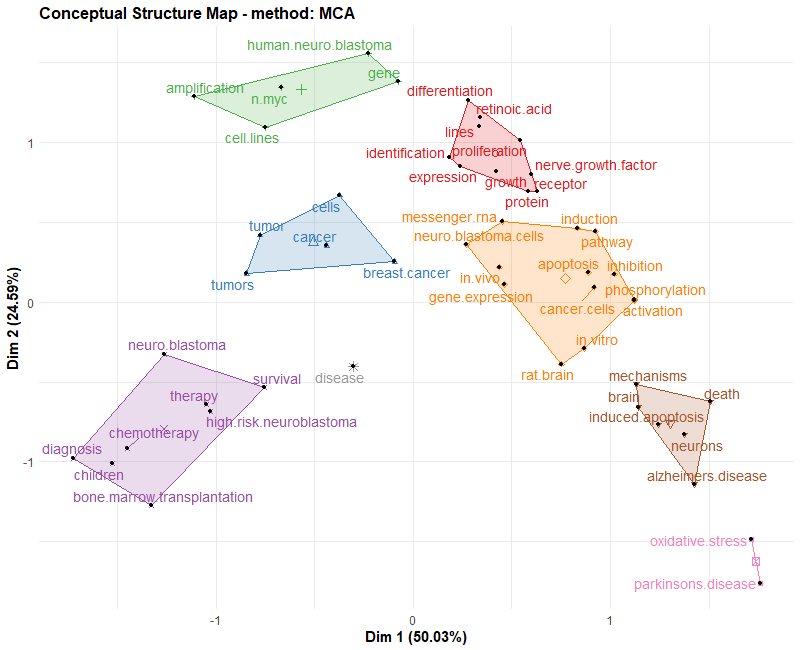
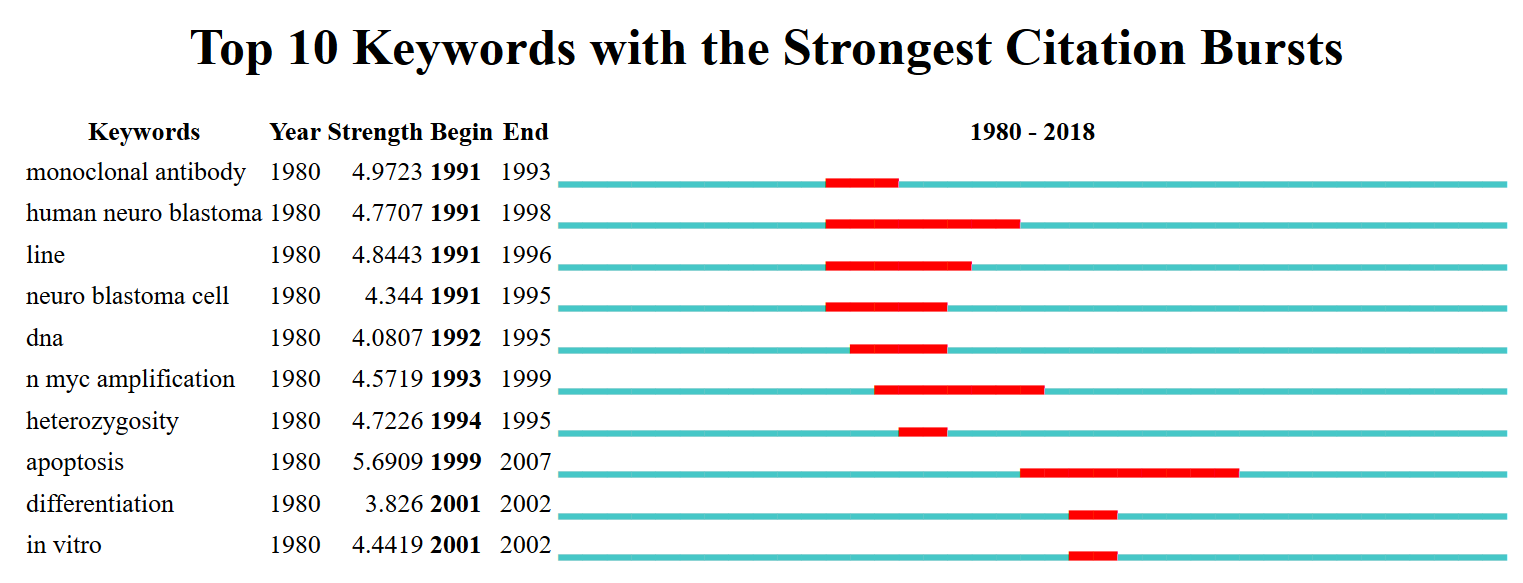
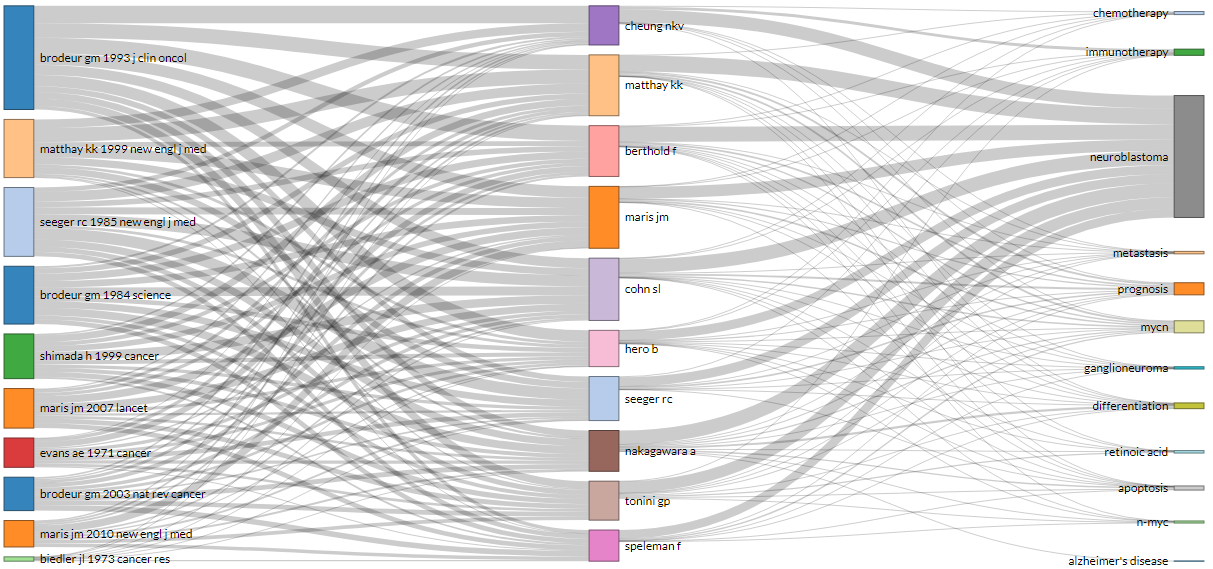
The most frequent author´s keywords were “neuroblastoma” (n=4,505), “apoptosis” (n=821), “differentiation” (n=371), “mycn” (n=262), “ganglioneuroma” (n=222), “oxidative stress” (n=218), “neuroblastoma cells” (n=214), “retinoic acid” (n=195), “chemotherapy” (n=153), “SH-SY5Y” (n=153). The overall keyword network visualization is presented in Figure 3. We identified keywords with a high-citation burst, which can be used to predict research areas attracting an extraordinary degree of attention (Figure S3). Next, we aimed to map the conceptual co-word structure using the word co-occurrences in our bibliographic metadata to identify clusters of documents which express common concepts. The results are plotted on a two-dimensional map (Figure S4). Overall, 7 clusters of words could be identified (each color represents a cluster of word). The three-fields plot shows the relationship between the author´s keywords (research contents = right field), references authors use (intelectual roots = left field), and the top authors (middle field) (Figure S5).