Synthesis and structural characterizations of gas diffusion electrode (GDE) of Cu. The GDE of Cu was prepared via sputtering Cu on the porous polytetrafluoroethylen (PTFE) frames. As shown in scanning electron microscopy (SEM) images, Cu film was uniformly coated on the PTFE (Fig. 1a and b). Fig. 1c shows the high-angle annular dark field scanning transmission electron microscopy (HAADF-STEM) image of Cu nanocrystal. The interplanar spacings of 0.205 and 0.181 nm were assigned to (111) and (200) facets of face-centered-cubic (fcc) Cu, respectively. The single-crystal structure of Cu nanocrystal was identified by the selected area electron diffraction (SAED) pattern (Fig. 1c, inset). Fig. 1d shows X-ray diffraction (XRD) patterns of PTFE and the GDE of Cu. Except for the characteristic peaks for PTFE, other peaks located at 43.3o, 50.4o, and 74.1o for the GDE of Cu were indexed to the (111), (200), and (220) facets of fcc Cu (JCPDS No. 04-0836), respectively. We further investigated the valence state of Cu in the GDE of Cu. As shown in Fig. 1e, a characteristic peak at 918.8 eV was observed in the Cu LMM Auger spectrum, demonstrating the metallic Cu species in the GDE of Cu. Fig. 1f shows the K-edge X-ray absorption near-edge spectroscopy (XANES) spectra of Cu foil, Cu2O, and GDE of Cu. The GDE of Cu exhibited a similar energy absorption edge profile with Cu foil in the range between 8970.0 and 9000.0 eV. Moreover, the first-order derivative peak of XANES profile for the GDE of Cu was located at 8979.0 eV, further revealing the metallic state of Cu in the GDE of Cu (Supplementary Fig. 1).
To improve structural stability for the GDE of Cu, we constructed a hydrophobic layer via spraying carbon black (Vulcan, XC-72) on Cu film39-41. After spraying a layer of carbon black onto Cu film, the GDE of Cu was regulated from hydrophilic to hydrophobic with the contact angles increased from 65.5o to 121.5o (Fig. 1g). As shown in Fig. 1h, the average thickness of Cu film and carbon black in the GDE of Cu were about 0.6 and 1.5 μm, respectively. The structure for the GDE of Cu was further proved by energy dispersive X-ray (EDX) elemental mapping with clear contrasts among carbon black, Cu film, and PTFE frames (Fig. 1i).
Catalytic performance for the GDE of Cu towards CO2 electroreduction. A flow-cell system with 1 M KOH as electrolyte was used to evaluate the catalytic performance for the GDE of Cu (Supplementary Fig. 2). During the process of chronopotentiometric electrolysis, the gaseous products including hydrogen (H2), CO, CH4, C2H4, and C3H6 were quantified via online gas chromatography (GC) (Supplementary Fig. 3). Meanwhile, the liquid products containing HCOO-, C2H5OH, and CH3COO- were quantitatively analyzed via 1H nuclear magnetic resonance (1H NMR) (Supplementary Figs. 4 and 5). As shown in Fig. 2a, a volcano-type behavior between faradaic efficiency (FE) for C2H4 (FEC2H4) and applied j was observed for the GDE of Cu. At applied j of 300 mA cm-2, the GDE of Cu achieved the highest FEC2H4 of 43%. The other C2+ products such as C2H5OH, CH3COOH, and C3H6 were also generated during CO2 electroreduction (Supplementary Fig. 6). Apart from the C2+ products, the GDE of Cu also exhibited a relatively steady FE for HCOO- (FEHCOO-) of about 15% and FE for CH4 (FECH4) of around 2% at all applied j (Supplementary Fig. 7). Fig. 2b shows the FE for CO (FECO). FECO decreased with the increase of applied j. When the applied j was higher than 360 mA cm-2, FECO was limited within 3%. As shown in Fig. 2c, the highest j for C2H4 (jC2H4) was 165 mA cm-2 at applied j of 480 mA cm-2. Nevertheless, j for CO (jCO) decreased with the increased tendency of jC2H4 (Fig. 2d). A reasonable explanation for this phenomenon is that *CO is the essential intermediate for the formation of C2H4.
The investigation of tandem mechanism for the GDE of Cu. To gain insight into the C-C coupling mechanism for the formation of C2H4, we monitored the FEC2H4 for the GDE of Cu at applied j of 300 mA cm-2 with various partial pressures of CO2 and CO as co-feeding gases. As shown in Fig. 3a, the GDE of Cu exhibited a volcano-type relationship between FEC2H4 and partial pressure of gaseous CO. When the partial pressure of CO reached 8%, the GDE of Cu displayed the highest FEC2H4 of 59%, which was 1.4 times as high as the GDE of Cu with pure CO2 as feeding gas (43%). We deduced that the enhanced FEC2H4 was attributed to the increased surface coverage of *CO which originated from the increased partial pressure of gaseous CO. Further increasing the partial pressure of CO to 16% leaded to the decrease of FEC2H4. To unravel the role of gaseous CO in the formation of C2H4, we adopted isotopic labeling experiments using 13CO2 and CO as co-feeding gas (13CO2:CO=92:8). At applied j of 300 mA cm-2, C2H4-correlated fragments were quantitatively analyzed by gas chromatography-mass spectrometer (GC-MS) measurements over the GDE of Cu. The calibrations and ratios of C2H4-correlated fragments were shown in Supplementary Fig. 8 and Supplementary Table 1. To exclude the influence of CO-correlated fragments (13CO with m/z of 29 and CO with m/z of 28), we chose the mass spectrometry signals with m/z of 30, 27, and 26 to quantitatively analyze the ratios for 13C2H4, 13CH2CH2, and C2H4. According to the quantitative equations and the peak areas of fragments with m/z of 30, 27, and 26, the ratios for 13C2H4, 13CH2CH2, and C2H4 were calculated to be 57.1%, 42.5%, and 0.4%, respectively (Fig. 3b). The abundant product of 13CH2CH2 proved that the cross-coupling process proceeded between CO2 and CO.
To investigate the interferences of the local pH of electrolyte around the surface of catalysts and partial pressure of gaseous CO2, we conducted CO2 electroreduction over the GDE of Cu using CO2 and Ar as co-feeding gases at applied j of 300 mA cm-2. As shown in Fig. 3c, a relatively steady FEC2H4 of 40% was acquired for the GDE of Cu as the partial pressure of CO2 ranged from 100% to 84%. This result indicated that the enhanced FEC2H4 in the co-feeding gases of CO2 and CO was not ascribed to the increased local pH. In addition, the FEC2H4 gradually decreased as the partial pressure of CO2 decreased from 70% to 10% using CO2 and Ar as co-feeding gases (Supplementary Fig. 9). The decreased FEC2H4 could be attributed to the low partial pressure of gaseous CO2 which hindered the kinetic process for the formation of *CO and thus the coupling process of *CO into *OCCO. To verify whether the enhanced FEC2H4 was originated from the coupling process of CO, we conducted CO electroreduction in various co-feeding gases of Ar and CO at applied j of 300 mA cm-2. When partial pressure of CO ranged from 0% to 16%, FEC2H4 gradually increased from 0% to 4% (Fig. 3d). Nevertheless, when the partial pressure of CO was further increased from 30% to 90%, all of the FEC2H4 for the GDE of Cu remained around 4% (Supplementary Fig. 10). Especially, when pure CO served as feeding gas, FEC2H4 was still less than 5% as applied j was higher than 300 mA cm-2 (Supplementary Fig. 11). The poor catalytic activity for CO electroreduction into C2H4 could be ascribed to the overloaded coverage of *CO on Cu surface. The overloaded coverage of *CO restricts the coverage of *H, depressing the hydrogenation kinetics of *OCCO to *OCCOH36,42. As a consequence, we concluded that a moderate coverage of *CO was beneficial for the formation of C2H4.
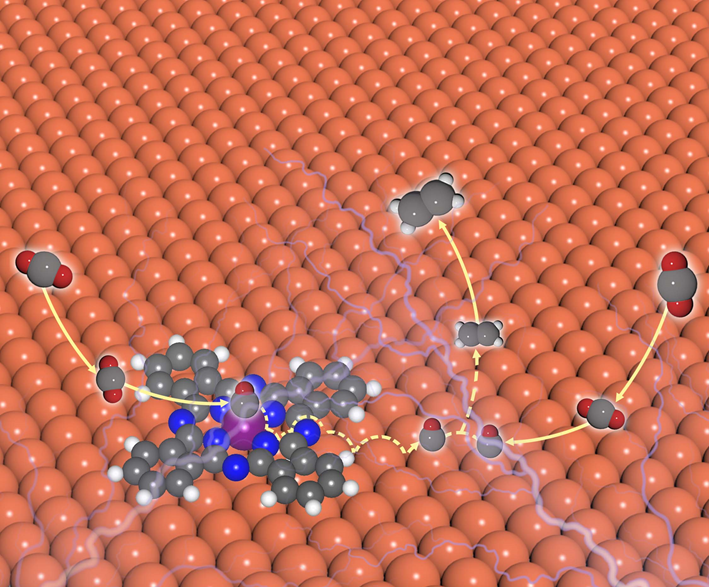
To validate the tandem process between CO2 and CO, we constructed a type of tandem catalyst via coupling CoPc with the GDE of Cu (denoted as Cu-CoPc). In these tandem catalysts, the electronic structure of Cu maintained original state due to the van der Waals contact between CoPc and Cu, in which CoPc served as highly efficient catalyst for the formation of CO.43 Notably, CoPc exhibited remarkable catalytic performance in flow-cell system with FECO higher than 90% in a wide region of applied j from 60 to 360 mA cm-2 (Supplementary Fig. 12). To explore the matched degree between CoPc and Cu, we prepared a series of tandem catalysts by spraying different amount of CoPc onto Cu film. The compositions of Cu-CoPc were investigated by Raman spectra. As shown in the Supplementary Fig. 13, all of the Cu-CoPc catalysts exhibited the obvious peaks at 681.9, 1337.2, and 1537.9 cm-1, which were attributed to the characteristic peaks for CoPc. In addition, the intensity of the characteristic peaks for the four Cu-CoPc catalysts gradually increased associated with the increased contents of CoPc. Determined by the inductively coupled plasma atomic emission spectroscopy (ICP-AES), the molar ratios of CoPc to Cu were 3.1%, 6.2%, 10.4%, and 16.6%, denoting these samples as Cu-CoPc-1, Cu-CoPc-2, Cu-CoPc-3, and Cu-CoPc-4, respectively (Supplementary Table 2). Supplementary Fig. 14 shows the EDX elemental mapping of the four Cu-CoPc catalysts, where Co and N uniformly distributed on the GDE of Cu.
To evaluate the catalytic performance of these tandem catalysts, we conducted chronopotentiometric electrolysis. As shown in Fig. 4a and Supplementary Fig. 15, Cu-CoPc-2 achieved the highest FEC2+ of 82% at applied j of 480 mA cm-2, which was 1.4, 1.2, and 2.0 times as high as Cu-CoPc-1 (57%), Cu-CoPc-3 (70%), and Cu-CoPc-4 (41%) under the similar applied potentials, respectively. Fig. 4b shows the FEC2H4 for the four Cu-CoPc catalysts. As the applied j ranging from 240 to 480 mA cm-2, Cu-CoPc-2 always exhibited the highest FEC2H4 among all of the Cu-CoPc catalysts. When applied j was set at 420 mA cm-2, the FEC2H4 of Cu-CoPc-2 was up to 67%, which was 1.3, 1.1, and 1.6 times as high as those of Cu-CoPc-1 (50%), Cu-CoPc-3 (60%), and Cu-CoPc-4 (42%), respectively. Fig. 4c shows the jC2H4 for the four Cu-CoPc catalysts. Cu-CoPc-2 also exhibited the highest jC2H4 with respect to the other counterparts at the applied j ranging from 240 to 480 mA cm-2. Especially, at the applied j of 480 mA cm-2, the jC2H4 of Cu-CoPc-2 reached 313 mA cm-2, whereas the jC2H4 of Cu-CoPc-1, Cu-CoPc-3, and Cu-CoPc-4 were 220, 282, and 184 mA cm-2, respectively. Notably, the catalytic performance of Cu-CoPc-2 was comparable to those of the state-of-the-art tandem catalysts up to date (Supplementary Table 3). The durability test for Cu-CoPc-2 was conducted at applied j of 480 mA cm-2 for 20 h. Cu-CoPc-2 exhibited around 16% decay for FEC2H4 and 5% ascent for cathodic potential (Fig. 4d). The degradation of the catalytic performance was mainly attributed to the destruction of the carbon black layers and the transformation of hydrophobic surface into hydrophilic surface (Supplementary Fig. 16).
To explore the effect of CoPc on the intrinsic activity for the formation of C2H4, we evaluate the ECSAs via Pb under potential deposition (UPD) measurements. As shown in Supplementary Fig. 17 and Supplementary Table 4, the four Cu-CoPc catalysts exhibited similar electrochemical surface areas (ECSAs) with the GDE of Cu. Nevertheless, all of the tandem catalysts exhibited higher FEC2H4 and jC2H4 than the GDE of Cu (35% for FEC2H4, 165 mA cm-2 for jC2H4) at applied j of 480 mA cm-2. As such, the enhancement of FEC2H4 was attributed to the tandem process between CoPc and Cu. As shown in Supplementary Fig. 18, the FECO for all of Cu-CoPc was higher than that for the GDE of Cu at the same applied j. Meanwhile, the FECO increased with the increased molar ratios of CoPc to Cu, indicating that CoPc served as CO-generating component. The FEHCOO- decreased with the increased molar ratios of CoPc to Cu, further revealing that the introduction of CoPc into Cu weakened the competing 2e process on Cu (Supplementary Fig. 19). Hence, the introduction of CoPc modulated the local coverage of *CO on the surface of Cu, regulating the catalytic activity for C2+ products towards CO2 electroreduction.
To gain deeper insight into the tandem mechanism between Cu and CoPc, we carried out in-situ Raman spectroscopy measurements. Fig. 5, a and b show the in-situ Raman spectra towards CO2 electroreduction over the GDE of Cu and Cu-CoPc-2. The peaks at 2037 and 2085 cm-1 were observed for both the GDE of Cu and Cu-CoPc-2, which were assigned to the intramolecular stretching of the sparse and local-enrichment *CO, respectively.[29,44] As shown in Supplementary Fig. 20, no obvious peaks associated with the intramolecular stretching of *CO was observed for CoPc, indicating that CoPc served as CO-generating component with weak *CO adsorption. As such, the peaks at 2037 and 2085 cm-1 for both the GDE of Cu and Cu-CoPc-2 were attributed to the intramolecular stretching of *CO on Cu sites. At each applied potential, Cu-CoPc-2 always exhibited a higher peak intensity for the intramolecular stretching of *CO in comparison with the GDE of Cu, indicating that the introduction of CoPc increased the coverage of *CO on the surface of Cu. Moreover, the peak-area ratios for the local-enrichment *CO to the sparse *CO increased from 0.66 to 2.01 when the applied potential increased from -0.4 to -0.8 V vs RHE, further revealing that the surface coverage of *CO around Cu increased at high overpotential over Cu-CoPc-2. Hence, the increased surface coverage of *CO around Cu facilitated C-C coupling, improving the catalytic activity for C2+ products at high overpotential over Cu-CoPc-2. These results were in good agreement with the tendency of catalytic performance. Accordingly, the tandem process between CoPc and Cu was responsible for the enhanced activity for C2+ products.