2.1. Cell culture, IR and drug treatment
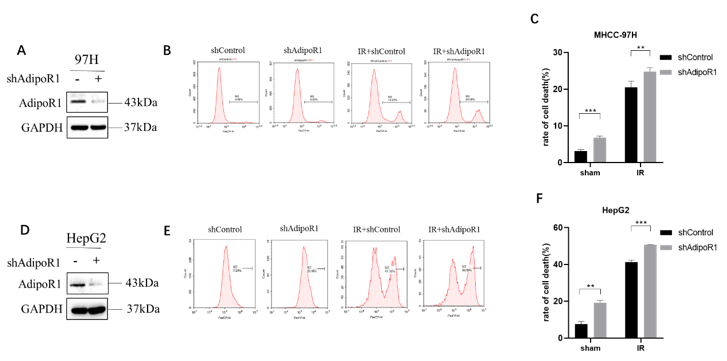
Human hepatocellular carcinoma cell lines MHCC-97H, HepG2 and normal hepatic cells LO2 were purchased from the Cell Bank of the Chinese Academy of Sciences (Shanghai, China) and confirmed by STR. The cell was cultured in Dulbecco’s modified Eagle’s medium mixture medium (Invitrogen Inc.) supplemented with 10% fetal bovine serum (Invitrogen Inc.), and 1% penicillin/streptomycin (cat. no. 10378016, Life Technologies) in a humidified 5% CO2, 37°C incubator. Cells were exposed to ionizing radiation (10Gy) using an X-ray generator (X-RAD 320 ix, Precision X-ray Inc., North Branford, CT, USA) at a dose rate of 3 Gy/min. The distance between the source and the target was 50 cm. cells were pretreated with 20µm Erastin (Selleck Chemicals, USA) for 24hs to induce ferroptosis.
2.2. Cell viability and cell death assays
Cell viability was determined by Cell Counting Kit-8 (CCK-8, Dojindo Laboratories, Japan) according to the manufacturer’s protocol. Cells were seeded in 96-well plates (2× 10³ cells/well) and pretreated with Erastin (20µm). CCK-8 was added to each well, and the cells were incubated for 3h. OD values were recorded at 450 nm using a microplate reader. The proliferation rate of cells was calculated by the following formula: cell viability = (OD experimental group-OD blank/OD control group-OD blank) × 100%. Trypan blue (prod. no. T8154) staining was used for observation of cell death by flow cytometry. Cells were seeded in 6-well plates (8× 10⁴ cells/well) and irradiated with 10Gy. The cell supernatant and cell in the culture dish were collected and centrifuged at 500xg for 5 minutes at 4℃. The cell pellet was washed with PBS, stained with trypan blue for 3 minutes, and detected cell death by flow cytometry.
2.3. Colony formation assay and Lipid peroxidation detection
Cells were placed in 6-well plates and cultured in DMEM (Invitrogen) containing 10% FBS (Gibco) at 37°C and 5% CO2 for 14 days. To visualize and count the colonies, the colonies were fixed with 4% paraformaldehyde for 30 min and stained with 0.2% crystal violet (Solarbio, Beijing, China) at room temperature for 15 min. The colonies containing ≥50 cells per dish were counted. Lipid peroxidation detection: Cells (2 × 10⁵) in 6-well plates were incubated with 1 ml of fresh medium containing 5 µM of BODIPY 581/591C11 (Invitrogen) at 37°C in the dark for 30min. Cells were then trypsinized, washed, and resuspended in 0.2 ml of PBS for flow cytometry analysis. A minimum of 20,000 cells were analyzed per condition.
2.4. Lentiviral infections, Expression vectors and siRNAs
Lentiviral short hairpin RNA (shRNA) vector targeting AdipoR1 (pLKO.1-shAdipoR1) was constructed according to the protocol of pLKO.1-blasticidin vector (Addgene, Cambridge, MA, USA). Briefly,the forward oligo: CCGGCGTCTATTGTCATTCAGA
GAACTCGAGTTCTCTGAATGACAATAGACGTTTTTG and reverse oligo: AATTC
AAAAACGTCTATTGTCATTCAGAGAACTCGAGTTCTCTGAATGACAATAGACG were annealed and inserted into the pLKO.1-blasticidin vector. Control vector pLKO.1-shScramble was also purchased from addgene. Lentiviruses were produced in 293T cells after co-transfection of pLKO.1-shAdipoR1 or pLKO.1-shScramble, packing plasmid psPAX2 and envelope plasmid pMD2G. The supernatant containing viruses was collected 48h after transfection, filtered, and used for infecting target cells in the presence of 10µg/ml of polybrene (Sigma-Aldrich, H9268) prior to drug selection with 7µg/ml of blasticidin for one week. The xCT and Nrf2 cDNA was PCR amplified and cloned into pcDNA3.1Flag at BamHI and XhoI sites, respectively. siRNA, targeting human xCT, and the corresponding control, siRNANC were purchased from GenePharma (Shanghai, China).
2.5. Transfections and Luciferase reporter assays
Transfections were carried out using Lipofectamine 2000 (Invitrogen) according to a protocol provided by the manufacturer. Double luciferase–reporter gene determination was conducted to determine whether xCT was the direct target gene of Nrf2. Reporter plasmids of xCT promoter double luciferase was synthesized from Generalbiol (Anhui, China) and inserted into the pGL3-Basic vector. pGL3-Basic xCT promoter and pGL3-Basic vector were cotransfected into cells with PCDNA3.1-Flag Nrf2, respectively, with Lipofectamine 2000. After transfection for 48 hours, luciferase activity was determined on a Centro LB 960 Luminometer (Berthold Technologies, Germany) and the activity of renilla luciferase was used as a standardized control.
2.6. qRT-PCR
Total RNA was extracted from HCC cells with Trizol solution (TaKaRa, Dalian, China). PrimeScriptTM RTMaster Mix (TaKaRa, Dalian, China) was used for reverse transcription. qRT-PCR was carried out on a QuantStudio Real-Time PCR instrument (Thermo Fisher Scientific, USA) using SYBR Premix Ex Taq II (TaKaRa). The conditions of thermal cycling were illustrated as follows: 95°C for 30 s followed by 40 cycles at 95°C for 5 s and at 60°C for 30 s. PCR was performed using the following primers; SLC7A11/xCT forward: CCATGGGTGGAATCATATTGGA, reverse: TCAA
CGGATTTGGTCGTATTGG; AdipoR1 forward: CTCATCTACCTCTCCATCGT, rev
erse: GAACACTCCTGCTCTTGTCT; PTGS2 forward: TAGGATTCAGGGCTTTCA
CTGGCT, reverse: TGTCAGCCGACAATGAGATGTGGA; GAPDH forward: GCGT
GGGCATGTCTCTGAC, reverse: GCTGGTAATGGACCAAAGACTTC.The 2−ΔΔCt
Method was utilized to calculate the relative expression levels.
2.7. Western blot analysis
Cells were washed with PBS, collected with a cell scraper, and lysed with RIPA buffer. Total proteins (20µg) were separated on a 12% SDS-PAGE and transferred onto a PVDF membranes (Millipore). After blocking with 6% skim milk in Tris-buffered saline-tween (TBST) for 1 h at room temperature, the membranes were incubated overnight at 4°C with primary antibodies, and then after washing incubated with each secondary antibody for 1h at room temperature. The following antibodies were used: AdipoR1 (ab126611), Transferrin (ab8241), GPX4 (125066), (Abcam, Cambridge, MA, USA); xCT (#12691S), CD71 (#13113S), Nrf2 (#12721S), (Cell Signaling Technology, Danvers, MA USA); GAPDH (Proteintech, Rosemont, IL); Actin (A3853, Sigma); AdipoR1 (SC-518030, SANTA). The immunoreactions were visualized by ECL solution (Thermo Fisher Scientific, USA) analyzed using the Image J software (Bio-Rad).
2.8. Statistical analysis
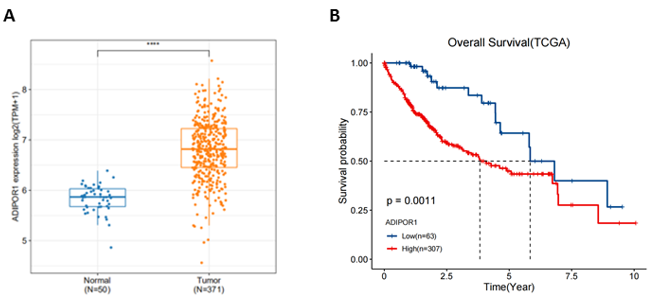
SPSS 22.0 software (SPSS, Chicago, IL, USA) was utilized for statistical analyses in this study. Differences between two groups were evaluated with Student’s t-test (two-tailed). One-way ANOVA followed by Bonferroni post hoc tests were performed to analyze multiple groups. Survival curve was generated with Kaplan–Meier method. Experimental results are presented as mean ± SD. Data was considered as statistically significant when p-value was less than 0.05.