Two different electrodes with different surface to bulk ratios were fabricated and compared, namely a 20 nm thin-film and 2.5 nm nanoparticles (NPs) on a graphene current collector electrodes. Fig. 1A shows a top view scanning electron microscopy (SEM) image of the sputtered thin-film electrode. The thin-film consists of interconnected polycrystalline islands with a thickness of 20 nm. In contrast, Fig. 1B shows the TEM image of isolated 2.5 nm IrOx NPs supported on conductive bi-layer graphene. Owing to the structural differences, the thin-film can be considered a bulk model whereas the high surface to bulk ratio of the NPs makes them a surface model. Anodic oxidation of metallic iridium is reported to result in better performing catalysts than thermal activation, due to the existence of highly hydrated species forming an oxyhydroxide upon electro-oxidation13. Hence, the sputtered electrodes were oxidized/activated prior their use in OER by several potential scans between open circuit voltage (OCV) and 1.2 V at 20 mV/s scanning rate in a 50 mM H2SO4 electrolyte (potentials are not iR corrected). As expected, this procedure resulted in the development of an increasingly larger anodic peak in the cyclic voltammogram (CV), where the peak height increased with the number of cycles14. The condition of maximum peak height corresponds to the highest electrode activity for thin-films and NPs15. The TEM (Fig. 1B) images of the sputtered iridium particles on the free-standing bi-layer graphene show that they are homogeneously distributed after activation; the estimated coverage factor is around 20% of the surface and the average particle size is ~2.5 nm. Contact of the IrOx NPs onto graphene is assured by a chemical bond between the surface Ir atoms and the oxygen species present at the edges and vacancies of graphene16. According to the SEM image in Fig. 1A, we estimate a surface area of about 1.5-2.0 monolayer (ML) for the thin-film and about 1/3 ML for the nanoparticles. The fast Fourier transform (FFT) proves the existence of reduced metallic iridium NPs. Such beam induced reduction is common in non-stoichiometric oxides. One additional ring can be ascribed to stoichiometric IrO2.
The electrochemical performance of the Ir thin-film and Ir NP electrodes are compared in Fig. 1C and 1D. The CVs were acquired at room temperature (25°C), in de-aerated 0.1 M H2SO4 with N2 continually bubbled in the electrolyte at a scan rate of 20 mV/s using Pt and Ag/AgCl (saturated in KCl) as counter and reference electrodes, respectively. The CVs show two broad oxidation waves, labeled I and II, and two broad reduction waves, labeled IV and V, due to formally IrIII/IrIV and IrIV/IrV redox couples, respectively11,17,18. An additional current (point III in Fig. 1C and 1D) is ascribed to the oxidation of water. The CVs in Fig. 1C and 1D indicate that both the thin-film and bi-layer graphene coated with Ir NPs behave similarly. Therefore, it is expected that similar active species are involved during the electrocatalytic oxidation of water to dioxygen on both the thin-film and iridium NP electrodes. It is generally accepted that these active sites are hydrated Ir-oxyhydroxides formed in situ during OER19,20, where the Ir oxohydroxide-based OER is stable for high-current water electrolysis under acidic conditions21.
Probing the bulk species formed during the water oxidation
In order to determine the nature of the active species, the electronic structure modification that the electrodes undergo during the electrocatalytic oxidation of water was investigated by means of operando XAS. The electrocatalysts were characterized first using XAS in total fluorescence yield (TFY) mode at the Ir L3-edge using a homemade in situ electrochemical cell22, more details can be found in the supplementary information (SI). Using a 100 nm thick SiNx membrane, which is transparent to the incoming and out-going photons, it is possible to investigate the variations in the electronic structure using photon-in/photon-out (PIPO) techniques in the hard X-ray regime. An advantage of this approach is that it enables the study of electrochemical reactions with aqueous electrolytes (i.e. 100 mM H2SO4). Fig. 2A and 2B show the detection scheme with the thin-film and free standing bi-layer graphene decorated with Ir NPs. For both materials it is possible to perform measurements in TFY-XAS by collecting the photons emitted during the fluorescence decay follow the absorption process; this signal comes from the surface and bulk of the materials. Therefore, TFY-XAS provide information associated with the whole electrode (bulk and surface) in the case of the Ir thin-film. However, in the case of the NPs, due to the average film thickness of ~6 monolayers (MLs), the surface signal is enhanced, despite the methodology not being a surface sensitive technique. Moreover, the free standing graphene allows the collection of photoelectrons (by a semispherical electron analyser) from the side exposed to the electrolyte, thereby enabling the acquisition of photoelectron spectra (PES)23,24. Meanwhile, the thin-film electrode (20 nm) only yields photoelectrons from the side where the electrode is exposed to the incident X-ray photons, as shown in Fig. 2A, making it impossible to investigate the electrified solid-liquid interface of such a thick working electrode using soft PES. Note that PES is a surface sensitive technique due to the short inelastic mean free path (IMFP) of photoelectrons in solids or liquids25,26, making it an excellent complement to TFY-XAS.
Fig. 2C shows the Ir L3-edge spectra collected under operando conditions. The Ir L3-edge probes the dipole allowed transitions from a core Ir 2p3/2 electron to the partially occupied Ir 5d and Ir 6sp orbitals, which are hybridized with the O 2p orbitals27. Transitions to the 5d orbitals are lower in energy and well separated from transitions to the 6sp. These 2p to 5d transitions give rise to the so-called white-line. While the large lifetime broadening (about 5 eV, see SI) does not allow the discrimination of fine structure in the white-line due to, for instance, transitions into t2g-like and eg-like 5d orbitals, analysis of the white-line intensity can still give insight into the electronic structure of iridium. In particular, a sum-rule relates the total number of 5d holes to the integral area of the white-line11,27; that is, the white-line is linearly proportional to the iridium oxidation state28. Note that while the sum-rule is a property of the dipole operator and rigorously holds29,30for L3 + L2 , previous work shows no change in the L3:L2 branching ratio for oxidized iridium compounds, making L3 alone sufficient for a white-line analysis28. The ability of the bulk sensitive TFY-XAS measurements to reveal changes in average Ir oxidation states is apparent from Fig. 2C. Using the maximum intensity of the Ir L3 edge as a measure of average Ir oxidation state an increase in the number of Ir 5d holes can be seen in both the thin-film and NP samples under anodic polarization. This increase in average oxidation state is reversed under open circuit voltage (OCV). Similar trends were reported previously by in situ characterization of iridate working electrodes31-34. Before turning to a quantitative evaluation of this behavior, however, the details of the proportionality between white-line intensity and Ir oxidation state must be found. To establish a connection between the white-line intensity and the number of 5d holes on Ir we analyzed a series of reference samples, including: Ir0, IrCl3, IrO2, and IrOx (reference samples details can be found in the SI)34. An iridium foil was used for Ir0. IrCl3 powder was used as an IrIII reference, and IrO2 rutile-type powder was taken as a IrIV reference. In addition, an amorphous IrOx catalyst rich in active species17 was used to compare with the catalysts used in this work. Note that the Ir0 (foil) white-line can be artificially enhanced due to the existence of a native oxide layer and the fact that this spectrum is collected in TFY mode, self-absorption effects are also possible. However, the oxide layer is not a problem since it is thin compare to the bulk with minor contribution to the white-line intensity.
Fig. 3A1 shows the Ir L3 spectra of the reference samples including the background subtraction and remaining signal, which relates the number of Ir 5d holes to the integral area of the white-line28. These measurements clearly show an increase in the Ir L3-edge white-line intensity for the different samples following the trend: Ir0<IrCl3<IrO2<IrOx. Moreover, in Fig. 3A2 the maximum intensity of the white-line is linearly correlated with the integral intensity and, therefore, Ir oxidation state. Thus, for simplicity we employ the maximum white-line intensity as a measure of the Ir oxidation state. Similarly, the Ir L3-edges computed using the Bethe-Salpeter equation show the same trend continues through the bulk oxides Ir2O5 and IrO3 (Fig. 3B), see SI for more details (Fig. S3). From the white-line integration of the experimental data, Fig. 3A2 shows the percent increase in the Ir 5d density of electron-holes referred to IrCl3 and the equivalent oxidation state. Therefore, an oxidation state of +4 correspond to an increase of ~22% of the white-line intensity with respect to +3 (IrCl3 sample), and a change of ~32% for the case of IrOx corresponding to a +4.7 average oxidation state. This increase is supported by its comparison with Ir0, where an increase of a 52% of the white-line intensity is found for +4 and 65% for IrOx, corresponding to a +4.6 average oxidation state. Performing a similar quantification using the simulated data shows the maximum white-line intensity changes linearly with the Löwdin charge on Ir in the bulk phases as well as across various surface Ir species bound to O, OH, OOH, and OO on IrO2 surfaces spanning formal oxidation states from <IV to >VII (see SI for details, Fig. S4 and S5), suggesting no significant changes in intensity variation should be expected at higher oxidation states for the iridium oxyhydroxides. One can also consider that the change in the oxidation can often be correlated to the shift in the peak position, using this approach an average experimental oxidation state of +4.3 is found for IrOx, similar to the integration of the white-line Fig. 3A2. Both approaches yield an average oxidation state for IrOx under vacuum >IV suggesting the presence of IrV, in agreement with the IrV reported to appear in IrOx during reaction conditions using a similar analysis, but significantly less than the IrVI reported11 to appear in Ni-leached IrNiOx. To see if evidence for such high oxidation state Ir emerge for Ir NPs and thin-films under reaction conditions we return to in situ measurements.
Fig. 4 shows how the measured white-line intensities change with applied bias. The spectra were collected under chronoamperometric (CA) control, and ~1 hour was required to recorded each Ir L3-edge spectrum. This fact, together with the constant current observed under the applied potential, verifies that the spectra where collected under steady state conditions, which is important to assure their fidelity. The white-line intensity, and hence Ir oxidation state, can be seen to remain constant up to 0.7 V, above which the materials are oxidized. From the Ir Pourbaix diagram, Ir0 is expected below 0.73 V,35 making it tempting to assign the starting state of the film and NPs to Ir0. However, the surfaces likely remain partially oxidized after the CV activation steps36 making an assignment to IrIII more appropriate, as consequence of surface irreversible oxidation state, as confirmed by XPS below. At 1.0 V IrIV has become the stable phase on the Pourbaix diagram, which is further supported by the CVs of the film and NPs showing 1.0 V is above the IrIII/IrIV redox couple, but below the transition assigned to IrIV/IrV. At 1.0 V the near-surface region is then expected to be IrIV. The higher white-line intensities confirm oxidation, with the ~30% increase for the Ir NPs in line with an increase to +4.5, assuming IrIII to start. The higher white-line intensity of the NPs compared to the thin-films is likely due to incomplete oxidation of the bulk of the 20 nm thin-films18, 37, 38. At 1.6 V, though no further increase in white-line intensity is observed for the thin-films, whereas the NPs show an additional ~4% increase above that observed at 1.0 V suggesting the co-existence of IrIV/IrV, or higher oxidation states, on the catalyst surface. To gain a better understanding of what these species may be, we turned to ab initio calculations.
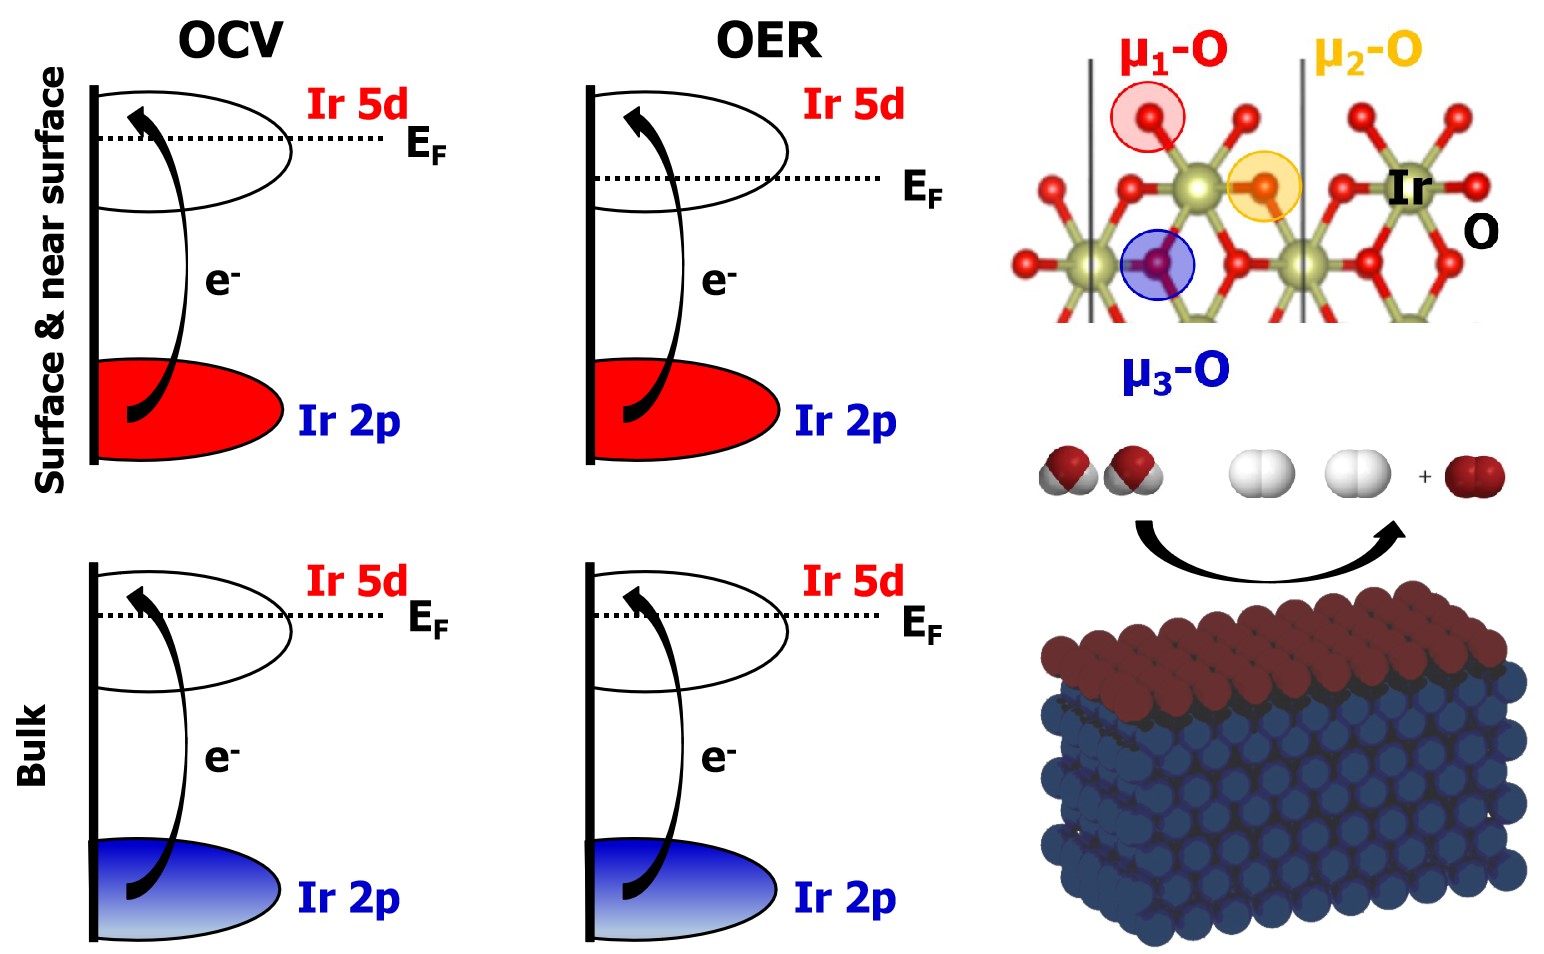
In order to provide a better description of the observed changes in the white-line spectra, these reference and operando measurements were compared with the DFT calculated Ir L3-edge spectrum (details can be found in the SI). We begin with the lowest energy, in vacuum, IrO2 surface, (110), as a model for the DFT calculations39. The surface was first fully hydrogenated as shown in Fig. 5. It was then successively oxidized by following a series of proton coupled electron transfers to explore the adsorbates argued to be present under OER conditions39, see Fig. 5. The Ir L3-edge white-line intensities of these surfaces were computed and plotted against the number of electrons transferred from the hydrogenated surface unit cell to reach the desired surface oxidation state. From Fig. 5 it can be seen that only the surface Ir atoms respond to the oxidation, with the first subsurface layer already converged to the L3-edge white-line intensity of bulk IrIV. The average surface oxidation state can be seen to increase from a white-line intensity below IrIV when µ1-H2O and µ2-OH are present—where the subindex indicates the number of iridium atoms bound to an oxygen atom—to a value consistent with bulk IrV when µ1-O and µ2-O are present. The former is close to the +3.5 average formal oxidation state for the surface Ir atoms found by simple bound counting.
Removing H+ and e- from µ1-H2O on the (110) surface yields a surface with µ1-OH and µ2-OH that is predicted to be stable up to 0.7 V.39 The average formal surface oxidation state of Ir on this surface is +IV, in-line with the computed L3-edge white-line intensity, Fig. 5. At 0.7 V the surface termination is predicted to transform into µ1-OH and µ2-O, with an average Ir surface oxidation state of +4.5, in general agreement with the experimental results on the NPs. Above 1.2 V both a surface µ1-O or µ1-OO have been predicted to be stable17,39. Of these, the µ1-O appears more likely on the NP surface owing to the small increase in white-line intensity observed experimentally between 1.0 V to 1.6 V, which is consistent with the increase in iridium formal oxidation state and the computed white-line intensity for transitioning from µ1-OH to µ1-O. The µ1-OO (and µ1-OOH) both show reduced white-line intensities relative to µ1-OH and µ1-O, and while we observed no evidence for such a reduction in intensity, it has been previously observed on IrOx NPs at high applied potential40.
We also considered the possibility that the NPs facet during anodic polarization, as above 1.1 V the (111) surface is thermodynamically favored39. Following the same methodology as above, Fig. 5 shows the Ir L3-edge white-line intensities as a function of the number of electrons transferred starting from a fully hydroxylated (111) surface, see SI for structures (Fig. S4). Here, though more points are included owing to the presence of four µ2-OH species in the unit cell, a similar trend emerges as found for the (110) surface, with the Ir L3-edge white-line intensities reaching higher values due to the increased formal surface iridium oxidation states on the (111) vs. (110) surface. In particular, the Ir bound to µ1-O reaches a formal oxidation state exceeding IrVI. Such a species is predicted to appear once the bias reaches 1.1 V; above 1.2 V µ1-O may transform into a µ1-OO.39 While we see no drop in white-line intensity on the NPs supporting the formation of µ1-OO, we cannot completely rule out the appearance of IrVI from XAS alone. Thus, we turned to XPS.