Plant materials
A total of 23 radish genotypes were used for microspore culture (Table 1). All plants were cultivated in the greenhouse. Regular watering, fertilization, insect pest and disease management were conducted.
Isolation of microspore
The microspore isolation was basicly followed the procedure of Bhatia et al. (2018) with a slight modification. Floral buds at 1.5~4.5 mm were collected from young inflorescences and then classified into three types by size. The developmental stages of the microspores were analyzed using 4', 6-diamidino-2-phenylindole (DAPI) (H-1200) solution and observed by fluorescence microscope (Olympus) (Winarto et al. 2011). The buds were put into beaker containing a few drops of water, kept at 4℃ for 0~4 d, and then surface-sterilized with 75% (v/v) ethanol for 30 s, 8% (w/v) sodium hypochlorite for 12 min, and rinsed with sterile distilled water for 3 times. Sterile buds were transferred to B5 medium supplied with 13% (w/v) sucrose at pH 5.8. The microspores were squeezed out and then filtered through a 40 µm mesh into a 10 ml centrifuge tube. The microspore suspension was centrifuged at 1200 rpm for 3 min. The pellet were re-suspended in B5-13 medium and centrifuged at 1200 rpm for 3 min, this procedure was repeated twice.
After decanting supernatant, the microspores were re-suspended in NLN-13 medium (pH 5.8) with 13% sucrose supplemented with AC to achieve the final suspension density of microspore at a concentration of 1~2 ×10⁵ microspore/ml. The microspore suspension was then poured into 35-mm Petri dishes (2 ml per Petri dish), and the cultures were incubated at 32.5℃ in the dark for 2 d, and then incubation continued at 25℃ in the dark for 20 d. The embryoid numbers were calculated and developmental stages of microspores were observed with an inverted microscope.
Temperature shock and AC treatment in radish genotypes
The selected buds were treated with cold treatment at 4℃ for 0, 12, 36, 48, 60, 72 and 96 h before the isolation of microspore, and the microspore suspension was treated with heat shock at 32.5℃ for 0, 24, 48, 72 and 96 h before culturing at 25℃, respectively. To investigate the effect of AC on microspore embryogenesis, different concentrations of AC was supplemented into the medium to maintain the concentration at 0.25, 0.50, 0.75, 1.0, 1.25 and 1.50 g/L, respectively.
Microspore embryoid germination and plant regeneration
The microspore embryoid germination was conducted based on the procedure of Takahata et al. (1996) with some modifications. When the embryoids were visible to the naked eyes, they were cultured at 25℃ under a 16-h photoperiod (4000 Lx) for 5~7 d. After the microspore embryoid turned green, the cotyledonary embryoids were transferred onto solid B5 medium with 3% sucrose, 0.8% agar, 0.2 mg/L 6-BA, 0.02 mg/L NAA and 0.1% AC (pH 5.8). The embryoid viability was evaluated after one week. After several subcultures, the plantlets were transferred onto solid B5 medium with 3% sucrose, 0.7% agar, 0.2 mg/L NAA for rooting.
The rooted plantlets were transplanted into a pot with sterilized mixture of peat soil, nutrient soil and vermiculite (2:1:1) and kept in growth chamber for one week with a day temperature of 25℃ (14 h) and night temperature of 16℃ (10 h) under high relative humidity (85%) during the first seven days, and then transplanted into an experimental plot in the greenhouse.
Ploidy level evaluation
Ploidy levels of the microspore-derived embryos (MDE) plantlets were determined by chromosome counting and flow cytometry analysis. For chromosome counting, root tips were pre-treated with ice water for 24 h and fixed in a mixture of absolute ethanol and glacial acetic acid (3:1, V/V) for 24 h at 4℃. Fixed root tips were hydrolyzed in 1 M hydrochloric acid in the water bath at 60℃ for 6 min and stained with a drop of 1% acetocarmine solution. The cells were then squashed and observed under a light microscope. The flow cytometry procedure was carried out as described by Zhang et al. (2007). The 100mg young leaves was chopped with sharp scalpel in 15 mM Tris-HCl (pH 7.5), 80 mM KCl, 20 mM NaCl, 20 mM EDTA-Na2, 15 mM mercaptoethanol and 0.05% (V/V) Triton X 100. Nuclei isolated from young leaves of plants were then stained with RNase and PI (propidium iodide) for 2 h at 4℃ in the dark. The DNA contents were measured with flow cytometry (American Beckman Co.)
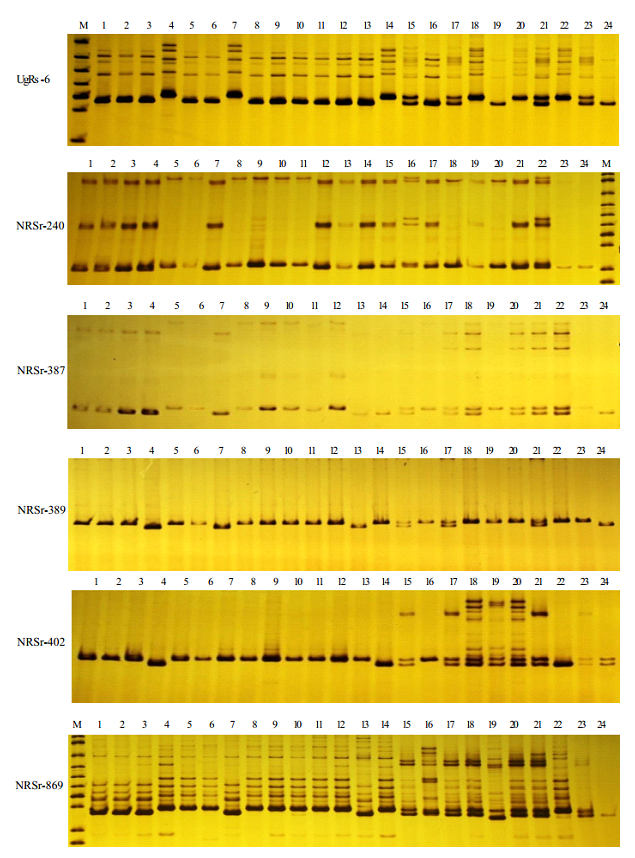
Homozygosity analysis of microspore-derived plantlets
The developed EST-SSR and genetic-SSR markers (Zhai et al. 2014) were employed to identify the homozygosity of microspore-derived plantlets. Genomic DNA was extracted from young leaves using a modified CTAB protocol (Liu et al. 2003). PCR amplification was performed on a Thermal Cycler (Senso Quest) with a 15 μl final reaction volume containing 2.0 mM MgCl2, 0.2 mM dNTPs, 0.75 U Taq DNA polymerase (TaKaRa Bio Inc.), 0.1 μM of each primer and 10 ng of template DNA. The PCR conditions comprised initial denaturation at 94℃ for 2 min, followed by 35 cycles of 94℃ for 40 s, 55~60℃ (varying with the Tm of the different primers) of for 45 s, 72℃ for 1 min, and a final extension of 72℃ for 7 min. PCR products were separated on 8% non-denaturing polyacrylamide gels at 120 V for 2~2.5 h and visualized with a silver staining method (Liu et al. 2008).
Reverse transcription quantitative PCR (RT-qPCR) analysis
Total RNA was extracted from MDE using RNAsimple total RNA kit (Tiangen). Then, the RNA was reversely transcribed into cDNA uisng PrimeScript™ II 1st Strand cDNA Synthesis Kit (TaKaRa) according to the manufacturer’s instructions. The RT-qPCR was conducted in a 20 μl reaction volume with 10 μl of 2 × SYBR Green PCR Master Mix (TaKaRa), 0.2 μM of each primer (Supplementary Table 2) and 2 μl diluted cDNA. The iCycler iQreal-time PCR detection system (BIO-RAD, USA) was used with the following conditions: 95℃ for 3 min, and 45 cycles of 95℃ for 5 s, 58℃ for 30 s, and 72℃ for 10 s, and the RsActin was used as the reference gene for normalization (Xu et al. 2012). The relative expression level of each gene was calculated by 2-△△CT method (Livak and Schmittgen. 2001).
Statistical analysis
The number of embryoids per petri dish was counted 40 days after microspore isolation. The data were analyzed and compared using SPSS 16.0 software by Duncan's multiple range test (p = 0.05) to determine the significance of differences among treatments.