Materials
The ST discs and implant fixtures (CP Ti, Grade II, ASTM F67) were kindly provided from Cowellmedi Co. Ltd. (Busan, Korea) for in vitro and in vivo studies, respectively. Their surfaces were modified with rGO or rhBMP-2 (Cowellmedi Co. Ltd.). GO was purchased from Graphene Laboratories Inc. (Ronkonkoma, NY). (3-aminopropyl)triethoxysilane (APTES, 99%) and ethanol were purchased from Sigma-Aldrich Co. (St Louis, MO). Epigallocatechin-3-O-gallate (EGCG, ≥96%) was kindly supplied by BMG Inc. (Kyoto, Japan). Potassium permanganate (KMnO4), concentrated sulfuric acid (H2SO4), hydrogen peroxide (H2O2), and de-ionized (DI) water were purchased from Samchun Chemical Co. (Seoul, Korea). The solvents used were of analytical grade and all the chemicals received were used without further purification.
Preparation of surface-modified ST discs and implants
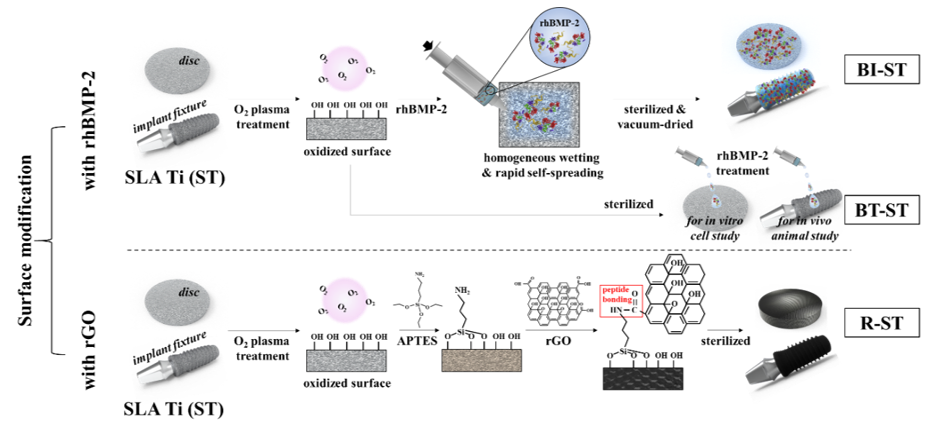
The surface of commercially available ST discs and implant fixtures was modified by different functionalization process as shown in Scheme 1. For preparing the R-ST discs and fixtures, their surface was initially oxidized and cleaned with O2 plasma treatment for 1.5 hr at room temperature and then immersed in 3% solution of APTES in ethanol for 1.5 h to introduce positive amine groups on the surface. After washing with DI water thrice, rGO solution was deposited on each surface via peptide bonds between the carboxyl groups of rGO and terminal amino groups of APTES. rGO had been converted from GO by heating in EGCG solution as described elsewhere [21]. Differently concentrated R-ST discs (10, 100 and 1000 μg/mL) were prepared in order to optimize the coating concentration of rGO on the surface (see Table S1). In the case of the BI-ST discs and fixtures, they were prepared according to the similar method as described in the previous study [22]. In brief, 15 μL aliquot of an rhBMP-2 solution (1 mg/mL) was pipetted onto the center of the specimen surfaces. Homogeneous wetting of the surfaces was achieved by rapid self-spreading of the rhBMP-2 solution across the dry ST surfaces by capillary forces. Finally, the specimens were frozen and dried under sterile conditions (at −40°C), and then vacuum dried at maximum 20°C. For comparison in in vitro and in vivo studies, the BT-ST discs (150 ng/mL of rhBMP-2 treatment for in vitro study) and implants (15 μg/mL of rhBMP-2 treatment upon implant placement) were also prepared respectively.
Physicochemical characterizations
The surface topography of R-ST was measured by atomic force microscopy (AFM; NX10, Park Systems Co., Suwon, Korea), followed by image analysis using XEI Software (Park Systems Co.). Water contact angle analysis was carried out by a contact angle goniometer (EasyDrop, model FM40Mk2, Krüss, Hamburg, Germany) using a drop-shape analysis program. Raman and X-ray photoelectron spectra (XPS) of samples were collected using Raman spectrometer (Micro Raman PL Mapping System, Dongwoo Optron Co., Ltd, Kwangju-si, Korea) and x-ray photoelectron spectrometer (AXIS Supra, Kratos Analytical, UK), respectively. The base pressure in the XPS chamber was 5 × 10⁻¹⁰ mbar. A wide scan was performed correcting the binding energies with C 1s as reference energy (C 1s = 284.8 eV). Fourier transform infrared (FTIR) spectra were collected by an FTIR spectrophotometer (Nicolet 560, Nicolet Co., Madison, WI). All spectra were recorded in absorption mode in the wavelength range of 1000-4000 cm−1 with a resolution of 4.0 cm−1 and 16-times scanning. Electron backscattered diffraction (EBSD) analysis was carried out by using the TEAM™ EBSD Analysis System combined with energy-dispersive X-ray (EDAX) to evaluate the texture and grain size of the samples setting the voltage at 20 kV and current at 6.0 nA.
Protein adsorption, cell attachment and cell proliferation assays
hMSCs were purchased from Lonza (Walkersville, MD) and used between passages 5 and 7. Cells were routinely cultured in MSC basal media (BM, Lonza), supplemented with 10% MSC growth supplement, 2% L-glutamine and 0.1% GA-1000, containing a 1% antibiotic antimycotic solution (including 10,000 units penicillin, 10 mg streptomycin, and 25 μg amphotericin B per mL, Sigma-Aldrich Co.) in a humid incubator maintaining an atmosphere of 5% CO2 and 37°C.
To quantify the surface protein adsorption on the samples, the protein concentration after incubation of the samples with culture media was determined by the bicinchoninic acid (BCA) assay. Briefly, disc samples were prepared and placed in a 24-well plate. The samples were washed three times with DI water and dried overnight under vacuum at room temperature. Then, samples were incubated with Dulbecco’s phosphate-buffered saline (DPBS, Gibco BRL, Rockville, MD) containing 10% fetal bovine serum (FBS, Welgene, Daegu, Korea), basal media (α-Minimum Essential Medium without supplements) and complete media (α-Minimum Essential Medium with supplements) for 24 h at 37°C. Samples were washed with DI water three times, and the protein concentration was measured by using Micro BCA™ Protein Assay kit (Pierce Biotechnology, Rockford, IL) following the manufacturer’s protocol.
To assess cell attachment, hMSCs (1 × 10⁵ cells/mL) were seeded onto Ti discs and cultured for 6 h. The non-adherent cells were removed by washing with DPBS three times. Cell numbers were quantified as a percentage of cell attachment using optical microscope images captured at different magnifications (inverted Leica DMIL microscope, Leica Microsystems, Wetzlar, Germany). A cell counting kit-8 (CCK-8) assay (Dojindo Laboratories, Kumamoto, Japan) was carried out to evaluate the proliferation of hMSCs. In brief, the cells were seeded onto the ST, BI-ST, BT-ST, and R-ST discs at a concentration of 1 × 10⁴ cells/mL, and cultured in the BM. On 1, 7, 14, and 21 days, the cells were washed with DPBS and incubated with CCK-8 solution for 2 h in the dark at 37°C. The cell proliferation on different Ti discs was assessed by measuring the absorbance at 450 nm using an ELISA reader (SpectraMax® 340, Molecular Devices, Sunnyvale, CA).
Alkaline phosphatase (ALP) activity assay and alizarin red S (ARS) staining
ALP activity, an early marker of osteoblast differentiation, was characterized using a commercial ALP assay kit (Abcam, Cambridge, MA) according to the manufacturer’s protocol. hMSCs were seeded onto the ST, BI-ST, BT-ST, and R-ST discs at a density of 1 × 10⁴ cells/mL, and incubated at 37°C. The cells were washed twice with DPBS and lysed using an ALP assay buffer with 1 h incubation at 37°C. An 80 mL of lysate was mixed to a 50 μL of freshly prepared ρ-nitrophenyl phosphate solution (1 mM) and incubated at 37°C for 1 h. A 20 μL of stop solution was added to quench the reaction. The ALP activity was calculated as the amount of ρ-nitrophenol (nM) divided by the volume of sample (mL) and the reaction time (min).
The extracellular mineralization was monitored by ARS staining. hMSCs were seeded onto the ST, BI-ST, BT-ST, and R-ST discs at a density of 1 × 10⁴ cells/mL, and cultured for 1 to 21 days. The cells were washed twice with DPBS, fixed with 2% paraformaldehyde (Sigma-Aldrich Co.), and stained using a 40 mM ARS solution (pH 4.2, Sigma-Aldrich Co.) for 20 min. To quantify mineralized nodule (%), the stained ARS within cells was extracted by adding a 10% acetic acid solution for 30 min with constant agitation and then neutralized with 10% ammonium hydroxide solution. The absorbance was recorded at 405 nm using an ELISA reader.
RNA isolation and real-time qRT-PCR
For real-time qRT-PCR analysis, hMSCs were seeded onto the ST, BI-ST, BT-ST, and R-ST discs at a density of 5 × 10⁴ cells/mL, and cultured for 14 days. Then, the cells were dissociated with 0.05% trypsin-EDTA (Invitrogen, Carlsbad, CA) by mild pipetting. Total RNA was extracted from the detached cells using TRIzol reagent (Invitrogen) and an RNeasy Mini Kit (Qiagen, Grand Island, NY). SuperScript III First-Strand cDNA Synthesis System (Invitrogen) was further used to synthesize first-strand cDNA from total RNA according to the manufacturer’s instructions. The mRNA expression of specific genes was then determined by real-time qRT-PCR using the total first-strand cDNA as the template and Power SYBR Green PCR Master Mix (Applied Biosystems, Carlsbad, CA). The sequences of the primers for RUNX2, osteocalcin (OCN), osteopontin (OPN), Vinculin, and b-actin are shown in Table S2. The expression level of b-actin was used as an endogenous normalizer and the relative expression levels were calculated using the -DDCt method.
Immunocytochemistry
For immunofluorescence staining, hMSCs were seeded onto the ST, BI-ST, BT-ST, and R-ST discs at a density of 5 × 10⁴ cells/mL, and cultured for 14 days. After incubation, the cells were fixed with 4% formaldehyde (Sigma-Aldrich Co.) for 15 min at room temperature (RT), permeabilized with 0.2% Triton-X 100 for 5 min and then blocked with a 2% bovine serum albumin (GenDEPOT, Barker, TX) solution in DPBS for 30 min. To immunostain OCN, the cells were incubated with primary mouse monoclonal antibody to OCN (1:250 dilutions, Abcam) overnight at 4°C. Subsequently, donkey anti-mouse IgG NorthernLights NL493-conjugated secondary antibody (1:200 dilutions, Abcam) was treated and then reacted with at RT in the dark for 2 h. The nuclei were counterstained with 4′,6-diamidino-2-phenylindole (0.3 mM, DAPI, Sigma-Aldrich Co.) at RT for 30 min. The immunofluorescence images were obtained under an upright fluorescence (FL) microscope (BX51, Olympus, Osaka, Japan) with a digital camera (Olympus). The green FL signals from the micrographs were quantified using ImageJ software (National Institutes of Health, Bethesda, MD) to compare the relative FL intensity of OCN-positive areas.
Surgical procedures for animal study and removal torque test
A total of 40 implants with 8.0 mm in length and 3.3 mm in diameter were used for in vivo animal study. Six male beagle dogs (mean age 24 months, mean weight 15 kg) were randomly chosen and six or eight implants in total were installed per animal. All the experimental animals were provided with a soft food diet and free water access. All animal experiments related to surgical procedures and treatments were approved by the Animal Experiment Ethics Committee of Seoul National University and performed in accordance with the Animal Care and Use Committee guidelines (SNU-160923-1).
Initially, surgery was performed to remove mandibular teeth from the experimental animals. The animals were anesthetized by intramuscular injection of atropine sulfate (0.05 mg/kg IM; Dai Han Pharm Co., Seoul, Korea) followed by isoflurane (Choongwae Co., Seoul, Korea). A 1 mL of 2 % lidocaine HCL and 1:100,000 epinephrine (Yu-Han Co., Gunpo, Korea) solution was injected into the extraction area. The premolar and first molar teeth were extracted bilaterally. Subsequently, the extraction area was closed using a sterile synthetic absorbable suture material, 4-0 Vicryl® (Johnson & Johnson, New Brunswick, NJ). When the mandibular extraction area was completely healed after an 8 weeks-period of recovery, a second surgery was carried out to place the implants into the alveolar ridge. The animals were anesthetized following the procedure as described for the teeth extraction. The alveolar ridge was trimmed into a flat ridge and drilled into a hole for implant placement. Each experimental implant was applied randomly (6 implants per animal, n = 6 per group) in the edentulous mandibular alveolar ridge and subsequently, the mucoperiosteal flaps were sutured. Intravenous injection of cefazolin (20 mg/kg) was carried out at 48 h of postoperation. Plaque control was managed with daily flushing of the oral cavity with 2% chlorhexidine gluconate. The animals were fed with a soft diet for 2 weeks followed by a conventional diet in the remaining periods. Intravenous injection of concentrated sodium pentobarbital (Euthasol, Delmarva Laboratories Inc., Midlothian, VA) was administered to sacrifice the animals at 8 weeks of postsurgery. Following euthanasia, a total of 30 block sections of implants, alveolar bone, and surrounding mucosa was harvested from the experimental animals and fixed in a 10% neutral buffered formalin solution (Sigma Aldrich Co.) for the analyses.
With the same procedure as described for the teeth extraction and placement, each implant specimen was installed randomly (8 implants per animal, n = 4 per group) in the mandibular alveolar ridge. Two animals were sacrificed at postoperative 8 weeks and then the alveolar ridge placed with implants was immediately processed for the measurement of the maximum removal torque (MRT) with a torque testing machine (CME, Técnica Industrial Oswaldo Filizola, SP, Brazil). The maximal force was measured by removing the specimens via an anti-clockwise rotation, and the mean MRT values were calculated for each group.
Micro-computed tomography (μ-CT) analysis
New bone formation in the peri-implant area was evaluated using μ-CT analysis after 8 weeks of implantation. The specimens were sealed with Parafilm M® (Bemis Company, Inc., Neenah, WI) to prevent drying during the scanning procedure. All the specimens were scanned using a bromine filter (0.25 mm) (Skyscan-1173, version 1.6, Bruker-CT, Kontich, Belgium) with parameters 60 μA intensity, 130 kV energy, and 7.10 μm-pixel resolution. The images were processed by the NRecon reconstruction software program (version 1.6.10.1, Bruker-CT). The width of the region of interest (ROI) in the treated mandibular surgical area was 1.0 mm around the implant and the height was 4.0 mm vertically above the implant platform. New bone volume (NBV; mm3) was estimated from the volume occupied by new bone within ROI.
Histomorphometric analysis
After analyzing μ-CT, the specimens were cleaned thoroughly and dehydrated using ethanol with a gradual increase in concentration from 70% to 100%. The dehydrated specimens were subsequently embedded in acrylic resin (Technovit 7200, Heraeus Kulzer, Germany) and then sectioned longitudinally at the center of each implant using a diamond cutting system (EXAKT 300 CP, Germany). The thickness of the final slides was grounded from the initial 400 μm to the final 40 ± 5 μm by the Exakt grinding system (Kulzer Exakt 400CS, Germany). Goldner Trichrome staining was accomplished to examine the newly regenerated bone tissue. The images of the slides were captured at 40 × magnification using an optical microscope (Olympus) connected with a charge-coupled device digital camera (SPOT Insight 2Mp, Diagnostic Instruments, Sterling Heights, MI) with an adapter (U-CMA3, Olympus). The captured images were further processed using an image-analyzing software (IMT i-Solution Inc., Coquitlam, BC, Canada). Bone-to-implant contact (BIC) ratio (%) was measured from the length of bone contact divided by the total length of the three upper threads. Intra-thread bone density (ITBD; %) was estimated from the areas occupied by the new bone divided by the total area between three upper threads of the implant [23].
Statistical analysis
All experimental results are presented as the mean ± standard deviation (SD). The statistical analyses were performed using a software R (version 3.1.3). The data were analyzed using a one-way analysis of variance (ANOVA), followed by a Bonferroni test for multiple comparisons. Statistical analysis for in vivo results was performed using the Kruskal–Wallis one-way ANOVA and the Mann–Whitney U test. Values of p < 0.05a, p < 0.01b, and p < 0.001c were considered statistically significant (n = 6 for physicochemical measurements and in vitro cell study; n = 4 or 6 for in vivo animal study).