Isolation and bioinformatics analysis of PvSVP2
We isolated two SVP-like genes PvSVP1 and PvSVP2, from P. violascens according to the P. edulis transcriptome database. However, only PvSVP2 data were shown in this paper. The PvSVP2 is 693 bp nucleotides long, and 230 amino acids possess a MADS-box and K-box (Fig. 1a). Moreover, many DNA binding sites and dimerization interfaces were found in the MADS-box of the PvSVP2 protein (Fig. 1a). Its theoretical molecular weight (MW) and the theoretical isoelectric point (pI) were 26.02 KDa and 7.76, respectively. Phylogenetic tree analysis showed that PvSVP2 were grouped with monocot Poaceae SVP-like proteins (Fig.1b). Moreover, PvSVP2 clustered as a subgroup with BM1, ZMM20 and OsMADS47, and was more closely related to OsMADS47 from O. sativa, with 75.1% identity (Fig.1c).
Expression analysis of PvSVP2
qRT-PCR analysis was carried out for detecting the transcript level of PvSVP2 in different tissues and developmental stages. The results showed that PvSVP2 was expressed in all tested tissues, including young leaf, mature leaf, culm, rhizome, shoot and flower (Fig. 2a). In flowering and non-flowering plants, the mRNA levels of PvSVP2 were higher in culm and rhizome, whereas lowest in the shoot. To determine whether PvSVP2 were related to flowering in P. violascens, we analyzed the expression in the leaf and flower of flowering plant (FL and FF), respectively and the leaf of the non-flowering plant (VL). These tissues were collected in three different stages T1, T2 and T3 as described by our previous publication, Liu et al. (2016) (T1: the time when the floral bud formed and switched from the vegetative phase into the reproductive stage (March 15); T2: The time when the inner organs of the flower began to form (March 29); T3: The blooming stage when the anther was outcropped from palea (April 12)). The expression of PvSVP2 changed with the flowering stage from March 15 to April 12 (Fig. 2b). The mRNA level of PvSVP2 in FL increased first from T1 to T2, and then decreased to T3. In VL, the mRNA level of PvSVP2 was first reduced from T1 to T2 and then remained almost unchanged during T2-T3. In contrast to FL and VL samples, the mRNA level increased significantly from T1 and T2 in FF, then remained unchanged to T3. Moreover, the PvSVP2 expression in FF was lower at T1 and higher in T2 and T3 than VL and FL (Fig. 2b).
Ectopic expression of PvSVP2 in A. thaliana caused the early flowering and abnormal floral morphologies
To determine PvSVP2 function, we generated transgenic A. thaliana plants expressing PvSVP2 constitutively (35S::PvSVP2). Among eleven homologous T3 transgenic A. thaliana lines, we selected three lines (line 1, line 28 and 42) for further analysis. Compared with the wild-type A. thaliana, plants carrying 35S::PvSVP2 vector (line1, line28, and line42) flowered significantly early by an average of 9.4 days (Fig. 3a, b, p<0.01). Further, the number of rosette leaves at the time of bolting for three 35S::PvSVP2 lines were less than the control plants with an average of 2.4 leaves (Fig. 3c, p<0.05 or p<0.01). The qRT-PCR analysis identified that the flowering time was correlated with the PvSVP2 expression level (Fig. 3d). For example, line 28 was the earliest flowering plant among the three lines studied, containing the highest transcript level of PvSVP2. Moreover, 35S::PvSVP2 transgenic lines also produced abnormal floral organs. As follow, the sepals of transgenic plants appeared to be small and leaf-like structures (Fig. 4b, c), which did not enclose and protect inner floral parts (Fig. 4e) and kept on until the seed capsule matured (Fig. 4f, g). Meanwhile, the petals also displayed the opened phenotype (Fig. 4a, b). Besides, the petals of 35S::PvSVP2 transgenic lines were initially green and became purple with the flowering process (Fig. 4b, c).
PvSVP2 overexpression altered the expressions of flowering-related genes in transgenic A. thaliana plants
It is well reported that SOC1, FT and FLC genes are involved in the regulation of flowering time (Li et al. 2008; Jang et al. 2009; Mateos et al. 2015). Therefore, to analyze the influence of PvSVP2 on the flowering time, transcript levels of FT, SOC1 and FLC genes were analyzed by qRT-PCR. Compared with the wild-type plants, in 35S::PvSVP2 transgenic plants, FT and SOC1 transcript levels were both increased, but FLC transcript levels displayed no noticeable change (Fig. 5). These results indicate that PvSVP2 overexpression causes early flowering mainly by upregulating the FT and SOC1 genes in transgenic A. thaliana. Further, we also analyzed the AP1, AP3 and PI genes, which are essential for developing flower organs (Liu et al. 2009). The AP1, AP3 and PI expressions were highly upregulated in 35S::PvSVP2 transgenic plants compared with the wild-type plants. The qRT-PCR results indicated that AP1, AP3 and PI expressions are positively correlated with PvSVP2 expression in transgenic lines (Fig. 5). These results indicated that overexpression of PvSVP2 in A. thaliana affects the development of the floral organ by modulating AP1, AP3 and PI expression.
PvSVP2 located in the nucleus and cytomembrane
We predicted that the PvSVP2 was located in the nucleus by the WoLF PSORT software. Further, we confirmed the subcellular location using the particle bombardment method using onion epidermal cells. Confocal microscope images revealed that the PvSVP2-GFP fusion protein was mainly localized in the nucleus and thinly localized in the cytomembrane of the onion epidermal cells. In contrast, the empty vector was uniformly distributed throughout the whole onion cell (Fig. 6a). To further confirm this, the PvSVP2-GFP fusion vector was also transformed into the A. thaliana protoplasts by PEG-mediated transformation. These results also confirm that PvSVP2-GFP was positioned in the nucleus and cytomembrane of the A. thaliana protoplasts (Fig. 6b).
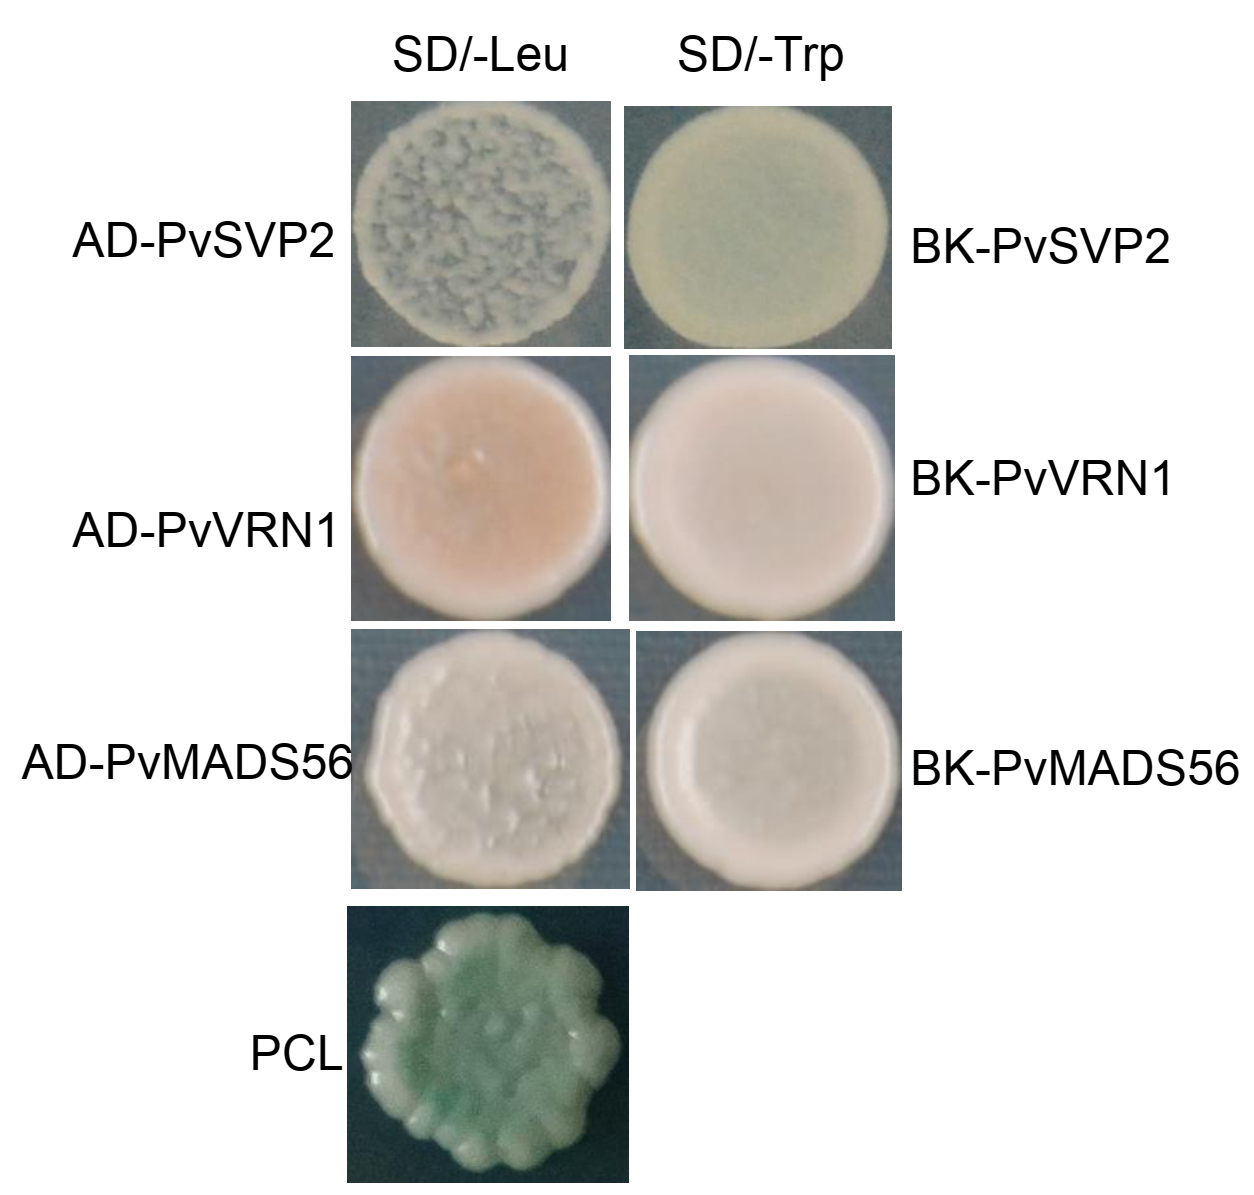
PvSVP2 could interact with PvVRN1 and PvMADS56 in yeast two-hybrid and BIFC assays
To further investigate the PvSVP2 role in flowering, the protein-protein interaction experiments were performed between PvSVP2 and PvVRN1 (an AP1 homolog) (Ma et al. 2016) and PvMADS56 (a SOC1 homolog) (Liu et al. 2016) through yeast two-hybrid. The PvSVP2, PvVRN1 and PvMADS56 genes in pGBKT7 or pGADT7 developed white colonies in SD/-Leu/X-gal or SD/-Trp/X-gal media, respectively, suggesting that these proteins had no transcriptional activity in yeast (Fig. S1). The yeast cells co-transformed with pGBKT7-PvSVP2 + pGADT7-PvVRN1 and pGBKT7-PvSVP2 + pGADT7-PvMADS56 were able to develop blue colonies in SD/-Trp/-Leu/-His/-Ade/ X-α-gal media (Fig. 7). These results indicated the direct PvSVP2 interaction with PvVRN1 and PvMADS56 in yeast cells. Further, we confirmed these protein-protein interactions through BIFC assay. Strong YFP signals were observed in the cytoplasm of protoplasts transformed with plasmids PvSVP2-cYFP/PvMADS56-nYFP and PvSVP2-cYFP/PvVRN1-nYFP (Fig. 8). BIFC experiment confirmed that PvSVP2 could interact with PvVRN1, PvMADS56 in vivo.
Prokaryotic expression of PvSVP2
We used the prokaryotic expression system to analyze PvSVP2 protein solubility. The PvSVP2-pHTT construct was induced at 37oC and 20oC, respectively (Fig. 9a). SDS-PAGE analysis showed that a specific protein band of about 30 kDa was expressed in supernatant at 20oC by IPTG induction (Fig. 9a, lane 5). However, the molecular mass of the fusion protein was 27 kDa including a 1kDa His tag protein and a 26 kDa PvSVP2 protein. To further verify it, the soluble protein was further purified with a dextrin sepharose high performance Fig. 9b) and the protein sequence was examined by MALDI-TOF/TOF mass spectrometer analysis. As Fig. 9c shown, the generated peptides and the peptides derived from PvSVP2 protein sequence had high coverage rate, reach to 53%, indicating that the protein was PvSVP2-pHTT fusion protein.