Rho family members in cotton
CDC42, as a small GTPase, plays an essential role in cell polarity in researches about vertebrates. Given that the cotton fiber has a polarity growth during fiber development, we infer that key factors homologous with CDC-42 in cotton could regulate fiber development. After gaining Rho HMM (Hiden Markov Model) file from Pfam platform, we identified Rho members among eight Gossypium species, including three diploids and five tetraploids (Table 1). Because of two sub-genomes contained by tetraploid, we separated Rho members in tetraploid cotton into two parts, members from A sub-genome and D sub-genome. Membership of identified Rho genes were furtherly validated by annotation from Uniprot (Table S1). Finally, we got 139-170 Rho members in 8 cotton species. Among these Rho members, the protein sequence with the longest length was from G. arboreum, while the shortest length of proteins, 644 or 645, were from 4 tetraploids (Table S2). Variations in protein length implied high sequential diversity among Rho family members during cotton evolution.
Phylogeny analysis of Rho members in cotton
To investigate the diversity of Rho members furtherly, phylogenic analysis about Rho genes was performed. Rho genes were gathered and two phylogenic trees were built according to two sub-genomes, respectively (Figure 1a, 1b). Rho members from two A genomes (G. herbaceum and G. arboreum) and five A sub-genomes (At1-At5) were classified into five groups, while, members from D genome (G. raimondii) and five D sub-genomes (Dt1-Dt5) were classified into eight groups. As GTPase members related to cell polarity are identified in other species, Rho members participate in the basic biological processes and influence cotton evolution. We evaluate sequence conservation of Rho genes in 8 cotton species. (Figure 2). Firstly, Rho members from three diploids (A1, A2, and D5) were dealt with multi-alignment (Figure 2a). The results of multi-alignment identified that Rho genes in cotton had high diversity. Then, Rho genes from tetraploid and corresponding diploids were used to calculate identical site rate. The conservation of Rho members were evaluated by identical site rates (Figure 2b). We furtherly compared identical rates of Rho members among cottons and noticed that Rho members in G. herbaceum (A1-A1) had lower identical site rates than those in G. arboreum (A2-A2) (Figure 2b). What’s more, we found that for A1 genome, inter-specific conservation (A1-At1-5) were higher than intra-specific conservation (A1-A1) among Rho genes (higher identical site rates), indicating high conservation of A1 and 5 A sub-genomes (Table S3). These result indicated that Rho members in G. herbaceum suffered less sequence diversification and was consistent with the previous conclusion that G. herbaceum is more relative with the donor of A sub-genome (Huang 2020). For the situation in D5 genomes, Rho members in G. raimondii were more conserved with those from D sub-genomes in G. hirustum (D5-Dt1) and G. tomentosum (D5-Dt3). (Table S3). From the results of phylogenic analysis about Rho genes, we found that Rho members had different sequence diversity, impling Rho may play important role in cotton evolution. More conservation between Rho genes from D5 genome and those from Dt1 and Dt3 showed Rho genes suffered a selection before domestication of Gossypium hirustum and may result in formation of long fiber.
Fiber length-related association analysis about Rho members
To check the potential role of Rho members in fiber development, we performed association analysis about fiber length based on previous sequenced data (Du 2018). From 419 resequenced cultivars, 30 with the longest fiber and 30 with the shortest fiber were selected as long/short fiber groups. By t-test, significant divergence of fiber length was observed between 2 groups (p=1.618e-30) (Figure 3a and Table S4). To detect candidate genomic regions, genome sequences were divided into windows (windowsize=50000, stepsize=5000) and Fst of these windows were calculated.(Figure 3b). Finally, the windows with the top 5% Fst from 44626 windows were selected for gene detection. 6885 genes overlapped with the selected windows were extracted as candidate genes (Table S5 and Table S6). The functions of 6885 genes were initially checked by GO enrichment analysis. We found that basic biological processes such as RNA binding (GO:0003723), mRNA splicing (GO:0000398), and several processes related to glucose metabolism, for instance, galactose metabolic process (GO:0006012), UDP-glucose 4-epimerase activity (GO:0003978) were enriched. Interestingly, we noticed that GTPase activity (GO:0003924) was also enriched, indicating the activities of GTPase could influence fiber length (Figure 3c and Table S7). 34 Rho members were found in the 6885 candidate genes which were focused on in the subsequent analysis (Table S8).
Expression patterns of Rho members in transcriptome data
From 34 Rho members gained by association analysis, only genes having transcriptional activation could be transcribed and translated into protein with biological functions. To evaluate the transcription ability of 34 Rho members, we proposed transcriptome profiling based on the previously published data. Raw transcriptome data of 8 samples were downloaded, consisting of 4 ovules and 4 fibers of 2 materials, 69-6025-12 with short fiber and 601 long stapled cotton with long fiber (Table 2). After raw data alignment and transcripts identification, we gained transcription abundance of each gene. 8678 and 298 differentially expressed genes (DEGs) from fiber/ovule and long/short fiber groups were identified, respectively(Figure 4a,4b, Table S9). We defined genes with the maximum TPM larger than five as expressed genes. For candidate 34 Rho genes, 22 of them were found to be expressed, and one of them, Ghir_D03G002970, was validated as an expressed gene by qRT-PCR (Figure 4c and Table s10). Among 22 expressed Rho members, 10 of them were found in DEGs from the fiber/ovule group (Figure 4d and Table S10). These 10 Rho members with diverge expression patterns between fiber and ovule epidermis cells may participate in polarity growth.
WGCNA analysis of transcriptome data
Rho members may regulate cell polarity with the involvement of other genes. To infer the potential interactions of Rho members during fiber development, we proposed a weighted gene co-expression network analysis (WGCNA) (Figure 5a). Genes whose maximum transcription abundance smaller than five were trimmed. The soft threshold of the network was set as 26, because R square was above 0.8, and mean connectivity was lower than 2000 under this threshold, indicating the network we built was scale-free (Figure 5b). After network construction, genes were classified into 13 modules according to the expression spectrum (Figure 5c).
Since the modules were generated by expression patterns of genes in each module, an association analysis between gene modules and phenotype data revealed potential functions of these modules. The phenotype data of 8 samples were classified as fiber/ovule and long /short fiber materials. We set 0.5 as the threshold of Pearson correlations to link module to phenotype (Figure 5d). Among modules, pink, magenta, and tan modules were related to the long fiber trait, while the purple module was related to the short fiber trait. As for the fiber/ovule trait, we found blue and brown modules related to fiber development. On the other hand, pink, turquoise, purple, and tan modules were related to ovule tissue.
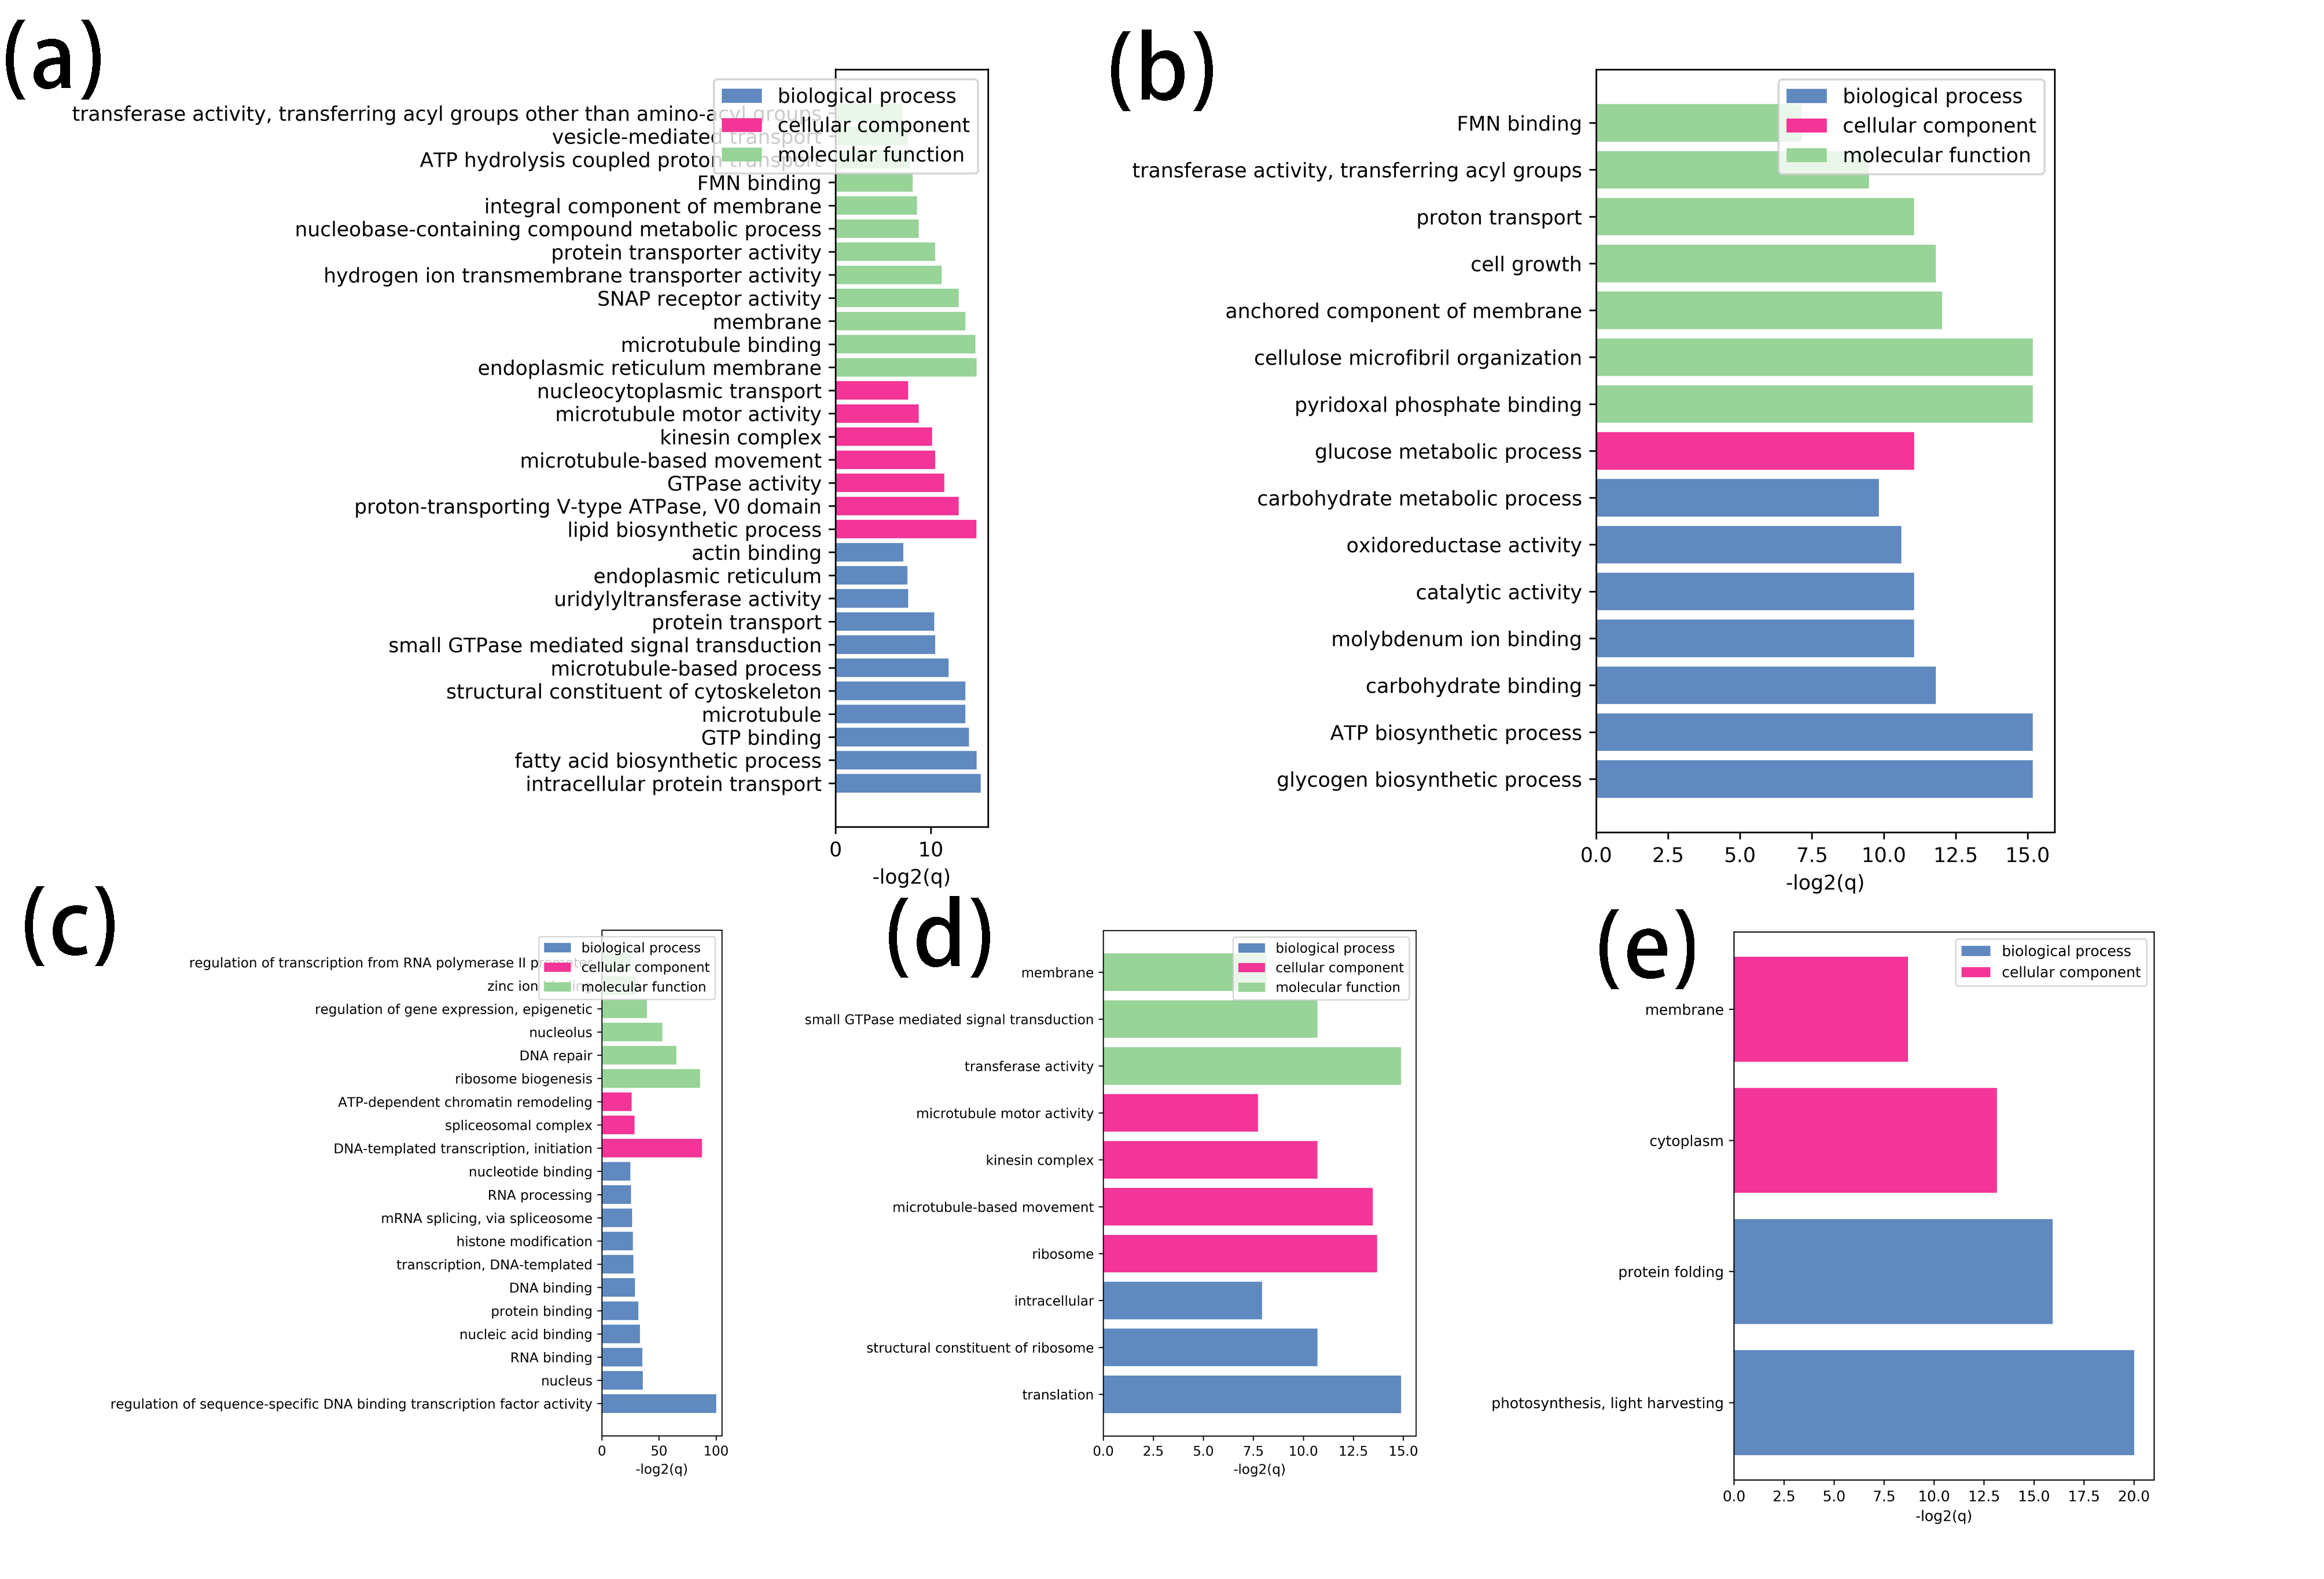
We checked the distribution of 22 expressed Rho members on 13 modules and found that 7, 3, 10, 1, 1 Rho members were contained by blue, brown, turquoise, green, and magenta modules, respectively (Figure 5e). To investigate the role of these modules, the genes with the top 10% membership were selected for GO enrichment analysis (Table S11). Results of GO enrichment of blue module showed that fatty acid biosynthetic process (GO:0006633), microtubule (GO:0005874), and microtubule-based movement (GO:0007018) were enriched (Figure S1a). The other ovule-related brown module contained different GO terms, such as glucose metabolic process (GO:0006006), cellulose microfibril organization (GO:0010215), and cell growth (GO:0016049) (Figure S1b). Although various biological processes were enriched in blue and brown modules, most of the enriched GO terms were metabolic pathways. While, the situation in the turquoise module were opposite. More basic biological processes such as RNA binding (GO:0003723), DNA binding (GO:0003677), and chromatin remodeling (GO:0006338) were enriched to these fiber-related modules (Figure S1c). The green module, another fiber-related module, had microtubule-based movement (GO:0007018), microtubule motor activity (GO:0003777), and small GTPase mediated signal transduction (GO:0007264) gathered (Figure S1d). The photosynthesis and light-harvesting (GO:0009765) was the most significant GO terms in magenta module, which was related to long fiber, implying the role of photosynthesis in fiber elongation (Figure S1e). Various GO terms in modules which harbour Rho genes indicated that complicated mechanisms underlying control of cell polarity by Rho members.
Interaction networks of Rho family members
The membership of the corresponding modules furtherly filtered expressed Rho members from 5 modules, and Rho genes with the highest membership were selected (Table S12). Finally, Ghir_A12G010690, Ghir_D08G007370, Ghir_D08G018200, Ghir_A11G010670, and Ghir_D03G002970 were selected as core genes from blue, brown, magenta, turquoise, and green modules (Figure 6). Among 5 core genes, 2 of them, Ghir_A12G010690 and Ghir_D08G007370, were DEGs. The genes possessing high transcriptional correlationship (pearson) with core genes were recorded as infered interacted genes which were used to construct interaction networks. GO enrichment of genes in networks were consistent with results from genes having high membership with corresponding modules (Table S13). In the network of a DEG, Ghir_A12G010690, genes were related to the fatty acid biosynthetic process (GO:0006633), microtubule-based process (GO:0007017), and small GTPase mediated signal transduction (GO:0007264). The fatty acid was essential for fiber elongation (Qin et al. 2011). Meanwhile, small GTPase mediated signal transduction was also enriched in this network, implying Ghir_A12G010690 may participate in signal transduction to activate polar growth and regulate fiber elongation through regulating fiber-related biological processes such as fatty acid biosynthesis (Figure 6c and Figure 6d). In the other four networks, there were also other GO terms involved in fiber development, such as cell wall biogenesis (GO:0042546), calcium ion binding (GO:0005509) (Table S13). The diverse enriched GO terms of these five networks indicated that different Rho members played various roles in influencing cotton fiber cell polarity.