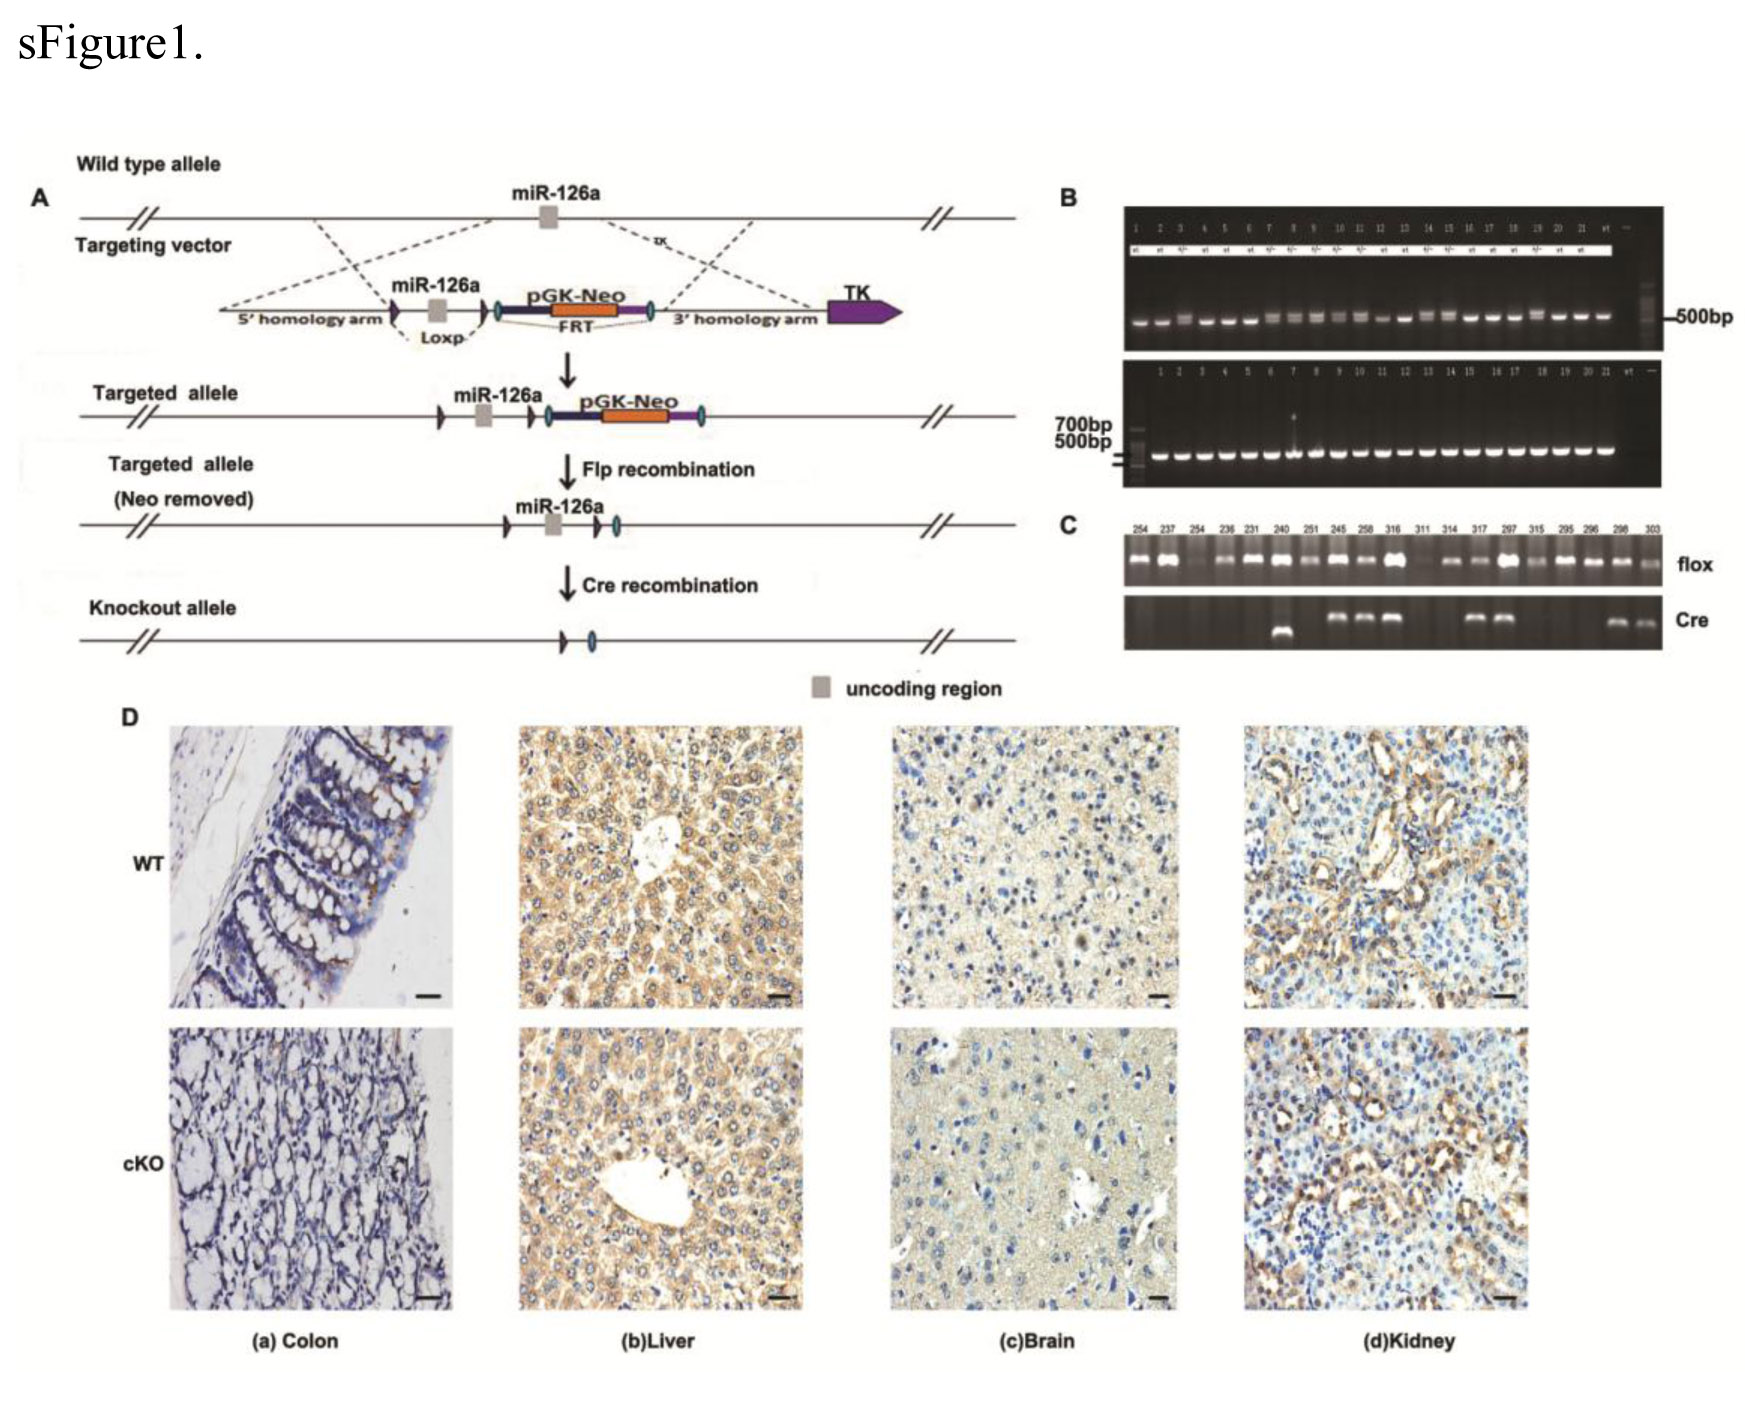
Generation of IEC specific miR-126 deficient mice
MiR-126 floxed mice were developed by the Shanghai Model Organisms Center, Inc (Shanghai, China). The Cre/loxp and Flp/FRT recombination systems were used to target exon1 of miR-126 by ES cell targeting methods to generate the miR-126flox-Neo/+ mice. The miR-126flox-Neo/+ mice were then crossed with Flp transgenic mice to delete the Neo cassette and obtain the miR-126fl/+ mice. To generate mice lacking miR-126 in the intestinal epithelium cells, the miR-126fl/+ mice were crossed with Villin-Cre (Tg(Vil1-Cre), The Jackson Laboratory). Genomic DNA was extracted from tail biopsies and used as a template for PCR analysis with the appropriate primers to identify mouse genotypes (primers are listed in Table 1). Routine genotyping of mice was carried out by PCR amplification (sFigure 1). The male and female cKO mice were fertile, developed normally, and displayed no gross morphological abnormalities.
Initially, all used mice in this study were 8–10 weeks old and bred in-house to generate comparable groups. And all mice were maintained under the pathogen-free condition and fed autoclaved food and water. All animal studies were carried out in strict accordance with the recommendations in the Guide for the Care and Use of Laboratory Animals (National Institutes of Health). The protocol was approved by the Animal Ethics Committee of Central South University for the protection of animals used for scientific purposes.
Induction of CAC
Eight to ten-week-old C57 mice, cKO mice, and wild-type(WT) littermates were injected with an intraperitoneal administration of AOM (Sigma-Aldrich, St. Louis, MO, USA; 10 mg/kg)dissolved in physiological saline. Seven days later, the mice were given drinking water including 1.5% DSS (MP Biomedicals, Solon, OH, USA; MW, 36000–50000 Da) for the following seven consecutive days, followed by regular water for two weeks. These three weeks constituted one cycle, and additional two cycles were repeated. And then regular water was administered until the end of the experiment on the 18th weeks. The experiments were performed with at least 6–8 mice in each AOM-treated condition. During the treatment course, bodyweight, diarrhea, and haematochezia were recorded daily.
In order to interference with the CXCL12/CXCR4 axis, mice were treated daily with AMD3100 (5 mg/kg, i.p) or PBS for the control group. These mice were sacrificed at the indicated time intervals, and colon tissues were opened longitudinally, colon size and the number of tumors were measured. Colon sections were frozen in liquid nitrogen for total RNA and protein extraction or fixed in 4% paraformaldehyde, dehydrated, and embedded in paraffin for histological analyses. Serum collected from each mouse was prepared for inflammatory cytokines detection. All mice procedures were performed in accordance with institutional guidelines.
Scoring of mouse disease activity index (DAI)
Scoring of the mouse disease activity index was performed as previously reported in a blinded fashion16. Briefly, DAI ranging from 0 to 4 was calculated as follows: stool consistency (normal, loose, diarrhea), presence or absence of haematochezia (guaiac paper test and macroscopic evaluation of the anus), and weight change.
Histopathological analysis
Paraffin-embedded sections were then stained with hematoxylin and eosin (H&E) for microscopic examination. The slides were reviewed and scored for inflammation by two pathologists blinded to the treatment based on the criteria as follows: score 0, no inflammation; score 1, modest numbers of infiltrating cells in the proper layer; score 2, infiltration of inflammatory cells with mild mucosal hyperplasia; score 3, massive infiltration of immune cells with disrupted mucosal architecture, and marked mucosal hyperplasia; score 4, all of the earlier described plus crypt abscesses or ulceration.
In situ hybridization (ISH) and immunohistochemical staining (IHC)
In situ hybridization was used to detect miR-126 expression in the mouse colon tissue. The detection of miR-126 by ISH was performed utilizing an enhanced sensitive ISH detection kit (Boster, Wuhan, China) according to the manufacturer’s instruction. Here, the image with brown or yellow was regarded as positive signals of miR-126 expression. Immunohistochemistry was carried out on 4µm-thick paraffin-embedded sections from the colorectums in mice. Here, the image with blue or purple was regarded as positive signals of miR-126 expression. The deparaffinized sections were incubated with primary antibody at 4˚C overnight followed by incubation with biotinylated goat antirabbit or mouse IgG antibody (Vector Laboratories, Burlingame, CA) for 30 min. Primary antibodies were purchased from the listed vendors: p65(Cell Signaling Technology, Danvers, MA); CXCL12(Cell Signaling Technology, Danvers, MA); CXCR4 (Santa Cruz Biotechnology, Santa Cruz, CA); p-p65(Abcam, Cambridge, UK); and CD68 (Boster, Wuhan, China). The omission of the primary antibody was used as the negative control. The immune-stained slides were observed under a microscope (OLYMPUS BX-51, Japan) by two independent pathologists blinded to clinicopathologic features and clinical courses. A semi-quantitative scoring criterion for immunohistochemistry was used, in which both staining intensity and positive areas were recorded. The intensity was scored as 0 (no staining), 1 (weak staining), 2 (moderate staining), and 3 (strong staining). The percentage of positive tumor cells was set as follows: 0 (< 5%), 1 (5–25%), 2 (26–50%), 3 (51–75%). And the final score = 0 was defined as negative expression, otherwise was defined as positive expression.
Cell culture and transfection
Human CRC cell line(Caco2), HEK293 cell line, and the human monopoly cell line THP-1 were obtained from the Cancer Research Institute of Central South University (Changsha, Hunan, China). All cells were cultured at 37°C in RPMI 1640 medium (Hyclone) supplemented with 10% fetal calf serum, 100U/ml penicillin, and 100 mg/ml streptomycin in a humidified atmosphere containing 5% CO2. THP-1 cells (4×10⁵/ml) were differentiated into macrophages using 150 nM phorbol 12-myristate 13-acetate (PMA, Sigma-Aldrich) for 2d. miR-126 mimic, miR-126 inhibitor, and the corresponding scrambled negative control (NC) vectors and inhibitor negative control (iNC) vectors were synthesized by GenePharma (Suzhou, China). Cells were transfected with 50 nM miRNA mimics or 50nM miRNA inhibitors using Lipofectamine 3000 reagent (Invitrogen, Carlsbad, CA) according to the manufacturer's instructions.
Generation of instantaneous transformants
MiR-126 mimics, miR-126 inhibitors, the NC, and iNC vectors were purchased from GenePharma (Guangzhou, China). Cells were transfected with 50 nM miRNA mimics or 50 nM miRNA inhibitors using Lipofectamine 3000 reagent (Invitrogen, Carlsbad, CA) according to the manufacturer's instructions.
Cell migration assays
The impacts of CXCL12 and colon cells with different expression levels of miR-126 on the migration of macrophages were determined by transwell migration assays, respectively. Briefly, THP-1 induced macrophages (2×10⁵ cells/well) in 200μl FBS-free medium were cultured in triplicate in the top chambers of 24-well transwell plates (8.0μm pore, Millipore). In the bottom chamber, 15% FBS medium (600μl /chamber) with 100ng/ml CXCL12, 100ng/ml AMD3100, or Caco2 cells transfected with miR-126 mimics, negative vector, inhibitor, or inhibitor negative vector was added as a chemoattractant. After being cultured for 24h, the macrophages remaining on the membrane surface of the top chamber were removed with a cotton swab. The migrated cells onto the bottom surface of the top chambers were fixed with 4% paraformaldehyde, stained with 0.1% crystal violet solution, and imaged under a light microscope. The cells in 10 fields selected randomly were counted in a blinded manner.
RNA extraction and quantitative real-time PCR
Total RNA was extracted from the cells and tissues using Trizol method. The purity and concentration of RNA were determined by ultraviolet spectrophotometry. RNA integrity was assessed by agarose gel electrophoresis. Total RNA was used to synthesize cDNA by reverse transcription with the SuperScript™ RT reagent Kit (Thermo Fisher Scientific, Waltham, USA) with a reaction system volume of 20μL. Expression of the mRNAs was evaluated using SYBR green qRT-PCR (Takara Biotechnology Ltd., Dalian, China) under the standard protocol. GAPDH was used as an internal control, and the relative quantitative method was applied to calculate the relative mRNA copy number (measured in triplicate) 2-ΔΔCt was used to express the ratio of target mRNA expression relative to the GAPDH mRNA expression. The miDETECT A TrackTMmiRNA qRT-PCR kit (RiboBio, Guangzhou, China) was used to synthesize the cDNA of miR-126 and analyze its expression. U6 small nuclear RNA was used as an internal control for assay of miRNA expression levels, and expression of each gene was quantified by measuring cycle threshold (Ct) values and normalized using the 2–∆∆Ct method relative to U6 small nuclear RNA16. The RT-PCR primers are listed in Supplementary Table 1.
Western blot
In Western Blot analysis, total proteins were extracted from the cultured cells using RIPA buffer with both phosphatase and protease inhibitors (Roche, IN). Equal aliquots of 50μg total proteins were separated by an SDS-PAGE (10% acrylamide). Then they were transferred to a PVDF membrane (Merck Millipore, Germany). Membranes were blocked in TBST containing 5% skim milk and then incubated with primary antibodies overnight at 4°C followed by secondary antibodies for 1h at 37°C. Finally, an ECL detection system (Merck Millipore, Germany) was used for signal detection. Mouse monoclonal antibodies against IL-1β(3A6) and CXCL12 (D32F9) were purchased from Cell Signaling Technology. Rabbit polyclonal primary antibodies against IL-6 (ab6672) were pursed from Abcam. The mouse monoclonal antibody against GAPDH and the rabbit monoclonal antibody against β-Tublin was purchased from Google biology (Wuhan, China).
miRNA: mRNA Immunoprecipitation (RIP)-Chip with Anti-pan-Ago
For each sample, 2×10⁷ cell equivalent HEK293 cells were subjected to immunoprecipitation using the miRNA Target IP kit (Active Motif, Carlsbad, CA, USA) following the manufacturer’s protocol. Briefly, approximately 24h after transfection of 5μmol mimics-miR-126, cells were washed with ice-cold PBS, scraped off, and lysed in 150μL ice-cold complete lysis buffer (provided in the kit). Approximately 100μL of the whole-cell extract was incubated with 900μL. Immunoprecipitation Buffer containing magnetic beads conjugated with human anti-pan-Ago antibody or negative control normal mouse IgG (provided in the kit) and rotated overnight at 4 °C. Samples were washed 7 times with 1˟ Wash Buffer. The samples were then incubated with Proteinase K buffer at 55°C for 30 min with shaking to digest the protein. Co-immunoprecipitated RNA including miRNA:mRNA complexes were subjected to qRT-PCR analysis. According to the manufacturer’s protocol, the enrichment of miRNA was calculated as follows: Fold Enrichment = AE (Neg IgG CT–Ago CT), where AE = Amplification Efficiency = 10(-1/slope)=10(-1/s-3.508). Representative bar diagram from three independent experiments, each set of experiment was done in triplicates.
Gut lamina propria lymphocytes (LPLs) isolation
The intestines were opened longitudinally and cut into 0.5cm sections, shook twice with HBSS containing 10mM HEPES, 25mM NaHCO3,1mM DTT, and 1mM EDTA (all from Sigma-Aldrich), and 2% fetal bovine serum (Gibco, Portland, OR) at 37℃for 20 min. IECs were then washed using HBSS to remove away. For the isolation of LPLs, intestinal pieces were digested for 40 min with complete RPMI-1640 containing 1mg/ml collagenase (RocheApplied Science, Upper Bavaria, Germany), 40ul/ml dispase (Sigma-Aldrich), and 4ul/ml DNase I (Sigma-Aldrich) at 37 C. The samples were then passed through a 70 µm cell strainer (BD Biosciences, Franklin Lakes, NJ, USA), and the resulting cell suspension was centrifuged at 500g for 5 min, and subsequently resuspended in 1˟ PBS.
Flow cytometry and antibodies.
The anti-mouse antibodies F4/80-PE, CD11b-FITC, and their respective fluorochrome-conjugated isotypes were purchased from BD Biosciences (San Jose, CA). All of the antibodies were used according to the manufacturer's instructions. Cells were acquired on a BD FACS CANTO II flow cytometer (BD Biosciences, San Diego, CA) and data were analyzed using FlowJo software (Tree Star, Ashland, OR).
Enzyme-linked immunosorbent assay
The mouse serum protein levels of IL-1β and IL-6 were measured at the 0th, 2nd, 6th, 10th, and 18th week using Sandwich ELISA kits (4A Biotech, Beijing, China) According to the manufacturer’s instructions.
Statistics
Data were presented as mean ± standard error of the mean (SEM) or mean ± standard error of at least three independent experiments. Graphical analyses, statistical analysis, and nonlinear regression analysis of the data were performed using GraphPad Prism Software (La Jolla, CA, USA). Differences between groups were determined using 1-way analysis of variance (ANOVA), 2-way ANOVA, or unpaired Student’s 2-tailed t-test. P-value of <0.05 was considered statistically significant.