Data collection
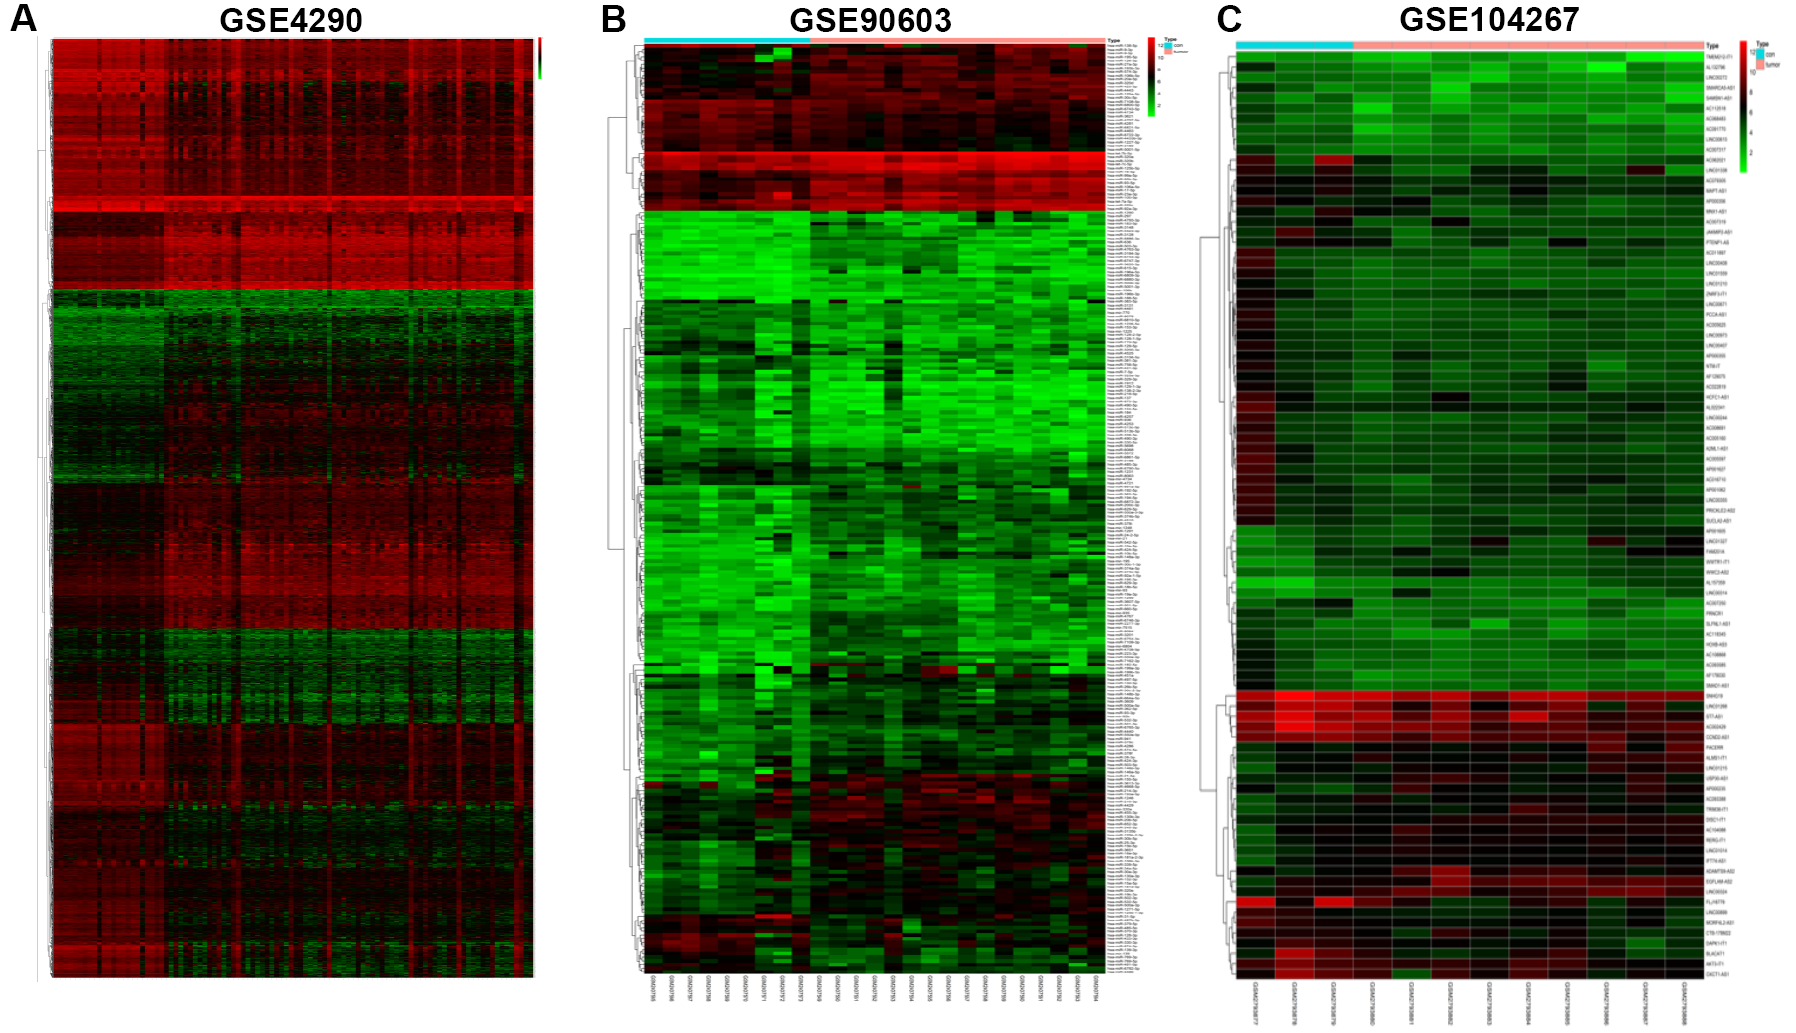
Series matrix files of GSE4290 dataset which contained mRNA microarray data of 23 epileptic tissues and 81 GBM [18], GSE90603 dataset which contained miRNA microarray data of 16 fresh-frozen GBM multiforme samples and 7 healthy brain tissues and GSE104267 dataset which contained mRNA microarray data of 9 tumors and 3 healthy tissues were downloaded from the GEO database (https://www.ncbi.nlm.nih.gov/geo/) [19]. All 26 glioma specimens and paired non-tumorous tissues used in this study were collected from glioma patients who underwent the surgical reactions. All the GBM samples were immediately frozen in liquid nitrogen until RNA was extracted.
ceRNA network construction
The differently expressed mRNAs (DEmRNAs), differently expressed lncRNAs (DElncRNAs), and differently expressed miRNAs (DEmiRNAs) in the GSE4290, GSE90603 and GSE104267 datasets were identified by the limma package in R [20]. Differential expression analyses have been carried out with limma setting the FDR threshold to 0.05 and FC lower threshold |log(FC)|≥1. We used online tools (http://bioinfogp.cnb.csic.es/tools/venny/) to conduct integrated bioinformatical analyses [21, 22]. MiRcode database (http://www.mircode.org) was used to define the relationships between the DElncRNAs and DEmiRNAs. Target genes were predicted by the miRTarBase, TargetScan, and miRDB. DElncRNA‐DEmiRNA‐DEmRNA network was constructed by Cytoscape (version3.6.1) [23].
Functional annotation and pathway analysis
We conducted Gene Ontology (GO) enrichment and Kyoto Encyclopedia of Genes and Genome (KEGG) pathway analyses for the mRNAs involved in the constructed lncRNA related network using the R package “clusterprofiler”, with a set of cut‐off criteria at P <0.05 [24]. The online database Retrieval of Interacting Gene (STRING) was used to construct Protein‐protein interaction (PPI) network [25]. DEmRNAs were incorporated into the PPI network when have a combined score greater than 0.4 [26].
Cell lines and cell culture
All human GBM cell lines (A172, LN229, U87, U251, U373) and normal human astrocyte cell line (NHA) were obtained from the China Infrastructure of Cell Line Resource. Cells were cultured and preserved in DMEM (GIBCO‐BRL), which was mixed with 10% FBS, 100 U/mL penicillin and 100 mg/mL streptomycin in a moist air at 37°C with 5% CO2.
Cell transfection
OXCT1-AS1 inhibitor shRNA and an empty vector were commercially synthesized by General Biology (Anhui, China). The plasmids were transfected at concentration of 2.5μg/well in a 6 well plate. All transfections were finished by using Lipofectamine 2000 (Invitrogen, Carlsbad, CA, USA). The transfection efficiency was assessed by qRT‐PCR analysis. Subsequent experiments were performed at 48 h post transfection.
qRT‐PCR analysis
Total RNA was extracted from the glioma tissues and cell lines using TRIzol reagent (Ambion, Life Technologies, USA). Reverse transcription was actualized by using a First Strand cDNA Synthesis Kit (TOYOBO Life Science, Shanghai, China). Then, the qRT‐PCR analyses were detected using the Universal SYBR‐Green Master (Roche, Germany). GAPDH was used as endogenous controls for lncRNAs and mRNAs. U6 was used as endogenous controls for miRNAs. The 2− ▵▵Ct method was used for analyzing results.
Cell proliferation assay
The transfection cells were cultured in the 96 well plate at a concentration of 1 × 10⁴ per well and incubated for 24, 48, and 72hr. Cell proliferation was assayed by Cell Counting Kit 8 (CCK‐8, MedChem Express, China) according to the manufacturer’s protocol.
Clone formation assay
A density of 5 × 10³ cells was planted into 96 well plates. After 24h of transfection with the sh-OXCT1-AS1 and empty vector, cells were seeded into a six well plates (500 per well) and cultured for two weeks. Then, 0.1% crystal violet was used to stain clones, and cells were photographed using a ChemiDocTM MP system (Bio-Rad, USA). The number of colonies was counted using ImageJ.
Cell immunofluorescence staining
After transfection, cells were fixed with 4% paraformaldehyde, permeabilized with Triton X-100 and blocked with 5% bovine serum albumin (BSA, BOSTER, AR0004). Then, cells were incubated with the Ki-67 primary antibody overnight at 4 °C and followed by Alexa Flour 594 AffiniPure goat anti-rabbit IgG (ZSGB-BIO, ZF-0516) as well as DAPI (Beyotime, C1005). The results were determined by the fluorescence microscope in the next day.
Flow cytometry analysis of cell cycling
After transfection, cells were harvested and stained with a CycleTESTTM PLUS DNA Reagent Kit (BD Biosciences). Then, samples were measured by an Accuri C5 flow cytometer (BD Bioscience). The cell cycle results elucidate the exact distribution of the cells in the G0-G1, S, and G2-M phases.
Western blot
The total cell protein was lysed by RIPA buffer (Beyotime Institute of Biotechnology, Beijing, China) with protease and phosphatase inhibitors. The equal amounts of lysates were separated by 12.5% SDS-PAGE gels and transferred to PVDF membranes (Millipore, Billerica, MA). After blocking in 5% skim milk with TBST and incubated with primary antibodies overnight at 4 °C. The membranes were incubated with secondary antibodies at room temperature for 1h. The protein bands were visualized by ChemiDocTM MP System.
Transwell assay
The 8μm transwell chambers (Corning Company, NY) were used for conducting migration assays. After transfection, cells were planted into the upper chambers (1 × 10⁵ cells/well) and cultured for 24 hr. The chamber was fixed with 4% paraformaldehyde and stained with 0.1% crystal violet for 20~30min. After washing out the crystal violet, stained cells were counted under a microscope. 100μl of Matrigel (BD science, MA) was added into the upper chambers and performed as previously described to detect the cell invasive ability.
Luciferase reporter assay
The fragment of OXCT1-AS1 and CDC25A 3’UTR containing miR‐195 binding sites were amplified and cloned to the psiCheck2 reporter vector (Promega, Shanghai, China). Then, HEK293 cells were co-transfected with reporter vector and miR‐195 mimics for 48hr. Luciferase activity was measured using Dual Luciferase Reporter Assay (Promega), normalizing firefly (experimental group) luciferase to renilla (control group) activity.
In vivo tumor formation assay
Four weeks old BALB/C nude mice (15-20g) were obtained from the Vital River Animal Center (Beijing, China) randomly divided into two groups. Mice anesthetized with isoflurane were placed in a stereotaxic frame and the skull was exposed for intracranial injections or infusions. After stably transfected with the empty vector or shRNA, LN229 cells were collected and 5×10⁶ resuspended cells were used for each intracranial injection. Magnetic resonance imaging was performed to evaluate the intracranial lesions after the vaccinations every 15 days. Tumor volume was assessed and calculated (volume=(width)2 × (length)/2) every 3 days. The survival time of the mice was recorded and Kaplan-Meier survival curves were plotted for each group.
Immunohistochemistry
Formalin fixed tumor tissues were embedded in paraffin and sliced into 5 μm thick sections. After blocking with 5% BSA, sections were incubated with the CDC25A primary antibody (1:500, Affinity Biosciences, USA) at 4 °C overnight and secondary antibodies at 37°C for 30min. Then, samples were visualized by using the diaminobenzidine (DAB) substrate kit for 10 min. After intensive washing, samples were counterstained with hematoxylin, dehydrated and coverslipped.
Statistical analysis
Data from three independents experiments were shown as the means ± standard deviations (SD). Two groups statistical analysis was performed using Student’s t test (two-tailed). For multiple groups statistical analysis, we used one-way ANOVA with SPSS 19.0 (IBM, USA). P-value< 0.05 was considered statistically significant.