Sources of Database
The field study is carried out in the month of October 2021 in Rupai river basin. Collection of primary data involves measurements of gullies. Total station survey (Geomax ZT-20) is done to make long and cross profiles. Handheld Global Positioning System (GPS) of Garmin eTrex-20 is used to precisely locate the sites of investigation. A total number of eleven sites are visited after carefully observing different temporal images of the basin from Google Earth Pro software. During the field study, it is found that three sites are more susceptible to gully erosion. Hence, all the measurements are done in those sites only. To have the proper knowledge regarding soil erosion and gully formation, it is important to obtain other relevant data which only can be obtained from secondary sources. Understanding and assessment of soil erosion and gully formation requires basic information on a number of factors (Valentin et al. 2005; Conforti et al. 2011; Arabamari et al. 2018). Parameters in the process of gully erosion are not same for all regions (Arabamari et al. 2018), and needs attention in the selection of parameters emphasizing on local influential factors. In this present study, a number total number of ten factors, such as geomorphology, slope, land use and land cover (LULC), soil, Stream Power Index (SPI), curvature, lithology, elevation, drainage density and Topographical Wetness Index (TWI) have been taken into account to perform the study of Gully Erosion Susceptibility Mapping (GESM). Data required on these factors are obtained from several national and international sources, such as Digital Elevation Model (DEM) of Shuttle Radar Topography Mission (SRTM) downloaded from http:/earthexpolrer.usgs.gov (spatial resolution of 1-arc second) acquired on 23rd September 2014; Landsat-8 Operational Land Imager (OLI) satellite image downloaded from https:/earthexplorer.usgs.gov (30 m spatial resolution) obtained on 2nd April 2019; geomorphological map on a 1:250000 scale of Geological Survey of India (GSI); soil map on a 1:250000 scale of National Bureau of Soil Survey and Land Use Planning (NBSS&LUP) of India to make individual thematic layer of all selected parameters. In order to process, analyse and prepare the different thematic maps, ArcGIS 10.3.1 and Erdas Imagine 2014 RS and GIS software are used.
Thematic Layers and Its Preparation
While preparing the thematic layers, maps are properly geo-coded following the Universal Transverse Mercator (UTM) projection, world geodetic survey (WGS-84) and 45 N zone. The delineation of Rupai drainage basin and preparation of drainage density layer is mapped from SRTM-DEM in ArcGIS software adopting hydrology tool of spatial analyst. To produce elevation, slope, curvature, SPI and TWI thematic layers, the SRTM-DEM is also considered and processed and analysed in ArcGIS software using surface tool of spatial analyst. On the contrary, the thematic layers of geomorphology, lithology and soil of the study of interest are reproduced extracting them from the maps of GSI and NBSS&LUP employing editor tool of ArcGIS software. The LULC map is prepared classifying the OLI image in different LULC types in Erdas Imagine software adopting maximum likelihood algorithm of supervised classification.
AHP Model and Its Application
The application of Multi-Criterion Decision Analysis (MCDA) is used successfully in various disciplines for years (Schmoldt 2011; Guaita-Martínez et al. 2019; Ghosh et al. 2020a; Salabun 2020; Karmakar et al. 2021). The AHP model, developed by T. Saaty in 1980 (Ghosh et al. 2020a; Karmakar et al. 2021), is one of the popular and widely accepted methods in MCDA because of its multidimensional application in several fields in case of decision making (Akadiri and Olomolaiye 2012; Waris et al. 2019; Ghosh et al. 2020a; Karmakar et al. 2021), and the model can simplify the complexity of problems based on best possible opinions of experts (Punniyamoorty et al. 2012; Celik 2019; Ghosh et al. 2020a; Karmakar et al. 2021). The selected ten factors, which are mutually related to each other, responsible for gully erosion are analysed adopting AHP model to assign weight to each factor and their sub-classes depending upon the role of each factor in the process of gully erosion. To quantify weight numerically of any factor based on its relative importance in a whole event is most significant quality of AHP model (Waris et al. 2019; Ghosh et al. 2020a; Karmakar et al. 2021). The Consistency Index (CI), an important aspect of AHP, facilitates to validate the judgement score assigned by decision makers (Saaty and Vargas 1982; Ghosh et al. 2020a). There are four steps involved to run the AHP model, such as assigning weight, pair-wise comparison matrix, weight normalization and consistency assessment (Benjmel et al. 2020; Ghosh et al. 2020a). The selected ten parameters are first arranged in hierarchical order considering priorities to assign weight based on nine point scale (Table 1) devised by Saaty in 1980, and each point of the scale defines some specific importance (Saaty 1990). The process of weight assignment is conducted based on literature review and proper field investigation (Ghosh et al. 2020a; Karmakar et al. 2021). In second step to compare all the factors with each other, a pair-wise comparison matrix (W) is done (equation 1). To obtain the normalization of weight (Wij) from matrix table (Table 2), the equation 2 is employed following the eigen vector technique of Saaty (Neissi et al. 2020; Ghosh et al. 2020a; Karmakar et al. 2021), and p represents geometric mean of ith factor.
$$W=\left|\begin{array}{c}\begin{array}{ccc}{f}_{13}& {f}_{14}\dots & {f}_{1n}\\ {f}_{23}& {f}_{24}\dots & {f}_{2n}\\ {f}_{n1}& {f}_{n2}\dots & {f}_{nn}\end{array}\end{array}\right|$$
1
$${W}_{ij }= \frac{p}{\sum p}$$
2
To verify the judgement coherence, the Consistency Ratio (CR) is developed (equation 3), and it is derived dividing CI from Random Consistency Index (RCI). In order to allow the judgement value, the CR value required to be less than 0.1, else new comparison matrix needs to be computed assigning fresh judgement values to all factors till the CR value does not reach to less than 0.1 (Ghosh et al. 2020; Karmakar et al. 2021). The mathematical expression used in calculating CI is denoted by equation 4. Here, n depicts number of factors taken into consideration, and λmax describes principal eigen value (Saaty 1990).
CI \(=\frac{(\lambda max-n)}{n-1}\) (4)
Computation of Gully Erosion Susceptibility Zone Index and Accuracy Assessment
The computation of Gully Erosion Susceptibility Zone Index (GESZI) is performed taking in to account all the thematic layers of ten factors and this done by map algebra tool of in ArcGIS software using weighted linear combination method. Following equation (5) is adopted to calculate GESZI. Here, fw refers weight of each factor and fr denotes rank of sub-classes. The final output of Gully Erosion Susceptible Zone (GESZ) is generated from ArcGIS software involving all the parameters. The value of GESZI is dimensionless and derived GESZI values are categorized into five distinct classes, namely: very low, low, moderate, high and very high following natural break classification system of ArcGIS software. To validate the map of GESZ, the overall all accuracy assessment is carried out in conformity of the studies areas. Finally, a flow chart is prepared to portray the details of methodology (Fig. 2).
GESZI =\({\sum }_{i}^{n}{ (f}_{w}\times {f}_{r})\) (5)
Table 1 is near here
Table 2 is near here
Table 3 is near here
Figure 2 is near here
Description of Factors of Soil Erosion and Gully Formation
Geomorphology
Geomorphology is the study of landforms including its evolution, classification and several geomorphic processes acting upon them (Summerfield 1991; Huggett 2007; Karmakar 2021). Understanding of geomorphology helps to assess the landscape more precisely (Murmu et al. 2019; Karmakar et al. 2021). Geomorphologically the Rupai basin area can be divided into six sub-classes based on existing landforms (Fig. 3). The north, west and south western portions of the river basin are characterized by pediplain (36.64%) followed by dissected hills and valleys (30.36%) and pediment (24.26%). The rest of the landforms do not significantly dominate in the river basin. Among the sub-classes of geomorphology, the dissected hills and valleys obtain highest weight (0.286) followed by residual hill (0.238) and pediment (0.19), while valley fill secures lowest weight of 0.048 due to its lower level of elevation compared to other landforms of in the study area (Table 3). Dandapat et al. (2020) observed almost same situation in case of Dulung river basin of west Bengal.
Figure 3 is near here
Slope
In the process of soil erosion in the form of rills and gullies, slope plays a crucial role. Slope simply may defined as the variation of elevation on topography in a certain space (Yeh et al. 2016; Guru et al. 2017; Ghosh et al. 2020a, b). There is an inverse relation of degree of slope with infiltration rate and directly proportional to surface run-off (Siva et al. 2017; Karmakar et al. 2021). Higher degree of slope augments the soil erosion in the form of rill and gully (Conforti et al. 2011). The study area exhibits undulating topography with varying degree of slopes. The general geological slope of the basin is west to east and south-east ward (Fig. 4). Most of the basin area (71.87%) is experienced low degree of slope (i.e. less than 3 degree) and extended predominantly north, west and south-west portion of the basin. The moderate degree of slope (3-9 degree) covers an area of 15.58%. An area of 12.55% belongs to high to very high degree of slope. Higher degree of slope is found mainly at eastern and south-eastern portions. There are some residual hills situated in the basin, namely: Lagamburu, Jajahatu and Gajaburu (Jhalda-I), and Bansa and Shikra (Jhalda-II), which are also seen in the same directions. The weight value for sub-categories ranges in between 0.18 to 0.21 (Table 3). Different studies revealed that higher degree of slope increases the surface run-off with higher velocities and results in disintegration of soil particles and its transportation (Conforti et al. 2011; Zabihi et al. 2017; Yang et al. 2021; Dandapat et al. 2020). This situation gets worsened in absence of vegetation cover (Yang et al. 2021).
Figure 4 is near here
Land Use and Land Cover
The LULC plays a significant role in the process of gully erosion (Conforti et al. 2011; Yang et al. 2021). A number of variables, such as run-off rate, infiltration, surface water, soil moisture and water holding capacity etc., are influenced by LULC (Singh et al. 2018; Ghosh et al. 2020a; Karmakar et al. 2021). The presence of vegetation cover significantly decreases the erosive action of surface run-off and gully erosion susceptibility (Conforti et al. 2011). The study area mostly possesses fallow land (36.45%) followed by vegetation cover (33.48%). Hilly surface with dense forest is computed to be 18.67%. The lowest proportion of basin (1.34%) is covered by built up are and others (Table 3). Vegetation cover and hilly surface with dense forest dominate eastern and south-eastern portion of the river basin, while fallow land and agricultural fallow land are observed in western and middle portion of the basin (Fig. 5). The higher weight value is obtained by fallow land, agricultural fallow land and built up area (Table 3). It is mentioned by several researchers that fallow lands (Conforti et al. 2011), agricultural fallow lands (Dandapat et al. 2020) and range area (Arabameri et al. 2018). It is evident that open spaces with steepness are more susceptible to gully erosion.
Figure 5 is near here
Soil
The physical properties of soil highly influence the rate of surface run-off, infiltration capacity, resistivity to soil erosion as well initiation of gully formation. Soil texture is a function of sub-surface flow and piping, and the formation of gullies starts when the top of the pipes falls down (Igwe et al. 2020). The study of interest mainly forms four consecutively four distinct soil group from west to east (Fig. 6). Fine soil mainly dominates (40.49%), while gravelly loamy extends around 4.19%. The rest of the proportion is covered by fine loamy to fine loamy - coarse loamy (Table 3). Fine soil is mainly susceptible to erosion (Dandapat et al. 2020) and it is also reflected by the weight value of sub-classes of soil (Table 3).
Figure 6 is near here
Stream Power Index
It is a measure to understand the erosive power of surface water flow considering the simple assumption that the discharge is proportional to the specified catchment area. This measure is important because river incision and slope toe erosion are directly influenced by the power of running water (Conforti et al. 2011). Around 78% of the basin area comes under the category of -0.04 to 0.0, where -0.21 to -0.04 and 0.0 to -0.02 sub-classes share around 9% area by each of them. The lowest value (0.67%) belongs to 0.05 to 0.18 (Table 3). Broadly, the basin is divided into, west and certain portion of east (Fig. 7). The areas with high SPI may experience greater possibility of erosion (Conforti et al. 2011; Arabameri et al. 2018).
Figure 7 is near here
Curvature
The bend of topographic surface from a horizontal plain is termed as curvature. Based on the shape of bends of topographic surface, the convex profile is referred when it is curved upward and concave while it is curved downward (Conforti et al. 2011; Karmakar et al. 2021). A significant proportion of the basin (47.82%) is flat followed by concavity of topography (36.64%). The share of convex curvature is observed to be 17.54% (Table 3), and it is found west and south-western directions due to presence residual hills and pediments (Fig. 8). The study of curvature helps to realize gully initiation and development. The presence of higher amount of concave curvature expedites the process of gully erosion (Conforti et al. 2011; Zabihi et al. 2017).
Figure 8 is near here
Lithology
The occurrence of gully significantly depends on lithological properties. The geological map gives impression of underlying lithology (Igwe et al. 2020). The river basin owns different types of rocks of different geological formations from Proterozoic to Quaternary (Karmakar et al. 2021). The dominating rocks are found here (72.10%) granite gneiss followed by biotite gneiss and granite. Unclassified soil and alluvium account for 2.50% (Table 3). The map of the basin shows that granite and gneiss spread from west and north to east direction (Fig. 9). Unconsolidated and well exposed materials are suitable for gully formation (Conforti et al. 2011). The presence of unclassified soil and alluvium of quaternary and recent deposits are highly susceptible to gully erosion.
Figure 9 is near here
Elevation
The river basin is situated at CGGS, a hard rock plateau region, and elevation map depicts moderately spacing contour due to presence of several residual hills (Fig. 10). The highest share of the basin (35.43%) belongs to the range of elevation of 228 to 268 m followed by 181 to 228 m (31.71%), while around 16% area comes under 326 to 645 m elevation. The study reveals that moderate to high elevated areas are more prone to erosion (Table 3). Several other works also pointed out in this regard (Arabameri et al. 2018; Yang et al. 2021).
Figure 10 is near here
Drainage Density
Within a unit of area, the total length of streams is known as drainage density. It is also referred as closeness of stream spacing and influenced by a number of variables, such as slope, lithology, soil, vegetation cover, rainfall etc., (Ghosh et al. 2020a; Karmakar et al. 2021). This indicator influences soil, rill and gully erosion (Dandapat et al. 2020). The higher drainage density is observed towards higher elevated and sloping areas (Fig. 11) and ranges from 0.47 to 0.89 (31.30%) and 0.89 to 1.31 (29.85%) followed by 1.31 to 1.74 (Table 3). The weight value enhances with increasing drainage density (Dandapat et al. 2020; Yang et al. 2021).
Figure 11 is near here
Topographic Wetness Index
This is a measure to perceive the topographical control over hydrological process (Igwe et al. 2020). It is calculated taking into account the possibility of storing of water in a certain area of the basin with the probability of moving of water following the gravity (Karmakar et al. 2021). The higher value of TWI indicates greater risk of susceptibility of soil erosion and subsequent formation of related landforms. It is also documented by Conforti et al. (2010), Arabameri et al. (2018) and Igwe et al. (2020). The lower basin area (14.82%) lies in between the range of 11.76 to 22.28. The study finds relatively low importance of TWI (Table 3). Areas belonging to east to west experience lower TWI (Fig. 12).
Figure 12 is near here
Gully Erosion Susceptibility Zone
The integration of geospatial techniques and AHP model employing all the ten selected factors facilitates to generate the GESZM of Rupai river basin. The GESZ is classified in five distinct classes adopting natural break classification system of ArcGIS software (Table 4). The area falls under low to moderate group of GESZ is 51.71% based on dimensionless value of GESZ. Very low GESZ is found to be 19.72%. On the contrary, the values of high and very high GESZ are 19.88% and 8.68% respectively. High to very high GESZ is observed scattered way in some portion of middle of the basin and west to south-west margin (Fig. 13).
Table 4 is near here
Figure 13 is near here
Accuracy Assessment of Gully Erosion Susceptibility Zone Map
To know reliability of the derived GESZ based on GESZ map, the accuracy assessment is a prerequisite condition towards the validation of the model. In order to do the same, a total number of eleven sites are visited to investigate the ground truth reality based on available literatures and observation of Google Earth Pro software for selection of suitable sites across the entire basin (Fig. 14). The Keyhole Markup Language (KML) file is prepared in Google Earth Pro and overlaid on GESZ map. The overlaid sites of investigated are now distributed on GESZ map, and found the frequency of site numbers locating in different classes of GESZ. The total sites of investigation with susceptibility to gully erosion moderate to very high is now summed up and divided from total number of sites. The derived result is multiplied by hundred. Finally, the level of accuracy assessment is computed to be 72.72% (Table 5), which is very high and advocates for the derived GESZ map.
Table 4 is near here
Figure 14 is near here
Estimation of Gully Erosion
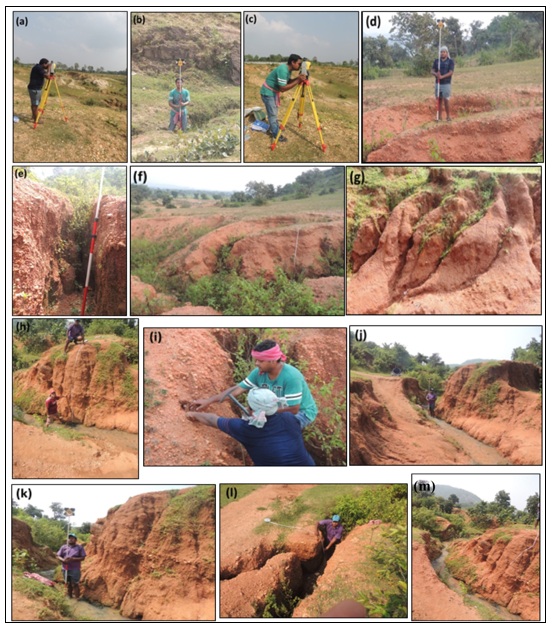
The total loss of soil from the three studied gullies is estimated using the simple calculation. These three gully sites of the river basin are namely: Kutidih (23° 20′ 32.92" N and 85° 56′ 21.17" E), Mahakudar (23° 20′ 27.39" N and 85° 56′ 28.43" E), and Kuki (23° 18′ 36.55" N and 85° 55′ 45.65" E). Total length, average width and depth of gullies (m) are computed to obtain the total volume of all gullies (Plate 1). The bulk density of laterite soil for Rarh Bengal is calculated by Ghosh et al. (2021b) as 2.205 gm cm-3 up to 1.45 m depth. Now, the volume of gully is multiplied by average bulk density of laterite. The estimated value of the weight of eroded materials from gullies of Kutidih, Mahakudar and Kuki are calculated to be 6.09 tonne, 40.96 tonne and 1.40 tonne respectively.
Plate 1 is near here