Animals and Ethical statement
Neonatal C57BL/6 mice were purchased from Shanghai Laboratory Animal Center (Chinese Academy of Sciences, Shanghai, China). All experimental operations were in accordance with guidelines for laboratory animal care and safety from NIH, and approved by the Animal Care and Use Committee of Zhejiang University. All animals were housed with free access to water and chow in appropriate environmental conditions (temperature: 22-25℃, humidity: 45-50%, and 12 h light/dark cycle).
Experiment grouping and treatment
All animals were randomly assigned to different groups according to the experimental protocols: Part1) control group (Ctrl) and sevoflurane group (SEV); Part2) GFP-Ctrl group, GFP-SEV group, GFP-Egr2 shRNA-Ctrl group, GFP-Egr2 shRNA-SEV group; Part3) Ctrl group, SEV group, DFP group and SEV+DFP group. To induce general anesthesia, the pups were placed in an acrylic anesthetizing chamber with two interfaces including sevoflurane vaporizer and multi-gas monitor. The SEV group was exposed to 3% sevoflurane delivered in humidified 60% O2 carrier gas for 2 h (2 L/min fresh gas for 3 min, followed by 1 L/min) by using the Datex-Ohmeda anesthesia system (Madison, WI, USA), while the Ctrl group received 60% oxygen (balanced with nitrogen) for the same period at postnatal day 6-8 (P6-8) [9]. Similarly, GFP-Ctrl group and GFP-Egr2 shRNA-Ctrl group received the same process with Ctrl group, and the GFP-SEV and GFP-Egr2 shRNA-SEV group underwent the scheme with SEV group. Moreover, to ensure sufficient ventilation, a single sample (100 μL) of arterial blood was obtained at the end of sevoflurane anesthesia or sham exposure by cardiac puncture from five mice of each group. These animals were not used for any other part of the study. Arterial carbon dioxide partial pressure (PaCO2), arterial oxygen pressure (PaO2), blood oxygen saturation (SaO2) and power of hydrogen (pH) were evaluated by using a blood gas analyzer (Kent Scientific Corp., Torrington, CT, USA) (Table 1). There was no significant difference in pH, PaCO2, PaO2, Glucose and SaO2 level between the groups.
To downregulate Egr2 expression, transfection with adeno-associated virus was performed. Briefly, recombinant adeno-associated virus (AAV) was purchased from Vigene Biosciences company (Shangdong, China), which included either shRNA control (scrambled sequence) or Egr2 shRNA and enhanced green fluorescence protein (EGFP) gene. For Egr2 shRNA viral packaging, the shRNA sequence of mouse Egr2 (5'-GATCCGGGCAGGACAAAGCAATATTGTTCAAGAGACAATATTGCTTTGTCCTGCCCTTTTTTA-3') was synthesized and cloned into pAV-U6-GFP plasmid to produce pAV-U6-eGFP-Egr2 shRNA. Viral particles were purified by iodixanol step-gradient ultracentrifugation. The genomic titer was 4.72 × 10¹³ TU/mL determined by quantitative PCR. For viral injection, mice were anesthetized with ketamine (100 mg/kg) and xylazine (8 mg/kg) by intraperitoneal injection and placed in a stereotactic frame. Purified and concentrated lentivirus was injected bilaterally into the hippocampus (100 nL, coordinates from bregma, − 1.5 mm anterior/posterior, − 2.07 mm medial/lateral, −1.8 mm dorsal/ventral) through glass micropipettes at a slow rate (10 nL/min). The GFP-Ctrl group and GFP-SEV group received AAV9-U6-shRNA(scramble)-GFP virus at P9, and the GFP-Egr2 shRNA group and GFP-Egr2 shRNA SEV group received AAV9-U6-Egr2 shRNA-GFP virus at P9, respectively.
To inhibit the level of iron, Deferiprone (DFP), an iron chelating agent [21], was administrated to detect the impact of iron chelating agent in mice after sevoflurane treatment. The mice in DFP group and SEV+DFP group were given Deferiprone (DFP) (100 mg/kg in 1% DMSO, i.p.) at P9 and the mice in Ctrl group and SEV group were given 50 μL of 1% DMSO by intraperitoneal injection at P9, respectively.
Behavioral test
Morris water maze
After the sevoflurane exposure, the spatial memory abilities were evaluated at P40 by using the Morris Water Maze (MWM) test as previously described [24]. A circular black pool (diameter: 120 cm; depth: 21 cm) was filled with opaque water using black non-toxic ink to reach 1.0 cm above the platform surface (diameter, 10 cm), and the water temperature was kept at 22 °C. Meanwhile, an invisible platform (diameter, 10 cm) was fixed in the pool and submerged 1 cm. In the training phase (P40-44), all animals received four training trials per day for a total of four days. The mice were placed into the pool at a random starting position and allowed to discover the hidden platform for 120 s. Mice were guided to the platform if they could not locate the platform within 2 min. The latency time (the time to reach the hidden platform) was recorded for assessing the spatial learning. In the testing phase (P45), the platform was removed, and the mean distance crossed the original platform site, platform-crossing times, and time spent were recorded for measuring memory function, respectively. After each trial, the mice were wiped dry and a heat lamp was used to faster temperature recovering before returning to home cages.
Novel object recognition test
Cognition was measured by the Novel object recognition (NOR) experiment at P35.
The animals are exposed to two identical objects for 20 min, then trained for 5 min during the familiarization phase. Thereafter, the mice are exposed to a single copy of the familiar object and a novel object (test phase) after 24h. The total distance traveled was recorded and the Recognition index was calculated [25]: A recognition index was calculated for each animal and re-ported as the ratio TB/(TA + TB), where TA = time spent exploring the familiar object A and TB = time spent exploring the novel object B. Recognition memory was evaluated as in the long-term memory test. Exploration was defined as sniffing or touching the object with the nose or forepaws.
Trace fear conditioning
The fear condition test is extensively used to detect the tone’s effect on the hippocampus-dependent memory [26]. Briefly, the mice were placed in a sound attenuating fear-conditioning chamber (ACT-100A, Coulbourn Instrumnets, USA), The mice free explored for 2 min in the chamber, and the freezing was recorded as control. Then, the mice received 30s sound (80dB, 1500HZ) as conditioned stimulus, and foot shock (0.7 mA; 2 s) by the floor’s steel rods at last 2 s, and keep the sound and the shock stopped at the same time. The mice stayed in the chamber for another 2 min. The training repeated for 5 times. The next day for contextual fear test, the mice were placed into the same chamber and the freezing was recorded for 5 min. After 2h, the mice were placed into another chamber for 3 min, then received the same conditioned stimulus for 3 min. The freezing of mice was recorded all the time. The data of freezing were recorded by Freeze Frame software.
Tissue harvest
Animals were anesthetized with 2% pentobarbital sodium (40 mg/kg, i.p.) at P42. Then, the right atrium was incised and transcardiac perfusion was performed with heparinized 0.9% saline followed by 4% formaldehyde. The brain tissue was extracted and rinsed using 0.9% sodium chloride at 4 °C. The hippocampus was stripped and fixed in 30% sucrose in 0.1 M phosphate buffers (pH 7.4, 4 ℃) for 24-48h, then the specimens were stored in a −80 °C freezer.
TUNEL Assay
A TUNEL assay was performed to detect the DNA fragmentation caused by cell death in the hippocampus of aged rats. After preparation of sections (6 μm), the TUNEL staining was carried out using an in situ cell death detection kit (YEASEN, 40302ES20) according to the manufacturer instructions. Fluorescence signals were visualized under an epifluorescence microscope. Images were captured with the assistance of Image-Pro Plus 5.0 software, and all the parameters used in this experiment were kept consistent during capturing.
Immunofluorescent staining
Serial coronal slices (20 μm thick) of hippocampus including CA1, CA3 and DG regions were made by using a rotary microtome (Leica, Germany). The sections were placed in a water bath (96 °C, 20 minutes) for antigen retrieval and blocked using 10% bovine serum albumin at room temperature for 1 hour. The sections were incubated with antibody diluent containing goat antibodies against Tuj1 (1:500; Biolegnd, A488-435L), GFAP (1:100; ABclonal, A14673) and NeuN (1:1000; Abcam, ab104224) overnight at 4°C. Then sections were rinsed with PBS (3×10 min) followed by incubation with Alexa Fluor™ 488 goat anti-mouse antibody and Alexa Fluor™ 594 goat anti-rabbit antibody for 1 h at room temperature. After rinsing with PBS (6×5 min), fluorescence signals were visualized under an epifluorescence microscope. Images were captured with the assistance of Image-Pro Plus 5.0 software, and all the parameters used were kept consistent during capturing.
Golgi-Cox staining
The morphology of neuronal dendrites and dendritic spines was investigated in the hippocampus by using the Hito Golgi-Cox OptimStainTM PreKit (Hitobiotec Corp. Kingsport, TN, USA). The brain tissues were obtained after sacrifice, and rinsed with Milli Q water. The equal volumes of Solutions A and B were used to impregnate the brain tissues, and the impregnation solution was replaced the following day and stored in darkness (Room temperature, 2 weeks). Then, the brain tissues were transferred to Solution C, which was replaced the following day. The brains were stored at 4 °C for 72 h in the dark. The Brain sections (100 μm thickness) were generated using a cryotome with the chamber temperature set at −19 °C. Each section was mounted on gelatin-coated microscope slides using Solution C. Each section was mounted on gelatin-coated microscope slides using Solution C. The excess solution on slide was removed using a Pasteur pipette and absorbed with filter papers, then the sections were allowed to dry naturally at room temperature for 3 days. The dried brain sections were processed according to the manufacturer’s instructions. Thereafter, the dendrites of CA1 sub region in the hippocampus were observed by using an Olympus BX61 fluorescence microscope (Olympus, Japan).
RNA extraction
For the RNA-Seq analysis, the hippocampal tissues were obtained from Ctrl group and SEV group at P6 and P30, respectively. Total RNA was extracted from different group using RNAiso Plus Reagent (TaKaRa, Japan), and purified by RNasey Mini Kit (QIAGEN) based on the manufacturer’s protocol. NanoDrop spectrophotometry (Thermo Scientific, Wilmington, USA) was used to detect the RNA concentration, and the integrity was confirmed through electrophoresis. Subsequently, the cDNA synthesis and antisense RNA (aRNA) amplification was performed using Amino Allyl MessageAmp II aRNA Amplification Kit (Ambion, USA). The total RNA was stored at -80°C for future use.
RNA-Seq
A total of 1.5 μg RNA was used as the input material. The clustering of the index-coded samples was performed by using a TruSeq PE Cluster Kit v3-cBot-HS (Illumina) based on the manufacturer’s instructions. The library were sequenced using an Illumina HiSeq platform, and paired-end reads were generated followed by cluster generation. Thereafter, these raw reads in the fastq format were processed by using in-house Perl scripts. Low-quality data were discarded by using Trim Galore (http://www.bioinformatics.babraham.ac.uk/projects/trim_galore/). The GC-content and sequence duplication level of the clean reads were calculated, and the clean reads were assembled with Trinity software via the default parameters (https://github.com/trinityrnaseq/trinityrnaseq/wiki). Then, the RNA-seq data files were deposited in the NCBI Sequence Read Archive (SRA) database (SRA accession: Not uploaded, to date).
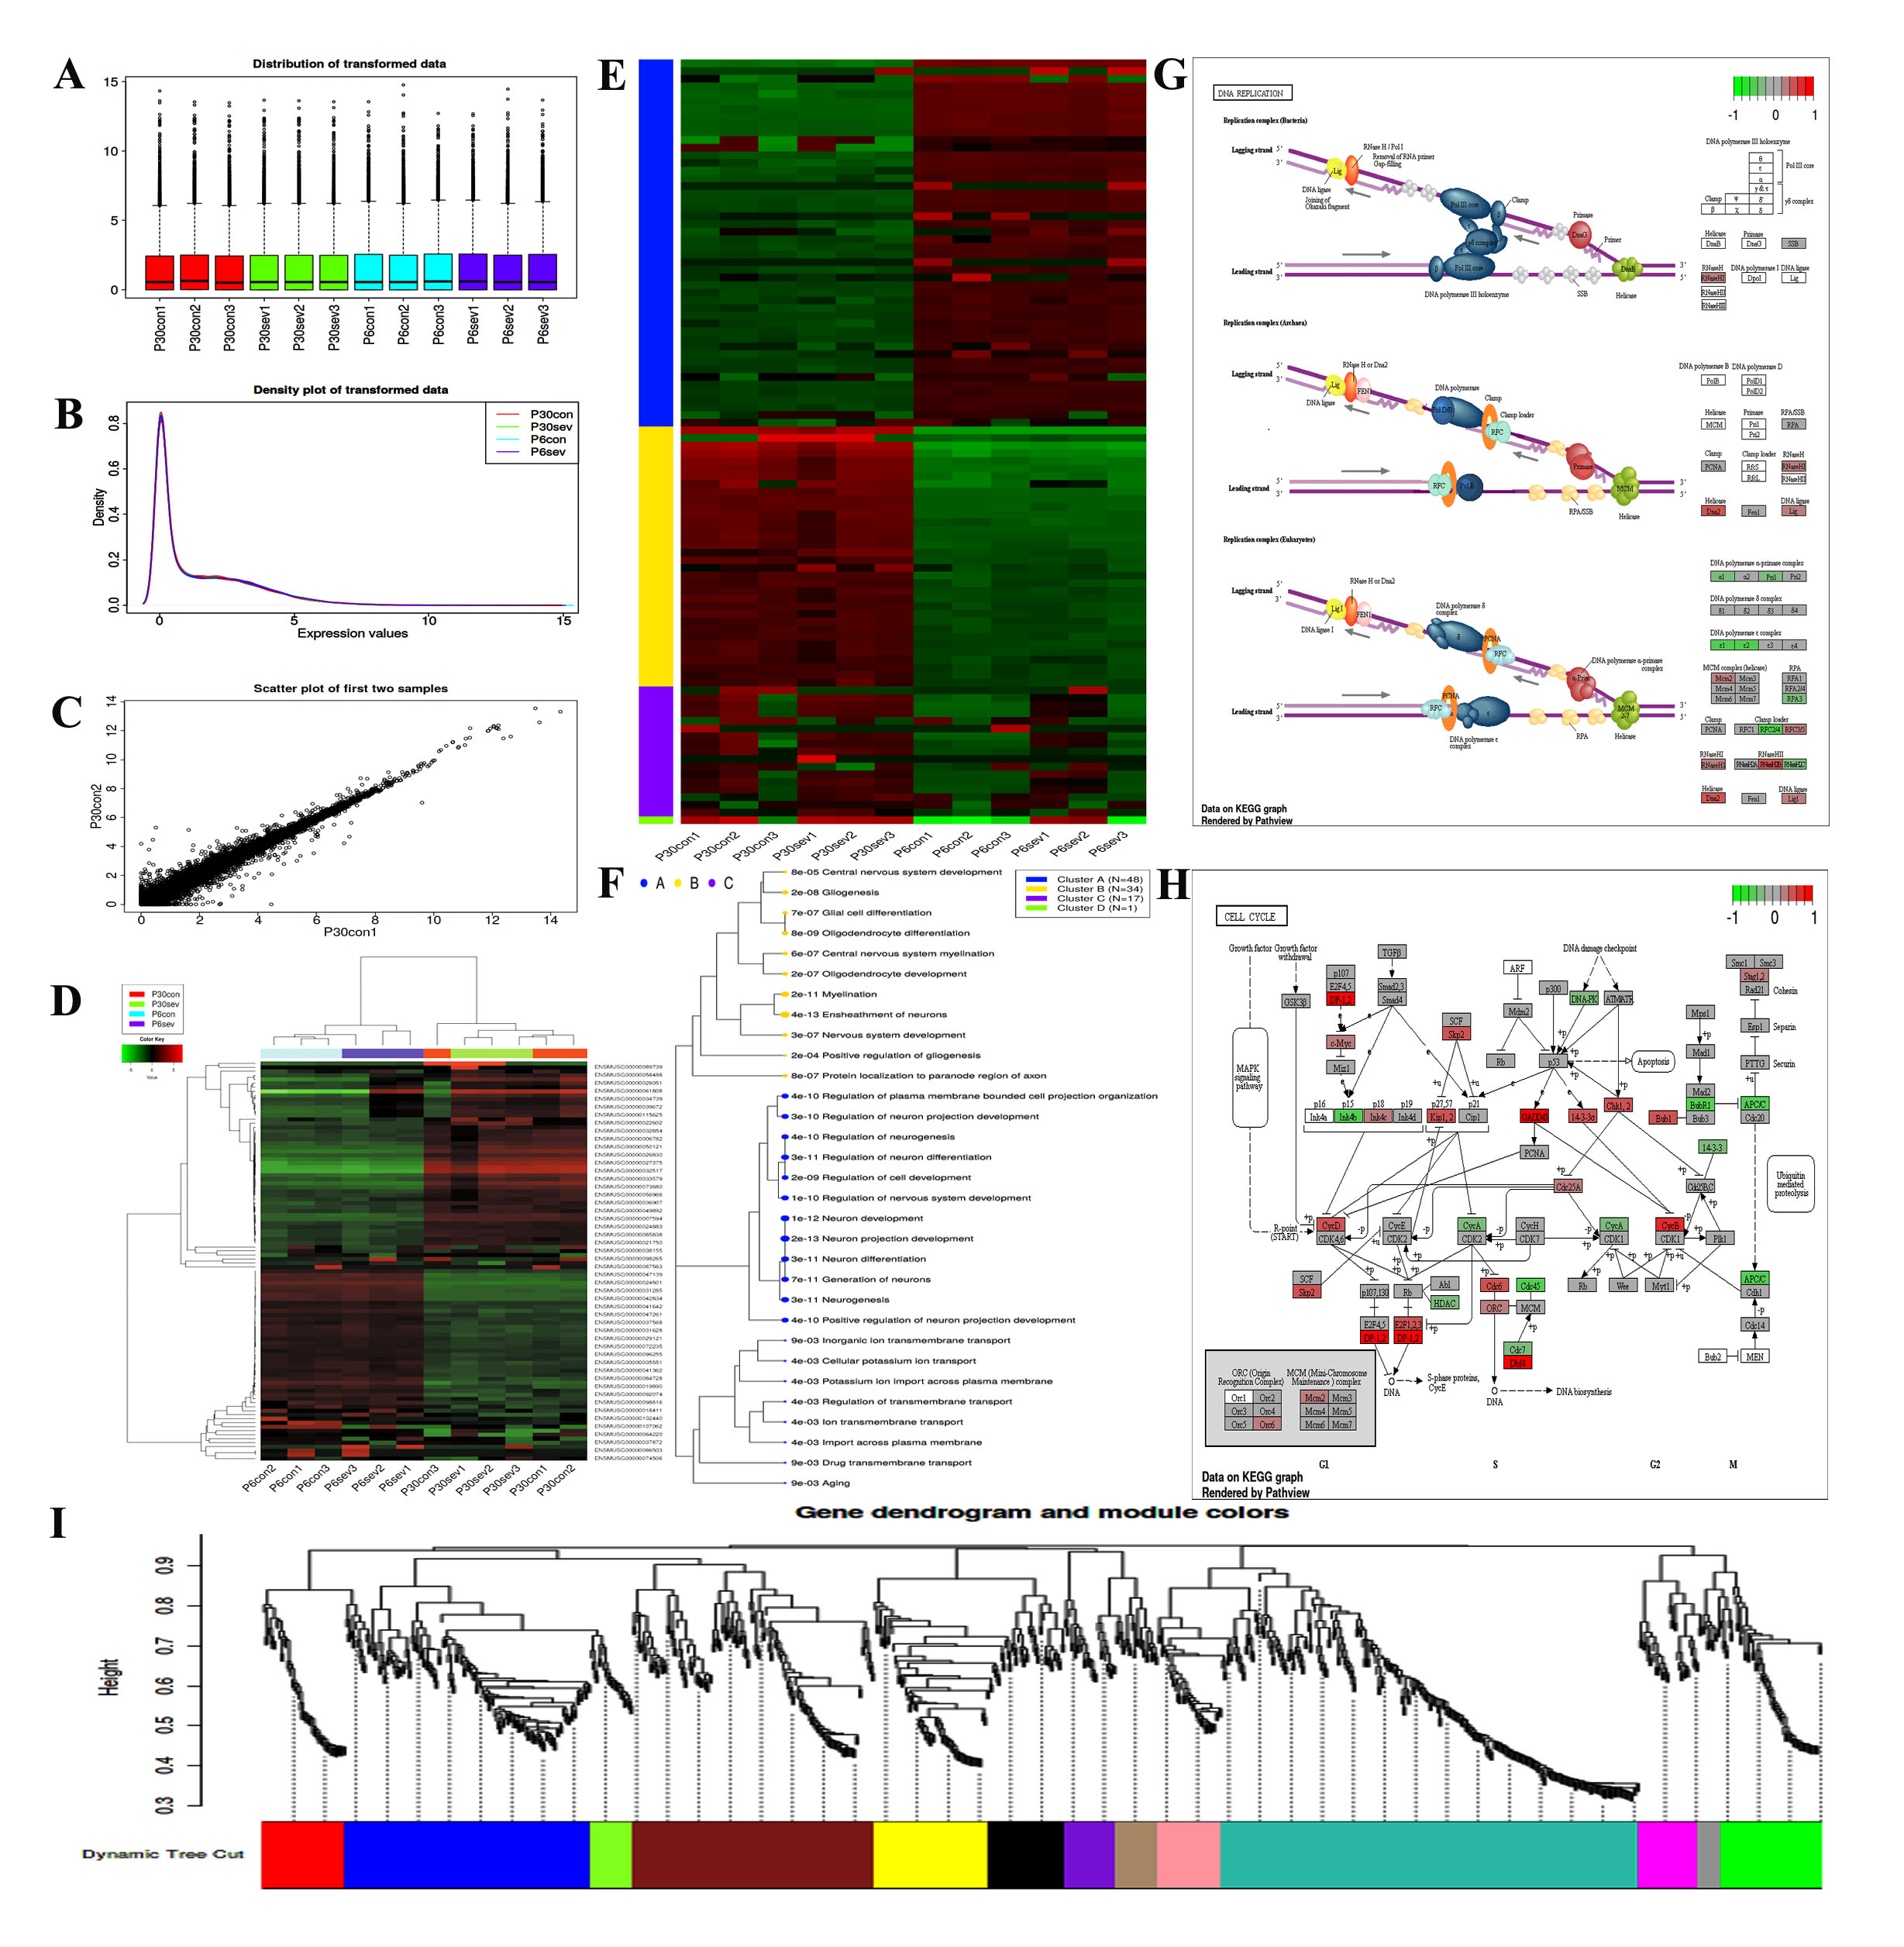
Data analysis by using integrated Differential Expression and Pathway analysis (iDEP) tools
The differentially expressed genes (DEGs) acquired from the RNA-seq-Based expression profiling were analyzed through iDEP (integrated Differential Expression and Pathway analysis) online tools (http://bioinformatics.sdstate.edu/idep/). To date, iDEP seamlessly connects 63 R/Bioconductor packages, 2 web services, and comprehensive annotation and pathway databases for 220 plant and animal species [27]. Briefly, the expression matrix of DEGs (Table S1 and Table S2) was filtered and converted to Ensemble gene IDs, and the exploratory data analysis (EDA) including K-means clustering and hierarchical clustering was performed using the pre-processed data. The pairwise comparison (Ctrl-6d group VS SEV-6d group; Ctrl-30d group VS SEV-30d group) was employed by using the DESeq2 package with a threshold of false discovery rate FDR < 0.05 and fold-change > 2. Additionally, a hierarchical clustering tree and network of enriched GO terms were constructed to visualize the potential connections among DEPs. Gene Set Enrichment Analysis (GSEA) method was used to investigate the related signal pathways activated by sevoflurane administration. Therefore, WGCNA was performed to construct co-expression networks and sub-modules, and the corresponding enriched pathways in selected module were exhibited, respectively.
Gene Ontology and KEGG Pathway Analysis of DEGs
Gene ontology (GO) analysis and Kyoto Encyclopedia of Genes and Genomes (KEGG) pathway were employed to analyze the differentially expressed genes (DGEs) between different groups (Ctrl-6d group VS SEV-6d group; Ctrl-30d group VS SEV-30d group) by using String online tools (https://string-db.org/cgi/input.pl). GO analysis was used to annotate genes and gene products including biological process (BP), cellular component (CC) and molecular function (MF). KEGG is utilized for systematic analysis of gene function and related high-level genome functional information of DGEs, which consists of a series of genome and enzymatic approaches and genomic information with higher order functional information [28].
Integration of Protein-Protein Interaction (PPI) Network Analysis and related database
STRING version 10.0 covers 9, 643, 763 proteins obtained from 2031 organisms [29]. The String database (https://string-db.org/cgi/input.pl) is used to predict the protein-protein interactions comprising direct/indirect associations. To investigate the potential relationships, String tool was constructed according to the function and pathway enrichment analysis. Moreover, the Genecards website (https://www.genecards.org) and The Human Protein Atlas database (https://www.proteinatlas.org/) were separately used to determine the expression of Egr2 in the tissues and organs of the human body.
Western blot
The hippocampal tissues, primary cultured neurons and cell lines among different groups were homogenized using RIPA buffer (Beyotime, P0013B) with 1 × protease inhibitor cocktail (Beyotime, P1010). The supernatant was collected by centrifugation (16, 200×g, 10 min), and the protein concentration was measured through a bicinchoninic acid protein assay kit (Beyotime, P0012S). An aliquot of 50 µg protein was separated via SDS-PAGE and transferred to a nitrocellulose membrane, then blocked with 5% nonfat milk in phosphate-buffered saline (PBS, pH 7.4). The membranes were incubated with primary antibodies against Egr2 (1:1, 000; ABclonal, A15053), ACSL4 (1:500; ABclonal, A16848), FTH1 (1:500; ABclonal, A19544), GPX4 (1:1, 000; abcam, ab125066), COX2 (1:1,000; ABclonal, A1253), DRP1 (1:500; ABclonal, A17069), DMT1 (1:500; ABclonal, A10231), Ferroportin-1 (1:1, 000; abcam, ab78066, actin (1:5, 000; ABclonal, AC026) at 4 °C overnight. Blots were incubated in horseradish peroxidase-conjugated secondary antibodies against rabbit IgG (1:5, 000, CST, 7071 and 7072) for 2 h at room temperature, then subjected to chemiluminescent detection using the SuperSignal West Pico Substrate (34077, Pierce) and exposed to film. Digital images were quantified using densitometric measurements obtained using Quantity One software (Bio-Rad).
Cell culture
Primary hippocampal neurons were cultured by using fetal mice (E17) hippocampi according to a previously described protocol [30]. Briefly, the mice pregnancy for 17 days was anesthetized through 1% isoflurane, and the uterus was exposed and the fetus was removed. The fetal mice were sacrificed and the hippocampi were obtained under a sterile environment. Then, the hippocampi were treated using 0.125% trypsin in Hank’s buffer (in mmol/L: 137 NaCl, 5.4 KCl, 0.4 KH2PO4, 0.34 Na2PO4·7H2O, 10 glucose and 10 HEPES) for 12 min at 37 °C and dissociated by repeated passage with Pasteur pipettes. The nerve cells (2 × 10⁵/cm2) were seeded onto poly-l-lysine (10 µg/mL)-coated plates added culture reagents including Neurobasal Medium (Invitrogen), 2% B27 (Invitrogen), 10 U/mL penicillin, 10 U/mL streptomycin, and 0.5 mmol/L glutamine. Hippocampal neurons were cultivated in appropriate environment (37 °C, 5% CO2). The cells were continuous cultured for 20 d, then harvested for subsequent experiments. Moreover, the cell lines consisting of H4 human neuroglioma were obtained from the China Center for Type Culture Collection. These cells were cultured using Dulbecco’s Modified Eagle’s Medium (DMEM) supplemented with 10% F12 (all from Gibco, Grand Island, NY, USA) and 10% heat-inactivated fetal bovine serum in a humidified incubator (37 °C, 5% CO2).
Sevoflurane treatment
The cultured cells were placed in an airtight plastic chamber (MIC-101), which was connected to an acrylic anesthetizing chamber with two interfaces including a sevoflurane vaporizer and a multi-gas monitor. The chamber was gassed with 4.1% sevoflurane in the carrier gas (95% air/5% CO2) for 15 min, and the concentration of sevoflurane was monitored by a gas monitor (PM 8060, Drager, Lübeck, Germany) [31]. Then, the chamber was sealed and incubated for 6 h at 37 °C. The gas was renewed every 3 h, and the concentration of sevoflurane was confirmed at the end of the incubation. Meanwhile, the control group received the same procedure with air containing 5% CO2.
Plasmid and transfection
pAU-U6-shRNA (Egr2) plasmid was purchased from Vigene Biosciences (Shandong, China). pAU-U6-shRNA (Egr2) plasmid used the shRNA sequence: GGGCAGGACAAAGCAATATTGTTCAAGAGACAATATTGCTTTGTCCTGCCCTTTTTT. The plasmids pAU-U6-shRNA (Egr2) was transfected into H4 cells using Lipofectamine 3000 reagent following the specific protocol for this cell line.
Iron Levels detection
Iron assay was performed according to the manufacturers’ protocol of Iron Assay Kit (Abcam, ab83366) [32]. Briefly, the specimens were incubated with iron reducer at 25 °C for 30 min followed by incubating for 60 min with iron probe at 25 °C. Then, the microplate reader (OD 593 nm) was used to detect the level of iron.
Lipid peroxidation assay
To detect the level of lipid peroxidation, the fluorescent reporter molecule C11-BODIPY581/591 (InvitrogenTM, D3861) was used. Cells were induced with the probes for 30 min (2.5 µM), and the fluorescence of C11-BODIPY581/591 shifted from red to green. The fluorescence spectrophotometer was utilized to monitor this kinetics of the reaction, and the fluorescence emission intensity at 520 nm was recorded. Images were captured with the assistance of Image-Pro Plus 5.0 software, and all the parameters used were kept consistent during capturing.
Detection of mitochondrial membrane potential and calcium level
Mitochondrial membrane potential was detected by using JC-1 (Thermo Fisher Scientific, MA, USA) fluorescent dye. H4 cells were randomly divided into four groups including Ctrl group, SEV group, Egr2 shRNA group and SEV+ Egr2 shRNA group, and these cells were cultured for 6 h. Then, 10 μM JC-1 reagent was added and stained for 20 min. JC-1 emits fluorescence including red fluorescent J-aggregates (530 nm excitation/590 nm emission) at high potentials, and green fluorescent J-monomers (490 nm excitation/530 nm emission) at low potentials. The cells were visualized immediately after treatment using an epifluorescence microscope. Images were captured with the assistance of Image-Pro Plus 5.0 software.
Additionally, the cytoplasmic calcium level was measured using Fluo calcium indicators (Fluo-4, AM, YEASEN, 40704ES50). An aliquot of DMSO stock solution (5 mM) was diluted to a final concentration of 5 µM in buffered physiological medium. H4 cells were washed with indicator-free medium after treating for 6 h. The fluo acetoxymethyl ester was used for cell incubation (30-60 min, 37°C). Cells were washed in indicator-free medium once again prior to fluorescence was measured. The fluorescence signals were visualized by an epifluorescence microscope after treatment. Images were obtained with the assistance of Image-Pro Plus 5.0 software.
MitoTracker Imaging
H4 cells were randomly divided into four groups consisting of Ctrl group, SEV group, Egr2 shRNA group and SEV+Egr2 shRNA group, and these cells received corresponding treatment for 6 h. The medium was replaced with pre-warmed (37°C) 50 nM MitoTracker (Invitrogen) medium for 10 min. Thereafter, the loading solution was replaced with fresh medium once again. The cells were visualized after treatment by using an epifluorescence microscope. Images were captured with the assistance of Image-Pro Plus 5.0 software.
Mitochondrial permeability transition pore assay
Mitochondrial transition pore assay kit (C2009S, Beyotime, China) was used to visualize the mitochondrial transition pores according to the manufacturer’s instructions. Cells were stained using acetoxymethyl ester of calcein dye (calcein AM, green) followed by incubating with CoCl2 solution, which effectively quenched the calcein fluorescence in the cytoplasm. The calcein fluorescence could not be quenched if the MPTP is tightly closed, while the Co2+ ions enter the mitochondria to quench the mitochondrial calcein fluorescence when the MPTP is open. Mitochondrial pore opening reduced the green fluorescence.
Determination of Malondialdehyde (MDA) and GSH Levels
Tissue proteins were prepared as described in the Lipid Peroxidation MDA assay kit (Beyotime, S0131). The MDA concentration of each sample was evaluated by multimode microplate readers (SpectramMax M5) at 532 nm, and using 490 nm served as a control. Additionally, the level of GSH were measured according to the requirements of the instructions in reagent kits (Beyotiome, S0052), and the protein concentration was determined with BCA protein assay reagent kit. The values were normalized to total protein in tissue samples.
Reactive oxygen species determination
H4 human neuroglioma cells were randomly divided into four groups including Ctrl group, SEV group, Egr2 shRNA group and SEV+ Egr2 shRNA group, and the regional mitochondrial ROS accumulation was measured by using the Mito-SOX reagent (M36008, Thermo Fisher, USA). After treatment, H4 cells were washed with HBSS solution buffer. A 5 μM Mito-SOX working solution was then prepared. Next, 1.0 mL of the 5 μM Mito-SOX reagent was applied as a cell loading solution in which cells were incubated for 10 min at 37 °C without light exposure. Cells were then gently washed three times with warm PBS. Excitation wavelengths were measured at 510 nm and emission at 580 nm by a fluorescence microplate reader (SpectraMax M5/M5e). The intracellular ROS levels in H4 cells were measured with the fluorescent probe dihydroethidium (DHE). After being treated with 4.1% sevoflurane for 6 h, H4 cells were incubated with 1 μM DHE (YEASEN, 50102ES02, China) for 60 min at 37°C. Excitation wavelengths were measured at 518 nm and emission at 610 nm by a fluorescence microplate reader (SpectraMax M5/M5e).
Mitochondrial respiration analysis
The oxygen consumption rate (OCR) was measured by using a Seahorse XF96 analyzer (Seahorse Agilent, USA) combined with the Agilent Seahorse XFe96 Extracellular Flux Assay Kit according to the manufacturer’s recommendations. Briefly, H4 cells were seeded in 96-wells of a Agilent Seahorse XF96 cell culture microplate (101085-004) and received corresponding treatment for 6 h. The culture medium was replaced with 175 μL assay medium, supplemented with 25 mM glucose, 2 mM glutamine, and 2 mM pyruvate on the day of the assay. Prior to the assay, plates were incubated at 37°C for approximately 1 h in a non-CO2 incubator. Afterwards, the basal OCR was determined followed by the automated injection of 25 μl oligomycin (8 μM), and mixing for 3 min and measurement for 2 min. Next, 25 μl carbonyl cyanide 4-(trifluoromethoxy) phenylhydrazone (FCCP) (9 μM) was injected, and OCR was measured for 2 min. Finally, a combination of 25 μl rotenone (20 μM) + antimycin A (100 μM) was injected, followed by the same mixing and measurement steps. ECAR was automatically recorded by the Seahorse XFe96 software, and the respiration rate was calculated by the Seahorse analyzer.
MitoTracker and ERTracker Imaging
H4 cells were randomly divided into four groups (Ctrl group, SEV group, Egr2 shRNA group and SEV+ Egr2 shRNA group), and these cells received corresponding treatment for 6 h. Thereafter, the medium was replaced with prewarmed (37 °C) MitoTracker medium (50 nM, Invitrogen) for 5 min and ERTracker medium (100 nM, invitrogen) for 30 min. cells were permeabilized with 0.2% Triton® X-100 for 10 minutes and incubated with antibody diluent containing goat antibodies against Drp1 (1:100; ABclonal, A17069) overnight at 4 °C. Then sections were rinsed with PBS (3×10 min) followed by incubation with Alexa Fluor™ 594 goat anti-rabbit antibody for 1 h at room temperature. After rinsing with PBS (6 × 5 min), fluorescence signals were visualized under an epifluorescence microscope. Images were captured with the assistance of Image-Pro Plus 5.0 software, and all the parameters used were kept consistent during capturing.
Morphological observation of mitochondria
The hippocampal tissues were fixed with 2.5% glutaraldehyde overnight at 4 °C, and post-fixed with 1% osmium tetraoxide for 2 h after rinsing for three times with phosphate-buffered saline (PBS). Then, the specimens were rinsed with distilled water followed by a graded ethanol dehydration series ending with propylene oxide. After infiltration in a mixture of one-half propylene oxide and one-half resin, the tissues were embedded in resin. Cross sections (120 nm) were made, which were stained with 4% uranylacetate for 20 min and 0.5% lead citrate for 5 min. The morphology of mitochondria in the hippocampal neurons was observed by using a transmission electron microscope (TEM) (Phliphs Tecnai 10, Holland) in the Center of Cryo-Electron Microscopy at Zhejiang University.
Prussian blue staining
Sections (5 μm) were stained for Prussian blue reaction through an Iron Stain Kit (YEASEN, 60533ES20) according to the manufacturer’s instructions. Briefly, slides were deparaffinized and hydrated to deionized water. Then, the samples were immersed in a freshly prepared solution of equal parts 5% potassium ferrocyanide and 5% hydrochloric acid for 10 min. Meanwhile, the samples were rinsed using deionized water, immersed in 2% pararosaniline solution for 5 min, and rinsed with deionized water once again, and immediately dehydrated and coverslipped. Images of positively stained sections were captured via an Olympus BX61 microscope.
Statistical analysis
SPSS 19.0 software was used to process the data. All data are represented as mean ± standard deviation, and analyzed by one-way analysis of variance (ANOVA) and Tukey's post hoc test. P<0.05 was considered statistically significant.