The Landscape of m6A RNA methylation regulators in HCC
We analyzed the mRNA expression levels of the known m6A-related regulators including m6A “writers”, such as METTL3, METTL4, WTAP, ZC3H13, RBM15, RBM15B and VIRMA, m6A “readers”, such as YTHDF1, YTHDF2, YTHDF3, YTHDC1, YTHDC2, HNRNPC, HNRNPA2B1, IGF2BP1, IGF2BP2, IGF2BP3 and RBMX, m6A “erasers”, such as FTO and ALKBH5. Compared with normal liver tissue, HCC patients generally contain a higher proportion of m6A genes except ZC3H13 (Figure.1a, b). Furthermore, we validated the expression of these aberrant m6A-associated genes in HPA databases (Figure.s1). An important detail to mention is that METTL3, WTAP, RBM15B, YTHDF1, YTHDF2, YTHDF3, HNRNPA2B1, IGF2BP1, IGF2BP2, IGF2BP3 and RBMX were absent from the HPA database. Taken together, these data confirmed the highly significant dysregulation of several m6A-related regulators in human HCC. We further systematically investigated the relationships between each individual m6A RNA methylation regulator and the pathological features of HCC, and identified that as the pathological grade and T-stage increased, the expression of HNRNPA2B1, METTL3, METTL4, RBMX, YTHDF1 and YTHDF2 increased (Figure.2, Figure.s2).
The expression characteristics of m6A RNA methylation regulators
We assessed the expression similarity of m6 regulators and clustering stability applying the ConsensusClusterPlus package, then divided the HCC patient cohort into three clusters, namely cluster 1, cluster 2 and cluster 3 (Figure.3a-c). Notably, survival analysis showed cluster 1 to be significantly associated with better DFS and cluster 2 (119 patients) to be associated with poorer DFS, cluster 3 was characterized by an intermediate prognosis (Figure.3d). A favorable prognostic trend for OS was also seen, through statistics was not significant, partly because of the limitation of the cohort size.
Moreover, the PPI network depicted a comprehensive landscape of m6A RNA methylation regulators interactions and the erasers including WTAP, VIRMA and METTL14 ranked first according to the degree of connectivity (Figure.4a). Figure.4b showed a majority of m6A RNA methylation regulators are positively correlated and the correlation between HNRNPC and RBMX is the most significant.
Prognostic value of m6A RNA methylation regulators, and Construction of the m6A signature
Next, we analyzed the possible prognostic power of m6A RNA methylation regulators in HCC by performing univariate Cox regression.. The results demonstrated that six out of twenty tested genes are significantly correlated with DFS /OS and increased expressions of HNRNPA2B1, IGF2BP3, METTL3, WTAP, YTHDF1, YTHDF2 have a poorer survival in patients with HCC.(Figure.5a). Applying LASSO analysis, in which the selected m6A RNA methylation regulators were required to appear 900 times out of 1000 repetitions, four m6A RNA methylation regulators, IGF2BP3, YTHDF1, YTHDF2 and METTL3 were selected. A risk score was generated using these genes weighted by the coefficients from the LASSO regression. To investigate the prognostic role of the four-gene risk signature, we assigned LIHC patients to groups based on high or low risk scores using the cut-off value obtained with the survminer package, and observed that high-risk group had a shorter OS/DFS than those in the low risk group (Figure.5b-c). Similarly, GEO HCC patients were divided into low- and high- risk groups and OS/DFS was significantly shorter in the high-risk group compared to that in the low-risk group (Figure.s3).
The role of the risk-score subtypes in TCGA HCC cohort
The heatmap (Figure.6a) shows the expression of the four selected m6A RNA methylation regulators and clinicopathological variables in the high- and low-risk groups. Similar to their association to prognosis, low-risk group was more frequently involved with lower T stage and pathological grade (Figure.6b-c). We performed univariate and multivariate Cox regression analyses to evaluate whether the prognostic signature-based risk score was an independent factor for prognosis. When the m6A signature was evaluated as a continuous variable with the Cox regression model, the univariate and multivariate analysis validated that the stage and risk score were significantly linked with DFS/OS (Figure.6d-e). These results suggest that the risk signature is a risk factor and can independently predict the prognosis of HCC patients.
Differential somatic mutation landscape and methylation‐driven genes between the HCC risk score subtypes
To identify the correlations between distributions of somatic alterations and the HCC risk score subtypes, 526 genes were shared significant mutation in the risk-high and risk-low groups. Specifically, a missense mutation on TP53 was predominantly observed in high-risk group, suggested key mutations in HCC may involve with m6A modification (Figure.7).
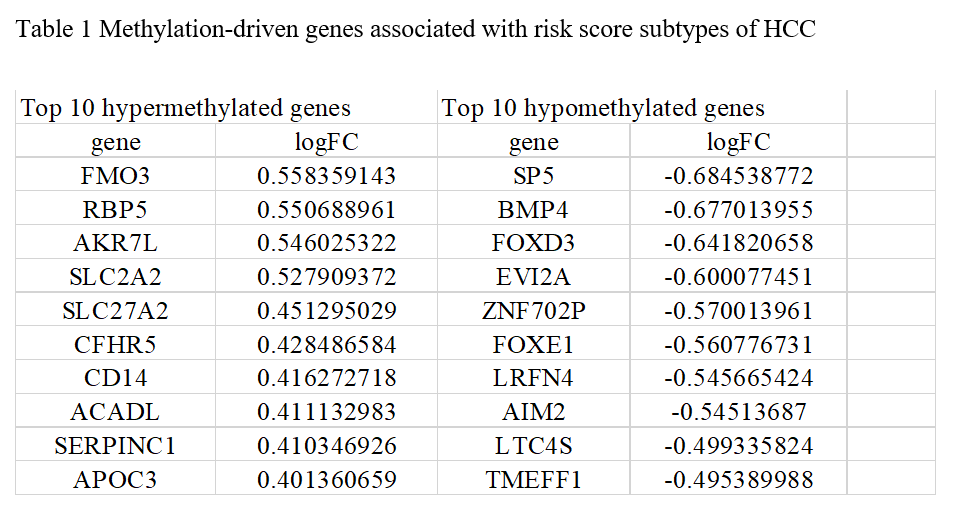
The methylation‐driven genes are genes with different degree of methylation and expression between different groups. After downloading and processing of methylation data, we screened 569 methylation‐driven genes associated with risk score subtypes via using MethylMix R package (Table.1). Of these genes, 461 genes (81.02%) were hypomethylated and the remainder of the 108 genes (18.98%) were hypermethylated. These data may provide a new perspective to study the mechanism of m6A modulation.