Clinical characteristics
Twenty-seven patients (23 men, 4 women) with a mean age of 62 ± 15 years (range: 5-83) were included (Table 1). Forty-four percent (n=12) of patients had type 2 diabetes, 69.2% (n=18) had hypertension, 52% (n=13) had cardiovascular history (including ischemic heart disease or heart failure). Forty-four percent (n=11) were persistent or former smokers, 37.5% (n=9) had an active chronic alcohol consumption and 9.1% (n=2) had liver cirrhosis. Immunodepression was present in 3 patients (1 patient was treated for lung cancer, 1 patient had myelodysplasia, 1 patient received immunosuppressive medication to treat Crohn’s disease).
Infection characteristics
The infectious agent was identified in 88.9% of patients (Table 1).
Table 1: Demographics, predisposing factors to infection and infectious history.
|
Variables
|
n=27
|
|
Male (n (%))
|
23 (85.2)
|
|
Age, year (mean ± SD)
|
62 ± 15
|
|
Comorbid conditions
|
|
|
Diabetes mellitus (n (%))
|
12/27 (44.4)
|
|
Hypertension (n (%))
|
18/26 (69.2)
|
|
Cardiovascular disease (n (%))
|
13/25 (52.0)
|
|
Active or former smokers (n (%))
|
11/25 (44.0)
|
|
Alcoholism (n (%))
|
9/24 (37.5)
|
|
Liver cirrhosis (n (%))
|
2/22 (9.1)
|
|
Immunosuppressive drug (n (%))
|
1/27 (3.7)
|
|
Infectious agent
|
|
|
Staphylococcus (n (%))
|
21 (77.8)
|
|
MRSA (n (%))
|
4 (14.8)
|
|
MSSA (n (%))
|
16 (59.3)
|
|
Staphylococcus haemolyticus (n (%))
|
1 (3.7)
|
|
Morganella morganii (n (%))
|
2 (7.4)
|
|
Streptococcus oralis (n (%))
|
1 (3.7)
|
|
ESBL-producing Escherichia coli (n (%))
|
1 (3.7)
|
|
Enterococcus faecalis (n (%))
|
1 (3.7)
|
|
Enterobacteraerogenes (n (%))
|
1 (3.7)
|
|
Chlamydia pneumoniae (n (%))
|
1 (3.7)
|
|
Corynebacterium amycolatum (n (%))
|
1 (3.7)
|
|
Dermabacter hominis (n (%))
|
1 (3.7)
|
|
More than one pathogen (n (%))
|
7 (25.9)
|
|
Unknown (n (%))
|
3 (11.1)
|
|
Sites of infection
|
|
|
Bone and joint infection (n (%))
|
12 (44.4)
|
|
Skin infection (n (%))
|
11 (40.7)
|
|
Bacteremia (n (%))
|
11 (40.7)
|
|
Other sites
|
|
|
Prosthesis, plate osteosynthesis or implantable venous access port (n (%))
|
5 (18.5)
|
|
Endocarditis (n (%))
|
4 (14.8)
|
|
Pneumonia (n (%))
|
4 (14.8)
|
|
Urinary tract infection (n (%))
|
3 (11.1)
|
Abbreviations: ESBL: extended-spectrum beta-lactamases, MRSA: methicillin-resistant Staphylococcus aureus, MSSA: methicillin-sensitive Staphylococcus aureus, SD: standard deviation.
Staphylococcus was the most frequent causative agent (77.8%) (methicillin-sensitive Staphylococcus aureus (MSSA) in 59.3% and methicillin-resistant Staphylococcus aureus (MRSA) in 14.8%). In 25.9% of the cases, two or more pathogens were identified. A variety of other pathogens were identified including Streptococcus oralis, Chlamydia pneumoniae or Escherichia coli.
Sites of infection were identified in all patients: bone and joint (44.4%) and skin (40.7%) were the most frequent sites. Other infections included prosthesis, plate osteosynthesis, or implantable venous access port infections, endocarditis, pneumonia and urinary tract infection. Bacteremia was present in 40.7% of cases.
Renal presentation
Renal presentation included nephrotic syndrome for 66.7% of patients, acute nephritic syndrome in 55.6% and rapidly progressing glomerulonephritis in 55.6% of cases (Table 2).
Table 2: Renal presentation
|
Renal parameters
|
|
|
|
Nephrotic syndrome (n (%))
|
18/27 (66.7)
|
|
|
Acute nephritic syndrome (n (%))
|
15/27 (55.6)
|
|
|
Rapidly progressive glomerulonephritis (n (%))
|
15/27 (55.6)
|
|
|
Hematuria (n (%)) (microscopic/macroscopic)
|
20/21 (95.2) (11/8)
|
|
|
Serum creatinine, mg/dL (mean ± SD)
|
4.24 ± 2.93
|
|
|
Creatinine >4 mg/dL (n (%))
|
13/27 (48.1)
|
|
|
eGFR, mL/min/1.73m² (mean ± SD (range))
|
23.7 ± 19.9 (3-82)
|
|
|
Albumin, g/L (mean ± SD (range))
|
24.7 ± 7.4 (15-42)
|
|
|
Proteinuria, g/day (mean ± SD)
|
5 ± 3.4 (0.4-16.4)
|
|
|
Baseline serum creatinine, mg/dL (mean ± SD)
|
1.06 ± 0.3
|
|
|
Other biological parameters
|
|
|
|
Low C4 levels (n (%))
|
2/26 (7.7)
|
|
|
Low C3 levels (n (%))
|
4/25 (16.0)
|
|
|
Both C3 and C4 low levels (n (%))
|
2/25 (8.0)
|
|
|
High serum IgA levels (n (%))
|
11/13 (84.6)
|
|
|
ANCA (n (%))
|
4/15 (26.7)
|
|
Abbreviations: ANCA: antineutrophil cytoplasmic antibodies, eGFR: estimated glomerular filtration rate, SD: standard deviation.
All patients had proteinuria (mean proteinuria: 5 ± 3.4 g/day), 95.2% had hematuria, with macroscopic hematuria in 8 cases. Serum creatinine ranged from 0.99 mg/dL to 13.63 mg/dL (mean: 4.24 ± 2.93) and estimated glomerular filtration rate (eGFR) varied from 3 to 82 mL/min/1.73m². Severe acute renal injury was present in 48.1% of patients and 33% required hemodialysis. Hypocomplementemia was detected in only 16% of patients (both low C3 and C4 levels in 8%). Serum IgA level was increased in 84.6% of the 13 patients tested. Antineutrophil cytoplasmic antibodies (ANCA) were detected in 26.7% of 15 patients.
Pathology findings
The median delay between clinically apparent onset of infection and biopsy was 42 days (IQR: 26-69). Pathology findings are summarized in Table 3.
Table 3: Microscopy findings.
|
Variables
|
n=27
|
|
Histologic features
|
|
|
No. of glomeruli (mean ± SD (range))
|
15 ± 9 (3-46)
|
|
Globally sclerotic glomeruli (mean ± SD (range))
|
2 ± 2 (0-8)
|
|
Mesangial hypercellularity (n (%))
|
24 (88.9)
|
|
Endocapillary proliferation (n (%))
|
24 (88.9)
|
|
Segmental (n (%)) / Global (n (%))
|
9 (33.3) / 15 (55.6)
|
|
Focal (n (%)) / Diffuse (n (%))
|
10 (37.0) / 14 (51.9)
|
|
Exudative endocapillary proliferation (n (%))
|
22 (81.4)
|
|
<5 neutrophils per glomerulus (n (%)) / ≥5 neutrophils per glomerulus (n (%))
|
15 (55.5) / 7 (25.9)
|
|
Membranoproliferative pattern (n (%))
|
9 (33.3)
|
|
Crescentic proliferation (n (%))
|
10 (37.0)
|
|
Cellular (n(%)) / Fibrocellular (n(%)) / Fibrous (n(%))
|
7 (25.9%) / 5 (18.5%) / 0
|
|
Fibrinoid necrosis (n (%))
|
3 (11.1)
|
|
Deposits (n (%))
|
16 (59.2)
|
|
Subepithelial humps (n (%)) / Intramembranous (n (%))
|
13 (48.1) / 3 (11.1)
|
|
Interstitial fibrosis and tubular atrophy (n (%))
|
23 (85.1)
|
|
Mild (n (%)) / Moderate (n (%)) / Severe (n (%))
|
12 (44.4) / 5 (18.5) / 6 (22.2)
|
|
Interstitial inflammation (n (%))
|
21 (77.8)
|
|
Mild (n (%)) / Moderate (n (%)) / Severe (n (%))
|
16 (59.3) / 5 (18.5) / 0
|
|
Acute tubular injury (n (%))
|
23 (85.1)
|
|
Mild (n (%)) / Moderate (n (%)) / Severe (n (%))
|
8 (29.6) / 8 (29.6) / 7 (25.9)
|
|
Red blood cells casts (n (%))
|
18 (66.7)
|
|
Arteriosclerosis (n (%))
|
24 (88.9)
|
|
Mild (n (%)) / Moderate (n (%)) / Severe (n (%))
|
4 (14.8) / 16 (59.3) / 4 (14.8)
|
|
Histologic pattern
|
|
|
Acute (n (%))
|
7 (25.9)
|
|
Subacute (n (%))
|
17 (63.0)
|
|
Resolving (n (%))
|
3 (11.1)
|
Abbreviations: SD: standard deviation.
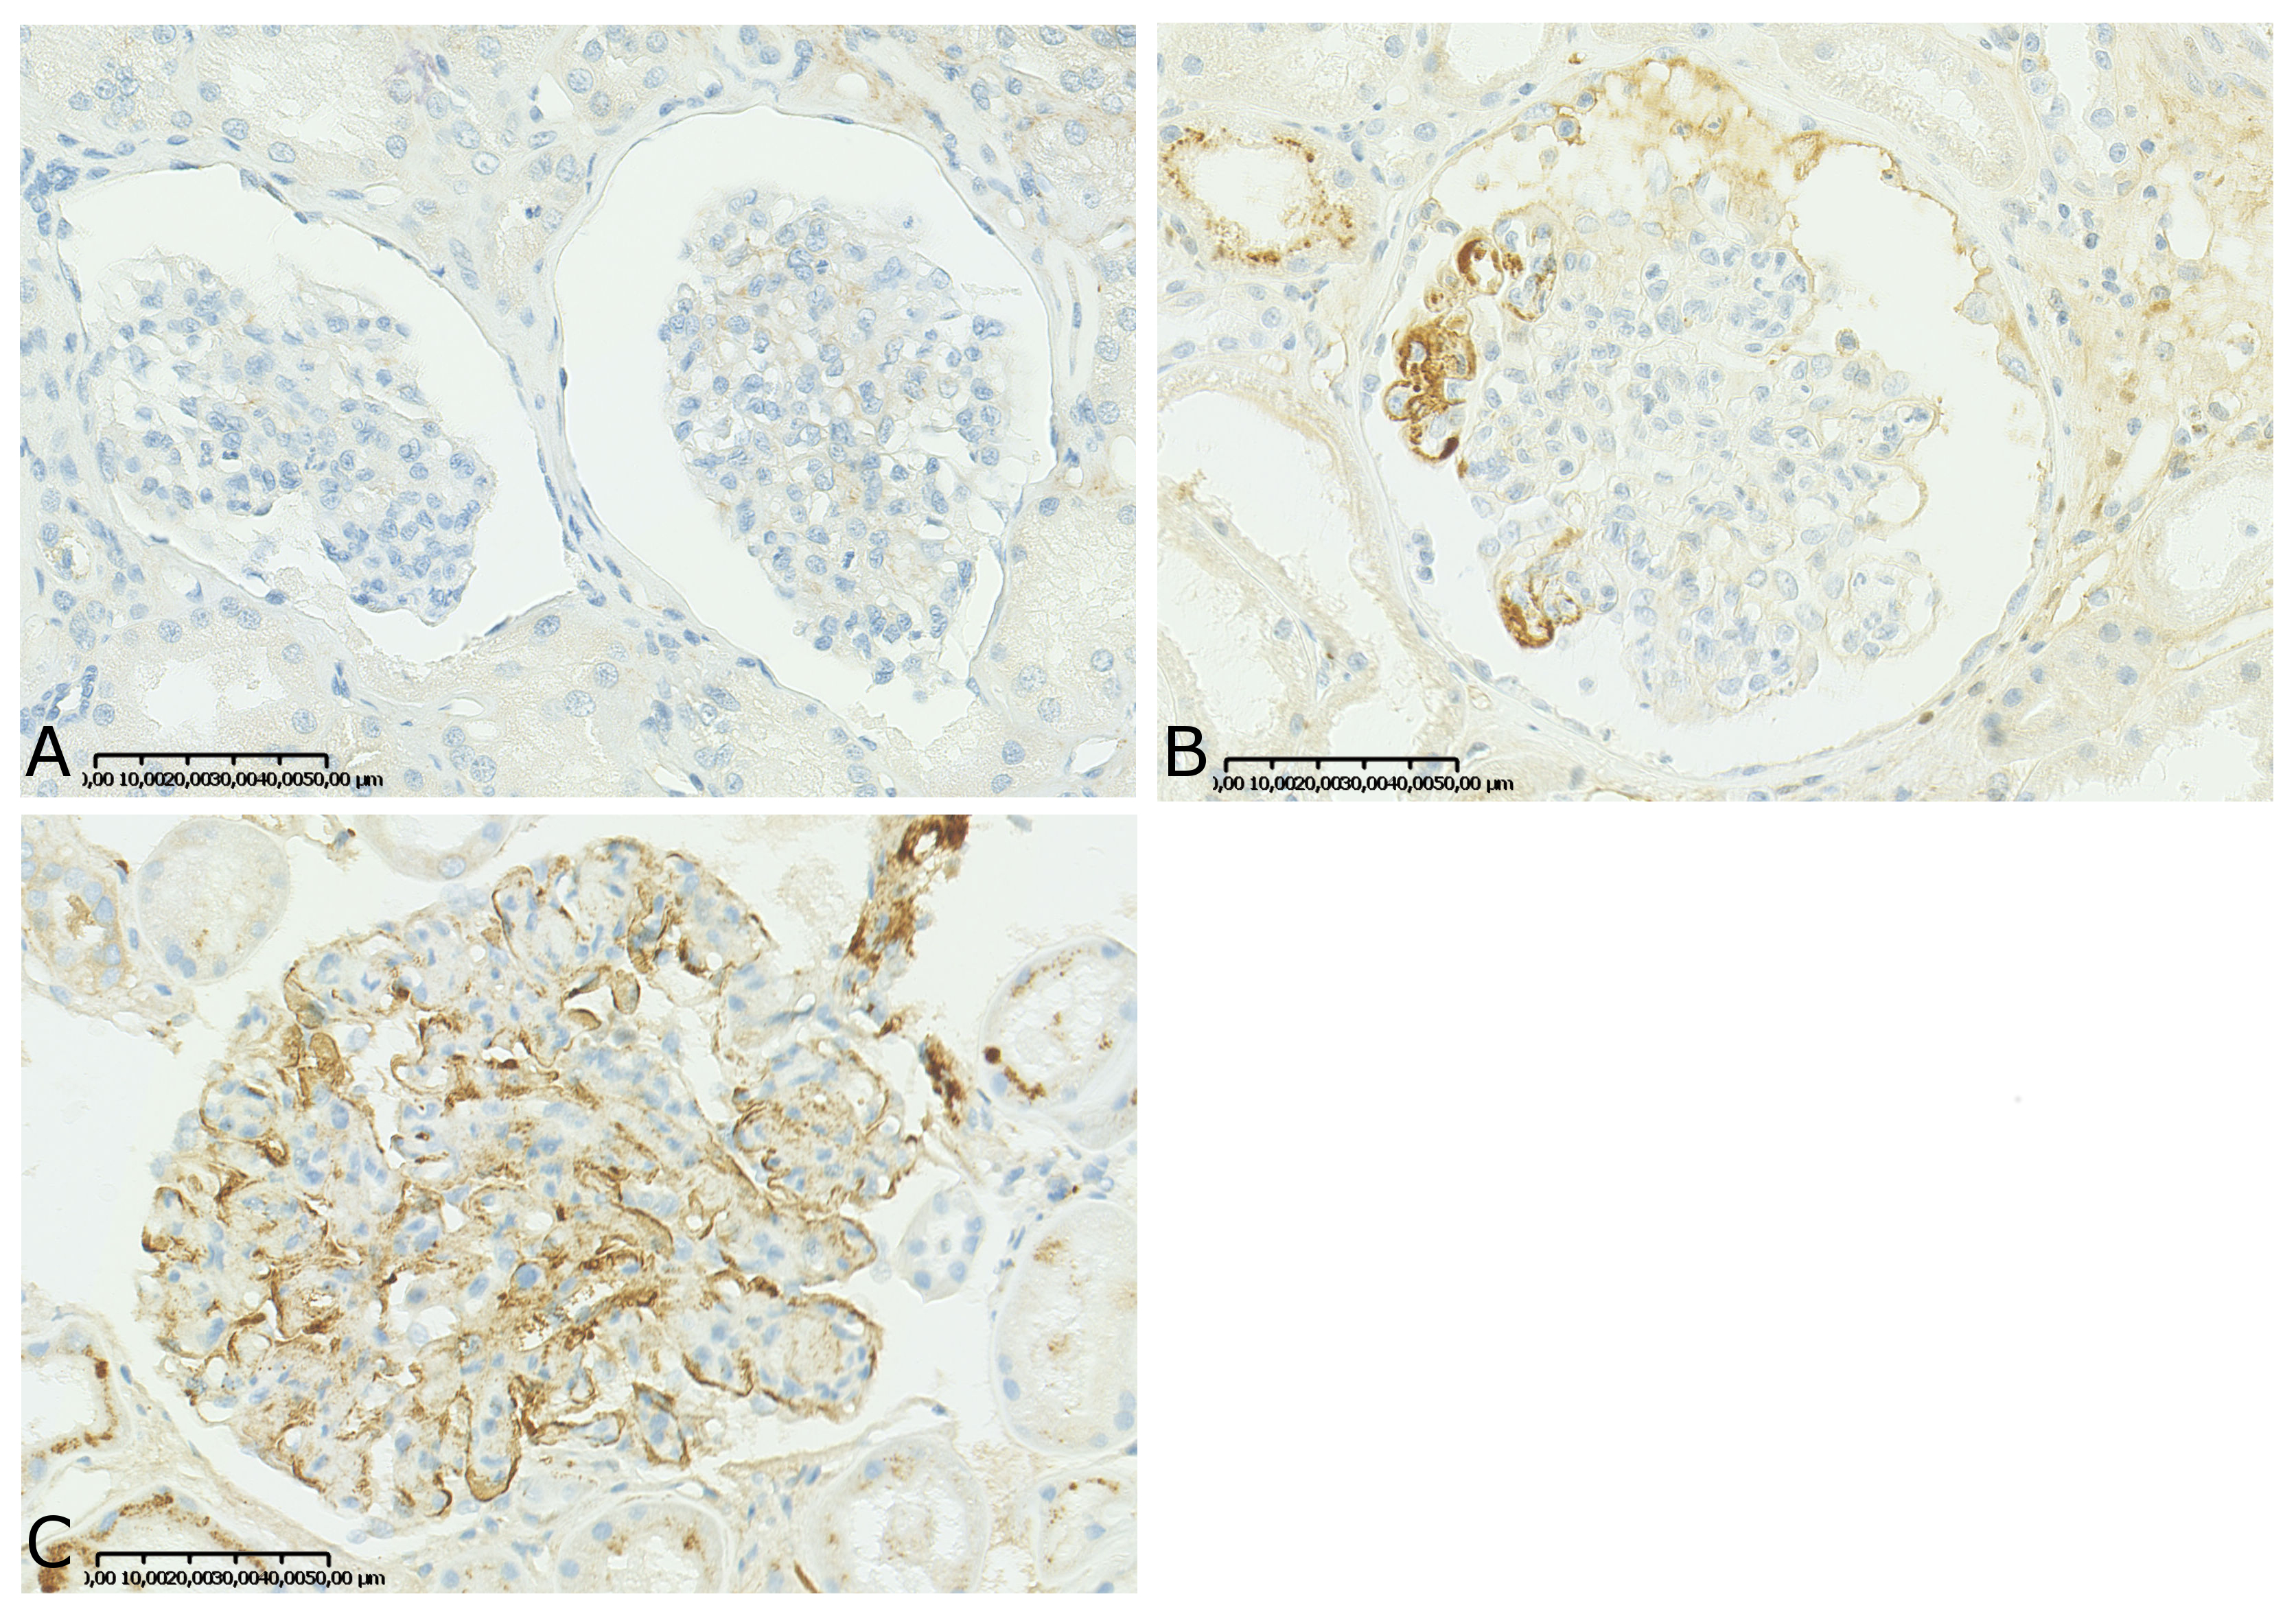
Endocapillary proliferation associated with mesangial proliferation was the most frequent pattern (81.5%) (Figure 1A). Mesangial proliferation was pure in 7% of cases. Endocapillary proliferation most frequently involved neutrophils (81.4%) (Figure 1B). In one patient we observed only globally sclerotic glomeruli without proliferation. Membranoproliferative pattern and crescentic proliferation were also observed (33.3% and 37% respectively) (Figures 1C and 1D). All biopsies with crescent formation had endocapillary proliferation and almost all (9 out of 10) had mesangial proliferation. In almost all biopsies we observed de novo proliferation, except in one case (4%) in which proliferation was superimposed on diabetic nephropathy. We identified subepithelial humps deposits in 48.1% of biopsies and prominent deposits in the glomerular capillary wall of 11.1% of biopsies, with hyaline thrombi resembling cryoglobulin in one (Figures 1E and 1F). Interstitial fibrosis and tubular atrophy (IF/TA) were observed in 85.1% of cases (44.4% mild, 18.5% moderate, 22.2% severe). Classification according to pattern presentation revealed 25.9% acute, 63% subacute and 11.1% resolving GN (Table 3).
Immunofluorescence and immunohistochemistry
Immunofluorescence features are summarized in Table 4.
Table 4: Immunofluorescence and immunohistochemistry findings.
|
Immunofluorescence
|
|
|
IgA
|
27/27 (100)
|
|
+/ ++ / +++ (n (%))
|
8 (29.6) / 9 (33.3) / 10 (37.1)
|
|
Mesangial / Capillary loop / Both (n (%))
|
9 (34.6) / 5 (19.2) / 12 (46.2)
|
|
C3
|
27/27 (100)
|
|
+/ ++ / +++ (n, %)
|
5 (19.2) / 6 (23.1) / 15 (57.7)
|
|
Mesangial / Capillary loop / Both (n (%))
|
9 (36.0) / 2 (8.0) / 14 (56.0)
|
|
IgA and C3 codominant (n (%))
|
15 (55.5)
|
|
IgA dominant (n (%))
|
3 (11.1)
|
|
IgG staining (n (%))
|
4/27 (14.8)
|
|
IgM (n (%))
|
6/27 (22.2)
|
|
C1q (n (%))
|
0
|
|
Kappa (n (%))
|
9/24 (37.5)
|
|
Lambda (n (%))
|
14/24 (58.3)
|
|
C4d Immunohistochemistry
|
23/27 (85.2)
|
|
0/+ / ++ (n (%))
|
8 (34.8) / 11 (47.8) / 4 (17.4)
|
IgA granular deposits were observed in all biopsies with various locations: mesangium (34.6%), both mesangium and peripheral capillary loops (46.2%) or capillary loops only (19.2%). A “starry sky” pattern was noticed in 4 cases (15%). C3 deposits were observed in 100% of biopsies. Dominant IgA deposits were observed in 3 cases (11.1%) or most frequently codominant with C3 (55.5%). C1q deposits were not identified.
Immunohistochemistry with C4d antibody was performed in 23 biopsies of IRGN-IgA. Most of the biopsies had focal glomerular C4d 1+ staining (47.8%) or no glomerular staining (C4d0, 34.8%). C4d 2+ glomerular staining was only seen in 4 biopsies (17.4%). The 4 biopsies exhibited an acute (n=2) or subacute (n=2) pattern.
Renal characteristics according to histologic pattern
The delay between infection and renal biopsy, available for 88.9% of patients, was significantly increased according to the glomerulonephritis pattern from acute GN (median: 21.5 days, IQR: 20.3-27.3) to subacute (median: 43.5 days, IQR: 32.5-72.8) and resolving GN (median: 94.5 days, IQR: 85.3-103.8) (P value=0.03) (Figure 2A). We observed that the delay between infection and renal biopsy was shorter in C4d 2+ stained biopsies (median: 24.5 days) compared to C4d 0 and C4d 1+ stained biopsies (median: 43 and 45 days respectively, P value=0.05). We did not observe any differences in IgA staining according to histologic pattern (median: 2+ for all groups) but C3 staining was higher in patients with acute GN (median: 3+) than in those with subacute and resolving GN (median: 2+) (Figure 2B and 2C).
Comparing the three histologic patterns (acute, subacute and resolving) , we saw that the percentage of skin infections tended to be more frequent in the acute than in the subacute and resolving groups (respectively 46.2% vs 14.8% and 20%, P value=0.09) whereas bone and joint infections tended to be less frequent in the acute group (7.7% vs 33.3% and 40% respectively, P value=0.1) (data not shown).
Therapeutic management and outcome
All patients received antibiotics (Additional table 1). The antibiotics the most commonly used were penicillin (77.8%) and rifampicin (40.7%), and 88.9% of patients received two or more antibiotics. Other antibiotics included cephalosporin, aminoside, macrolide, quinolone, glycopeptides and carbapenem. In addition to antibiotics, corticosteroids were used in 37% of patients.
Clinical follow-up was available in 26 out of 27 patients (96.3%) with median follow-up of 13.2 months (IQR: 4.0-22.2) (Additional table 2).
At last follow-up, 23.1% of patients had died, 46.2% had persistent renal dysfunction, and 15.4% had ESRD. One patient died due to progression of pulmonary carcinoma, one died of aspiration pneumonia, another of septic shock. For the 3 other patients, the cause of death was not available. For one dead patient information about eGFR was not available, and 25 patients (92.5%) could be classified according to their eGFR at follow-up (Table 5): 28% had eGFR>60 mL/min/1.73m², 56% had persistent renal disease (PRD) and 16% had end-stage renal disease (ESRD).
Table 5: Outcome and prognostic factors (25 patients).
|
|
eGFR>60 mL/min/1.73m² ¥
|
PRD ǂ
|
ESRD †
|
P values
|
|
No. of patients
|
7
|
14
|
4
|
|
|
% of patients
|
28
|
56
|
16
|
|
|
Age, year
|
61
|
64
|
68
|
0.8
|
|
Median follow-up, months
|
8.3
|
16.5
|
21.6
|
0.3
|
|
Mean eGFR, ml/min/1.73m²
|
|
|
|
|
|
At biopsy
|
28.9
|
20.9
|
17.5
|
0.6
|
|
Follow-up
|
84.6
|
37.5
|
-
|
<0.001
|
|
Mean proteinuria at biopsy, g/day
|
3.5
|
5.5
|
6.5
|
0.2
|
|
Corticosteroids, % of patients
|
0
|
64
|
25
|
0.01
|
|
Median infection-renal injury delay, days (IQR)
|
13 (8.5-36)
|
23 (17.8-69)
|
13 (10-47.3)
|
0.3
|
|
Histologic pattern (acute/subacute/resolving, %)
|
29/57/14
|
29/64/7
|
50/25/25
|
0.1
|
|
Global glomerulosclerosis, % of glomeruli
|
13
|
18
|
44
|
0.2
|
|
Crescentic proliferation, % of glomeruli
|
4
|
6
|
5
|
0.9
|
|
Interstitial inflammation score, mean
|
0.9
|
0.9
|
1.5
|
0.2
|
|
Acute tubular injury score, mean
|
1.6
|
1.8
|
1.75
|
0.8
|
|
IF/TA score, mean
|
0.9
|
1.6
|
2.5
|
0.02
|
|
Arteriosclerosis, mean
|
2
|
1.8
|
2
|
0.6
|
¥One patient with eGFR>60 died; ǂOne patient with PRD died; †Two patients with ESRD died.
Abbreviations: eGFR: estimated glomerular filtration rate, ESRD: end-stage renal disease, IF/TA: interstitial fibrosis with tubular atrophy, IQR: interquartile ranges, PRD: persistent renal disease (eGFR<60ml/min/1.73m²)
In univariate analysis, there was no significant correlation between renal outcome and age, eGFR at biopsy, proteinuria at biopsy, or histologic pattern (acute/subacute/resolving pattern). The only association between histologic findings and renal outcome was related to IF/TA: the IF/TA score was significantly higher in the PRD group (IF/TA score=1.6) and ESRD (IF/TA score=2.5) groups compared to the eGFR>60mL/min (IF/TA score=0.9) group (P value=0.02).