2.1 Patients
Infertile couples undergoing in vitro fertilization-intracytoplasmic sperm injection (IVF-ICSI) treatment with fresh cleavage embryo transfer at our center during July, 2018, were included in this study. The indications for assisted reproductive technology (ART) intervention were tubal factor infertility, anovulation, endometriosis, male factor infertility, or unexplained. In cases of male subfertility, immunologic factors, or unexplained fertilization failure in a previous IVF cycle, we performed ICSI. No patient selection or exclusion criteria were used. Our study was approved by the ethics committee of the Reproduction & Women–Children Hospital of Chengdu University of Traditional Chinese Medicine, and all patients provided informed consent.
2.2 Single cell proteomic cytokine measurement
We collected culture medium on the day of transfer of each embryo and measured cytokine levels. The detailed methods have been described in a previous study [3]. Briefly, Polydimethylsiloxane (PDMS) microchips with parallel microchannels (100 µm width) were assembled with a poly L-lysine-coated glass slide. Different capture antibodies (1.5 µL for each antibody) were injected into the individual microchannels for overnight coating to form antibody stripes for multiplexed protein detection. The microchannels were then washed with 1% BSA 3–5 times and blocked with 3% BSA for 10 min. After blocking, the PDMS microchip was removed, and the antibody-coated glass slide was washed with Dulbecco’s phosphate-buffered saline (DPBS), 50/50 DPBS/distilled (DI) water, and DI water sequentially before blowing dry with N2. Another PDMS microchip with parallel microchannels (100 µm width) was made hydrophilic by treating with O2 plasma for 2 min before being aligned perpendicularly with antibody stripes on the glass slide. The microchannels were blocked with 3% BSA for 1 h to reduce nonspecific adsorption. Each sample (1–2 µL) was injected into the individual microchannel and incubated overnight. Afterward, a detection antibody mixture and streptavidin-APC were added sequentially for 1 h and 0.5 h, respectively. The fluorescence results were scanned and analyzed with a GenePix 4300A scanner and its corresponding software (Molecular Devices, San Jose, CA, USA).
2.3 Human ovarian stimulation protocols and oocyte retrieval
Conventional ovarian stimulation for IVF-ICSI was performed. Patients were treated with a standard gonadotropin stimulation protocol using a short-acting gonadotropin-releasing hormone agonist (GnRH-α, Ferring Pharmaceuticals, Saint Prex, Switzerland), and GnRH-α was administered at 0.1 mg/d from the middle luteal phase of the last menstrual cycle to desensitize the pituitary gland. With the long-acting gonadotropin-releasing hormone agonist (GnRH-α, Diphereline, Ipsen, Paris, France), patients were administered 3.75 mg/d GnRH-α during the menstrual phase. For the antagonist protocol, patients were treated with 0.25 mg/d of gonadotropin-releasing hormone antagonist (GnRH-A, Cetrotide, Merck Serono, Darmstadt, Germany). Ovarian stimulation was initiated with doses of recombinant follicle-stimulating hormone (recombinant FSH, Gonal-f; Merck Serono) or human menopausal gonadotropin (Livzon Pharmaceutical Group, Zhuhai, China) varying from 150 to 300 IU/d according to the patient's age and ovarian reserve. The dose of recombinant FSH and human menopausal gonadotropin was adjusted and individualized for each patient based on follicular growth. Ovarian stimulation was monitored by transvaginal ultrasound and measurement of plasma estradiol levels. An intramuscular injection of human chorionic gonadotropin (hCG, Livzon) at 5000–10,000 U was administered during the night when follicles ≥ 18 mm in diameter accounted for more than half of those ≥ 14 mm, and the average estradiol level of the follicles ≥ 14 mm in diameter was not less than 200 pg/mL for the GnRH-α protocol. The same doses of hCG and time were administered for the GnRH-A protocol when either follicles ≥ 18 mm in diameter accounted for more than two or ≥ 17 mm in diameter accounted for more than three. Ultrasound-guided puncture was conducted for oocyte retrieval approximately 36 h later. All oocyte retrieval and embryo transplantation surgeries were performed by the same experienced surgeon, and embryos were scored as described by Gardner et al. [15] In general, two embryos at most were transplanted in each instance. An intramuscular injection of progesterone (80 mg/d; Zhejiang Xiangju Pharmaceutical Co., Ltd, Taizhou, China) was administered for luteal support.
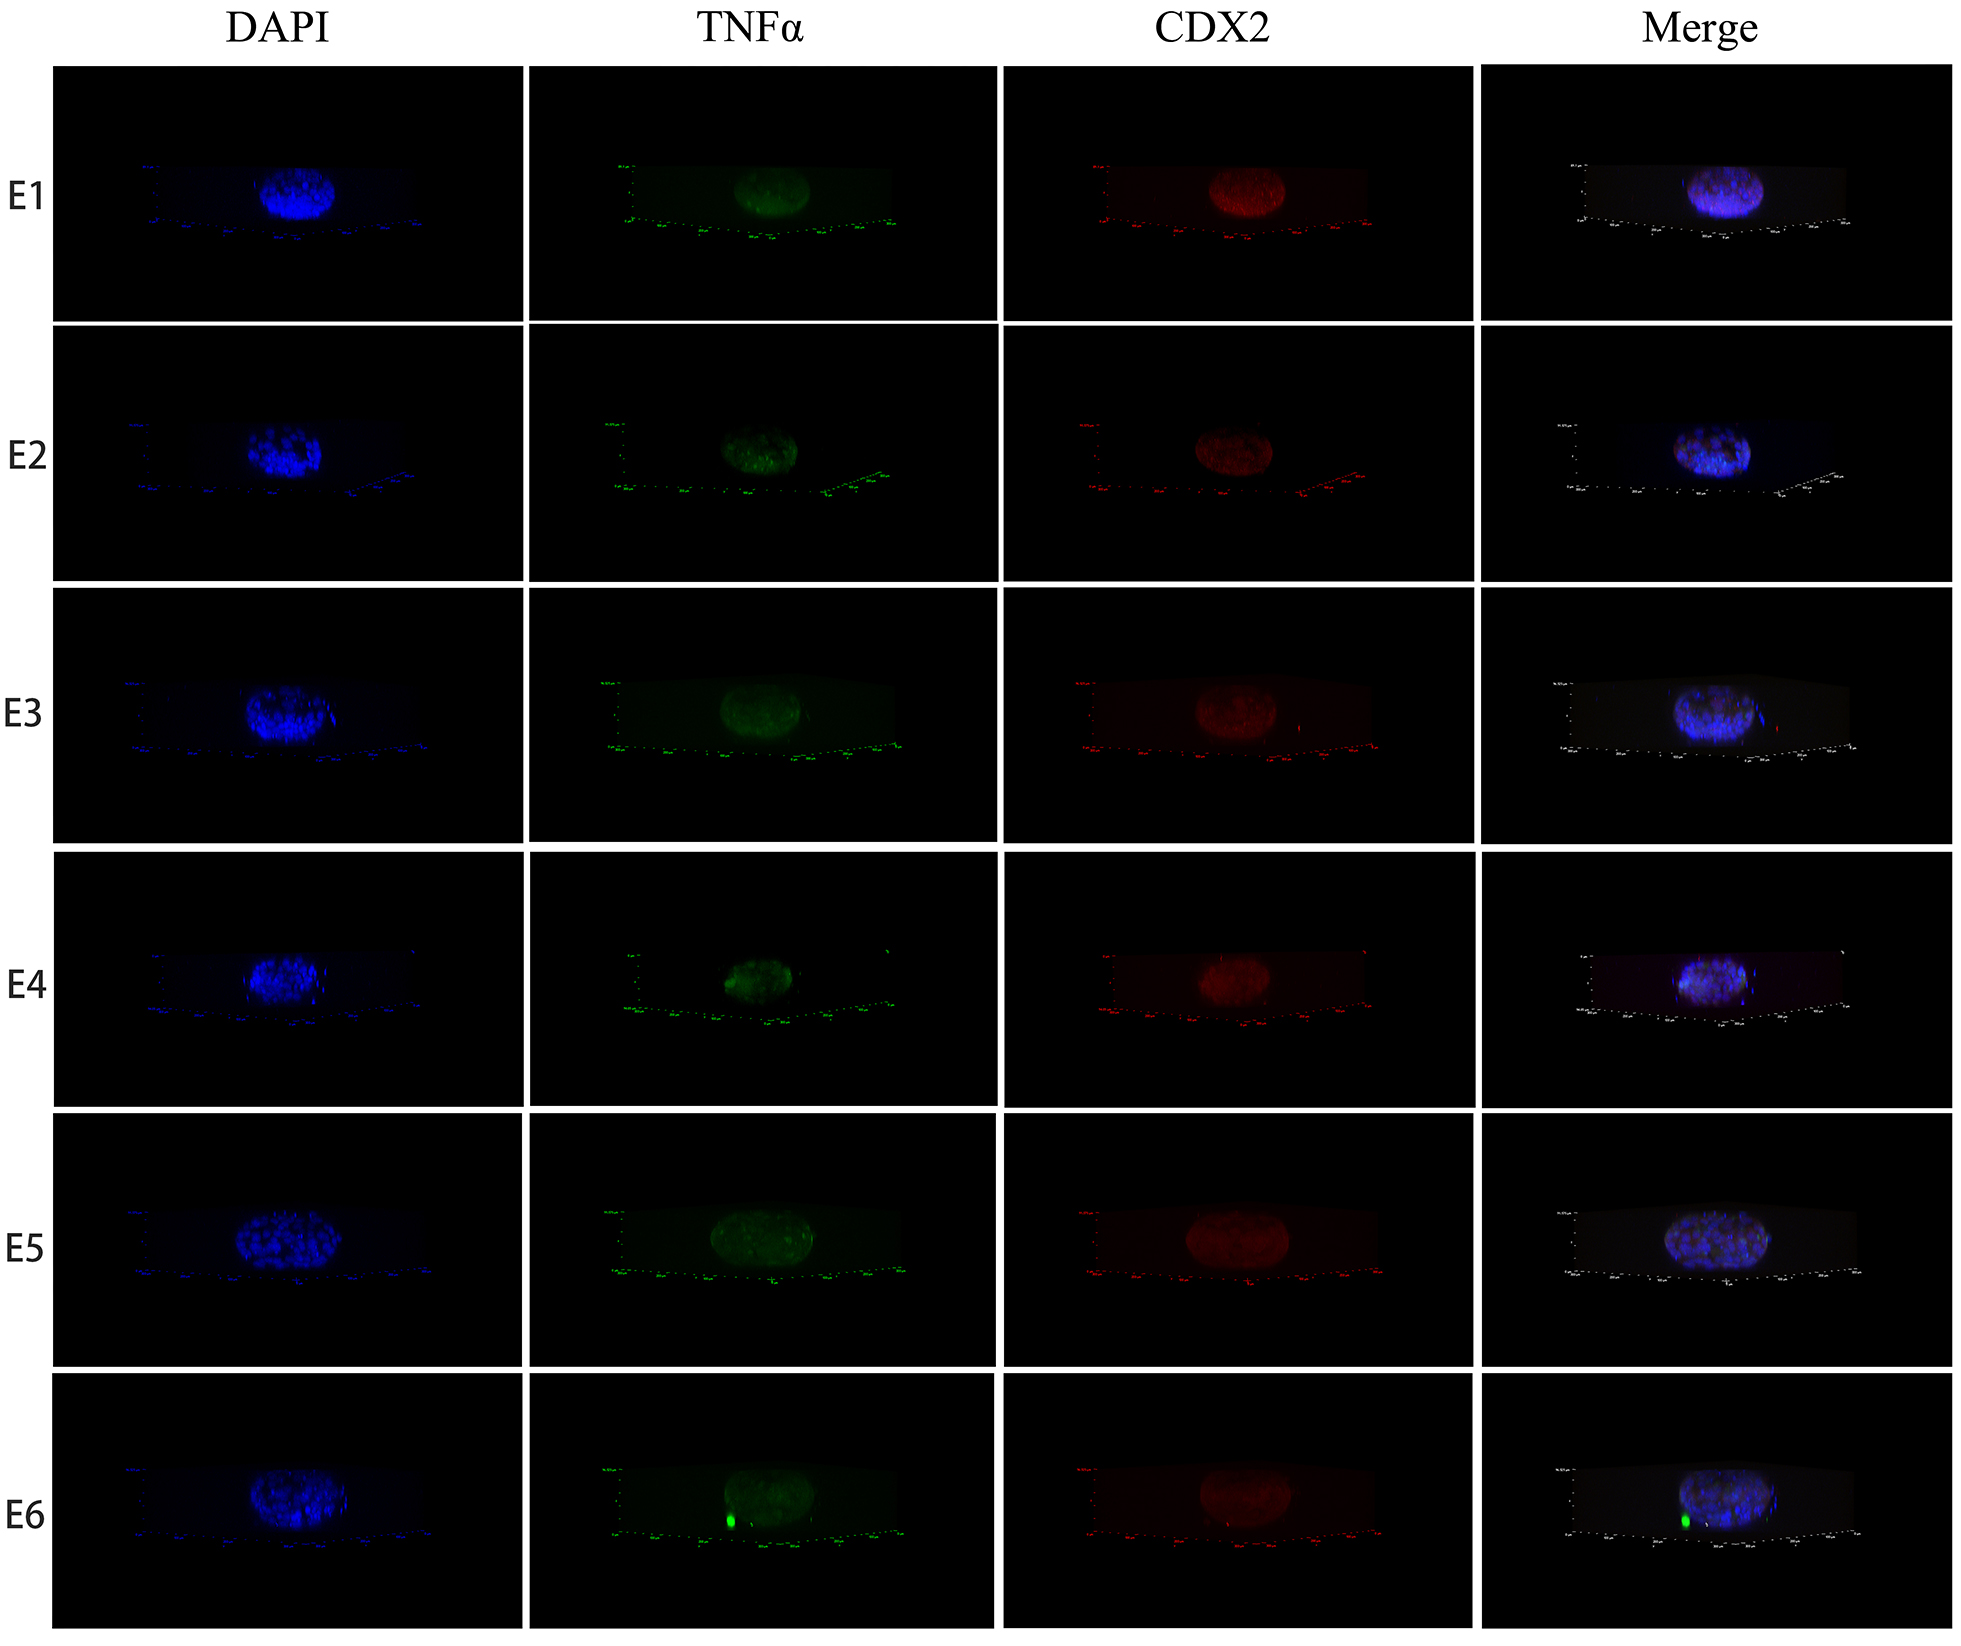
2.4 Embryo immunofluorescence stain methods
The embryo was fixed with 4% PFA for 15 min at room temperature and 0.3% Triton X-100 in PBS was added for 20 min to permeabilize the cell membrane. Then, the embryo was incubated with primary antibodies for TNF-α (1:100, Proteintech Inc., Rosemont, IL, USA) and CDX2 (1:100, Abcam, Inc., Cambridge, MA, USA) at 4 °C overnight. Subsequently, the embryo was incubated with Alexa Fluor 594-conjugated goat anti-mouse IgG (H + L), (1:1000, Invitrogen, Inc., Carlsbad, CA, USA) and AlexaFluor 488-conjugated goat anti-rabbit IgG (H + L) (1:1000, Invitrogen, Inc.) for 60 min at room temperature in the dark, followed by mounting with antifade mounting medium with DAPI (Beyotime, Inc., Shanghai, China). The analysis was conducted using a confocal laser scanning microscope (Olympus FV1000, Olympus Corporation, Waltham, MA, USA) (Nikon N-STORM & A1, Nikon Corporation, Tokyo, Japan). The six embryos used for staining originated from the same volunteer.
2.5 Ishikawa cell culture
The human endometrial cancer cell line Ishikawa was purchased from Biovector NTCC (Beijing, China). Cells were cultured in Eagle's minimum essential medium (EMEM; ATCC; Manassas, VA, USA) supplemented with 10% (v/v) FBS (Gibco; ThermoFisher Scientific, Inc., Waltham, MA, USA) and 100 nM penicillin/streptomycin in a 5% CO2 incubator at 37 °C.
2.6 Cell counting kit-8 analysis
In each well of a 96-well plate, 1 × 10⁴ Ishikawa cells were cultured as attached monolayers overnight. Varying doses of TNF-α (R&D Systems, Minneapolis, MN, USA) and ETA were then added. After 48 h of treatment, photos were taken using an inverted microscope (Olympus IX71, Olympus Corporation), and cells were processed with the Cell Counting Kit-8 from Dojindo (Shanghai, China). Quantitative analysis was performed using an automatic microplate reader (Varioskan Flash, Fisher Scientific, Inc., Waltham, MA, USA). Each test had two replicates (n = 3).
2.7 Apoptosis measurement with TUNEL staining
Ishikawa cells were grown on 14 mm glass coverslips at a density of 2 × 10⁵ cells per well in a 24-well plate. 10 ng/mL TNF-α and 25 µg/mL ETA were used to treat the cell line. After 48 h of treatment, the cells were analyzed with the TUNEL BrightGreen Apoptosis Detection Kit (Vazyme, Inc., Nanjing, China), followed by mounting with antifade mounting medium with DAPI (Beyotime, Inc.) The analysis was conducted using a confocal laser scanning microscope (Olympus FV1000). The DNase Ⅰ (Vazyme, Inc., Nanjing, China) treated control group cells served as positive control. Each test had two replicates (n = 3).
2.8 Reverse transcriptionquantitative polymerase chain reaction (RTqPCR)
In each well of a 6-well plate, 2 × 10⁵ Ishikawa cells were cultured as attached monolayers overnight. Cells were treated with 10 ng/mL TNF-α and 25 µg/mL ETA and incubated for 6, 24, or 48 h treatment. Cells were then collected for analysis with RTqPCR. Each test had two replicates (n = 3). A cell total RNA isolation kit (Foregene, Inc., Chengdu, China) was used to isolate total RNA from Ishikawa cells according to the manufacturer's protocol. 2 µg RNA was reversetranscribed into cDNA at 42 °C for 30 min using the All-In-One cDNA Synthesis Supermix (Bimake, Inc., Houston, TX, USA), and the qPCR assay was performed with 0.25 µL cDNA using 2X Supermix (Bimake, Inc.) using the CFX96 Touch System (Bio-Rad Laboratories, Inc., Hercules, CA, USA). The data were analyzed using CFX Manager software (version 3.0; Bio-Rad Laboratories, Inc.) and β-actin gene expression was used as an internal reference. Data were analyzed using the 2-ΔΔCq method. The following primer sequences were used for the PCR: Caspase-8, forward, 5'- GTT GTG TGG GGT AAT GAC AAT CT -3' and reverse, 5'- TCA AAG GTC GTG GTC AAA GCC − 3'; TNFR1, forward, 5'- TCA CCG CTT CAG AAA ACC − 3' and reverse, 5'- GGT CCA CTG TGC AAG AAG AGA − 3'; CRISP2, forward, 5'- AGG ATC CCG CTT TTA CTG CT -3' and reverse, 5'- TGT TAC TGG CAG GTG GAG AG -3'; AQP3, forward, 5'- GGG GAG ATG CTC CAC ATC C -3' and reverse, 5'- AAA GGC CAG GTT GAT GGT GAG − 3'; ENaCA, forward, 5'- TCT GCA CCT TTG GCA TGA TGT − 3' and reverse, 5'- GAA GAC GAG CTT GTC CGA GT -3'; CFTR, forward, 5'- ATG GGA GAA CTG GAG CCT TC -3' and reverse, 5'- CTC GTT GAC CTC CAC TCA GT -3'; LIF, forward, 5'- CCA ACG TGA CGG ACT TCC C -3' and reverse, 5'- TAC ACG ACT ATG CGG TAC AGC − 3'; CRYBB2, forward, 5'- CAA CTT CAC CGG GAA GAT G -3' and reverse, 5'- CGG GGT ACT GGT AGC CAA C -3', and β-actin, forward, 5'- CAT GTA CGT TGC TAT CCA GGC − 3' and reverse, 5'- CTC CTT AAT GTC ACG CAC GAT − 3'. The following PCR conditions were used for PCR: initial denaturation for 1 min at 95 °C; 40 cycles of 95 °C for 10 s and 60 °C for 20 s.
2.9 Statistical analysis
All results are presented as the mean ± standard error of the mean. Statistical analysis was performed using GraphPad Prism 7 Project software (GraphPad Software Inc., San Diego, CA, USA). Quantitative image analysis was performed using Image-Pro Plus 6.0 software (Media Cybernetics, Rockville, MD, USA). Differences were analyzed using one-way analysis of variance followed by the Newman-Keuls post hoc test. P < 0.05 was considered to indicate a statistically significant difference.