Identification of 326 DEMETs in CRC. To identify differentially expressed metabolic enzymes and transporters (DEMETs) and analyze their association with prognosis and tumor biology in CRC, we performed an integrated bioinformatics analysis as seen in Fig. 1. A total of 1,737 differentially expressed genes (DEGs) were firstly identified between CRC tissues and control samples, which includes 780 up-regulated and 957 down-regulated DEGs in CRC in relative to controls (Fig. 2A). By overlapping 1,737 DEGs with 2,752 METs derived from the comprehensive gene list of human METs, we obtained 326 DEMETs in CRC (Fig. 2B). To investigate the role of DEMETs in CRC, we performed KEGG and GO enrichment analyses. DEMETs were significantly enriched into 50 KEGG pathways. Top10 pathways were mainly involved in metabolic pathways, as shown in Fig. 2C, such as drug metabolism - other enzymes, purine metabolism, retinol metabolism, drug metabolism - cytochrome P450, fatty acid degradation, steroid hormone biosynthesis and fatty acid metabolism (Fig. 2C). A total of 680 GO terms were significantly enriched, and we found that the DEMETs were mainly involved in biological processes related to metabolism and transport, such as anion transmembrane transport, organic anion transport, organic acid transmembrane transport, carboxylic acid transmembrane transport, carboxylic acid transport, organic acid transport, small molecule catabolic process, alcohol metabolic process, steroid metabolic process, cofactor metabolic process and so on (Fig. 2D). Top15 enrichment GO terms of molecular function were shown in Fig. 2E, including anion transmembrane transporter activity, active transmembrane transporter activity, and metal ion transmembrane transporter activity, and so on.
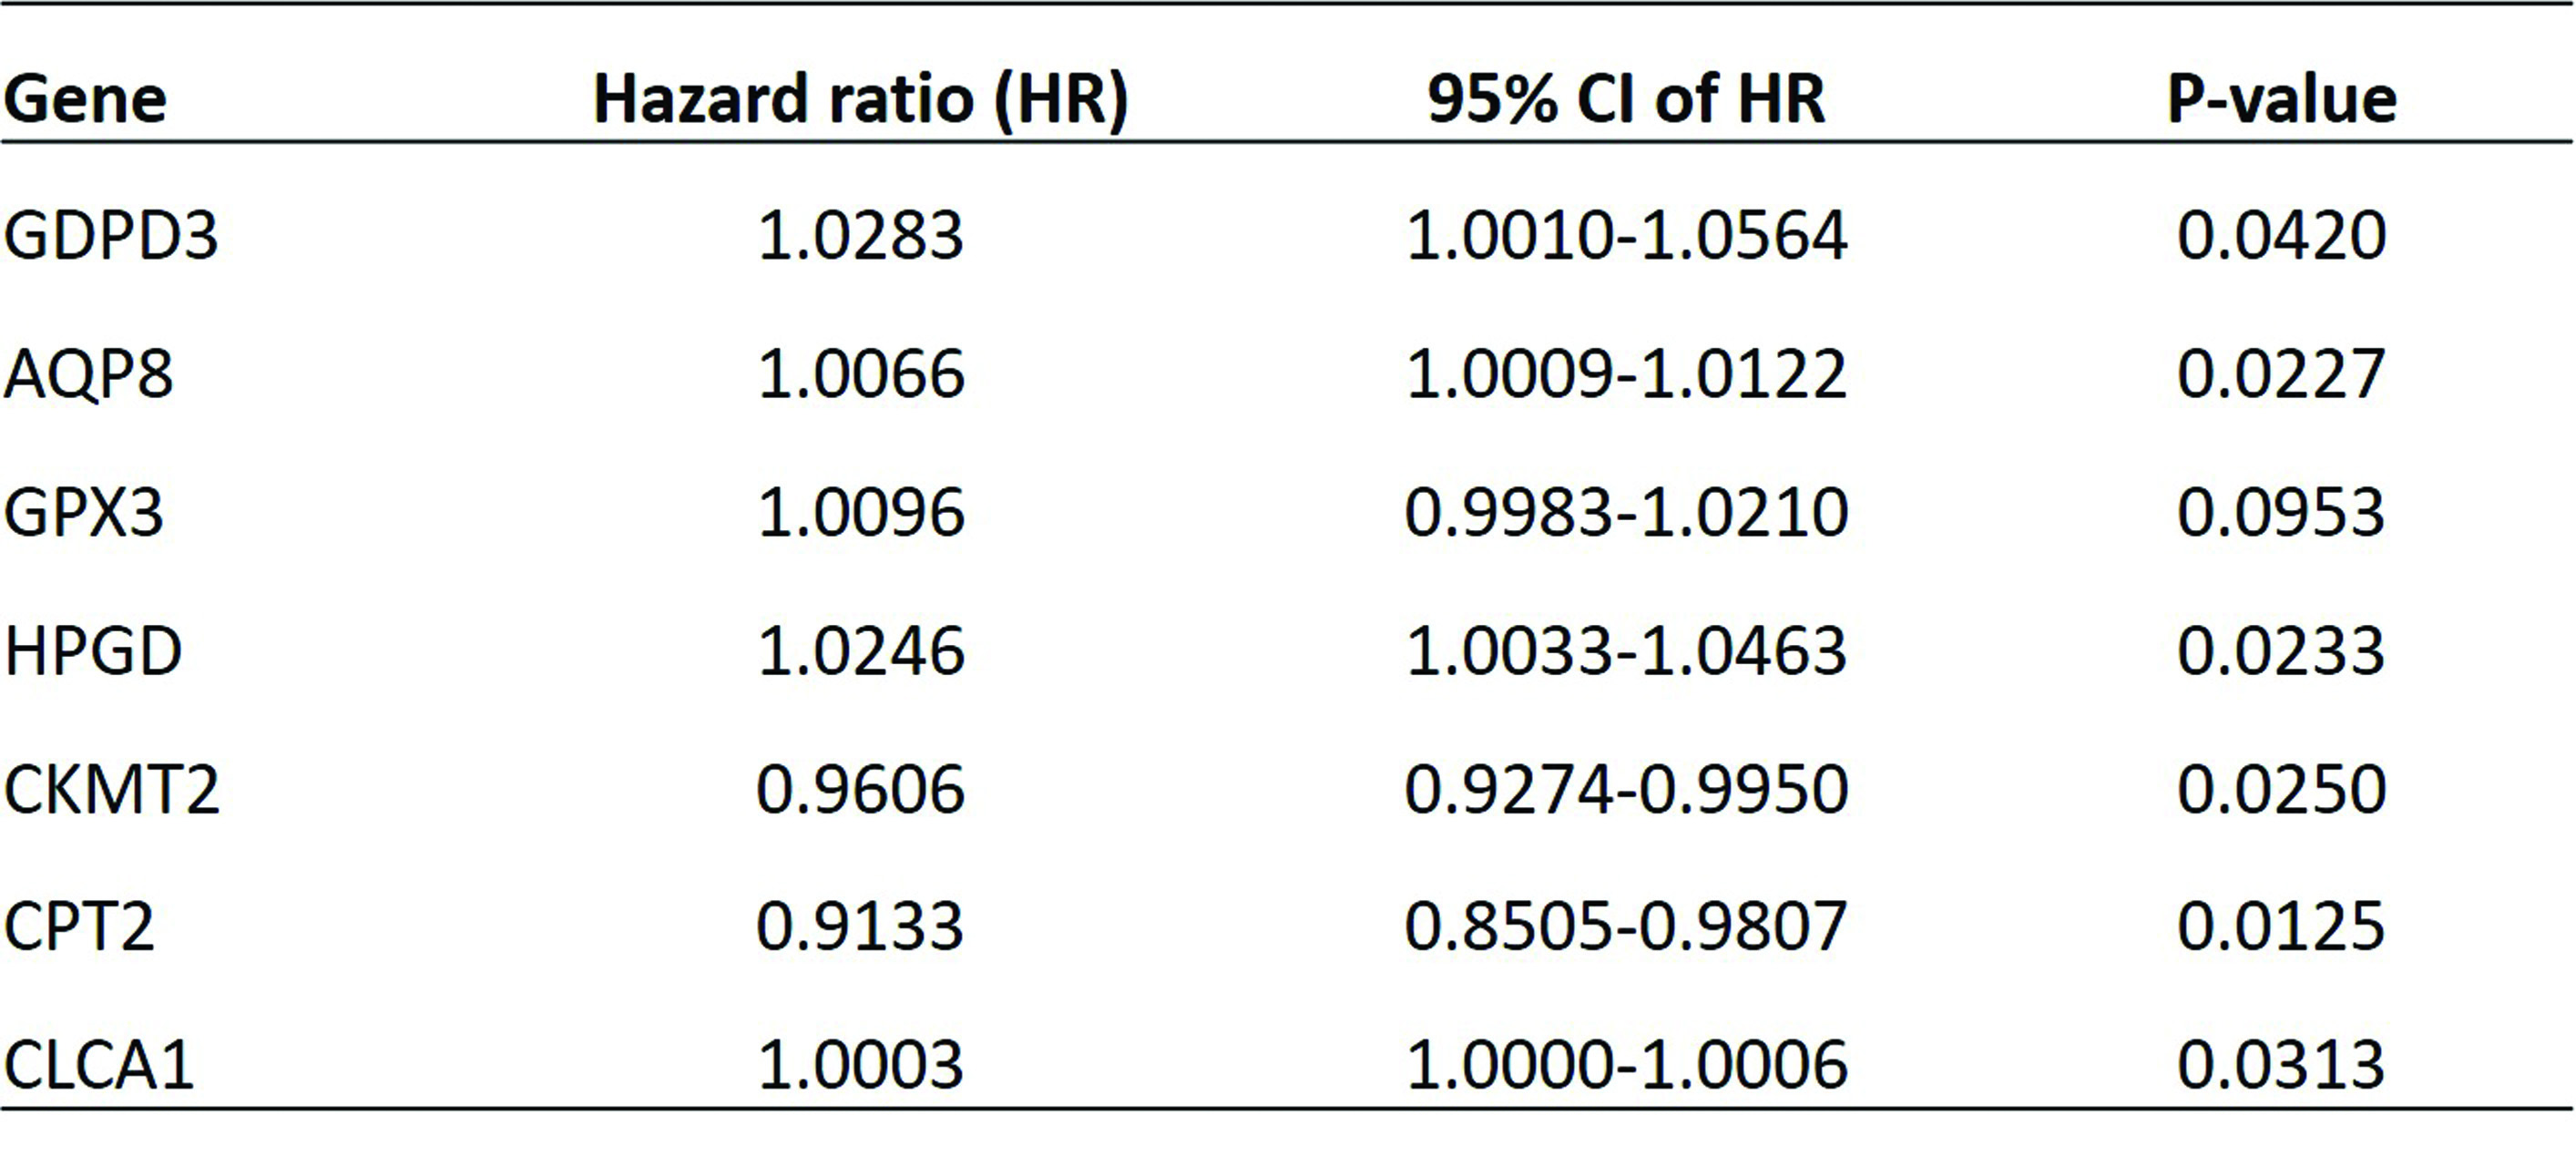
Construction of METs prognostic model for CRC. From the prognostic perspective, we analyzed the 326 DEMETs in the training dataset of TCGA-CRC cohort. As a result, nine METs were selected as most significant prognostic genes, including GDPD3, AQP8, GPX3, HPGD, ADH1B, CKMT2, CPT2, CLCA1 and PPAP2A, by a univariate Cox regression (p < 0.05). To further identify METs with highest predictive value of CRC, these nine METs were subjected to a multivariate Cox regression. It showed seven out of the nine METs comprised of GDPD3, AQP8, GPX3, HPGD, CKMT2, CPT2 and CLCA1, had robust association with prognosis of CRC patients in the training set (p < 0.05) (Table 1).
Thereafter, a genetic risk model was established to calculate risk score of each patient in the training set, to evaluate the prognostic value of this METs signature of seven genes. Based on the median of the risk score, the CRC patients in the training set were divided into high- and low-risk groups. Kaplan-meier analysis showed that patients in low-risk group had better survival rate than patients in the high-risk group (P < 0.01, Fig. 3A). Consistent result was observed when the validation set of TCGA-CRC cohort was subjected to survival analysis (Fig. 3B). To verify whether the 7-gene METs signature presented similar predictive value which can be extended to other CRC cohorts, a repeated analysis was applied to generate the risk score of each CRC patient collected in GSE39528 database. Consistently, it was observed that CRC patients of GSE39528 database in low-risk group had better overall survival tendency in comparison with patients in the high-risk group (P < 0.0001, Fig. 3C). The areas under the ROC curves for 1-, 2- and 3-year were 0.633, 0.632 and 0.632, indicating a good performance of this risk model in the training set (Fig. 3D).
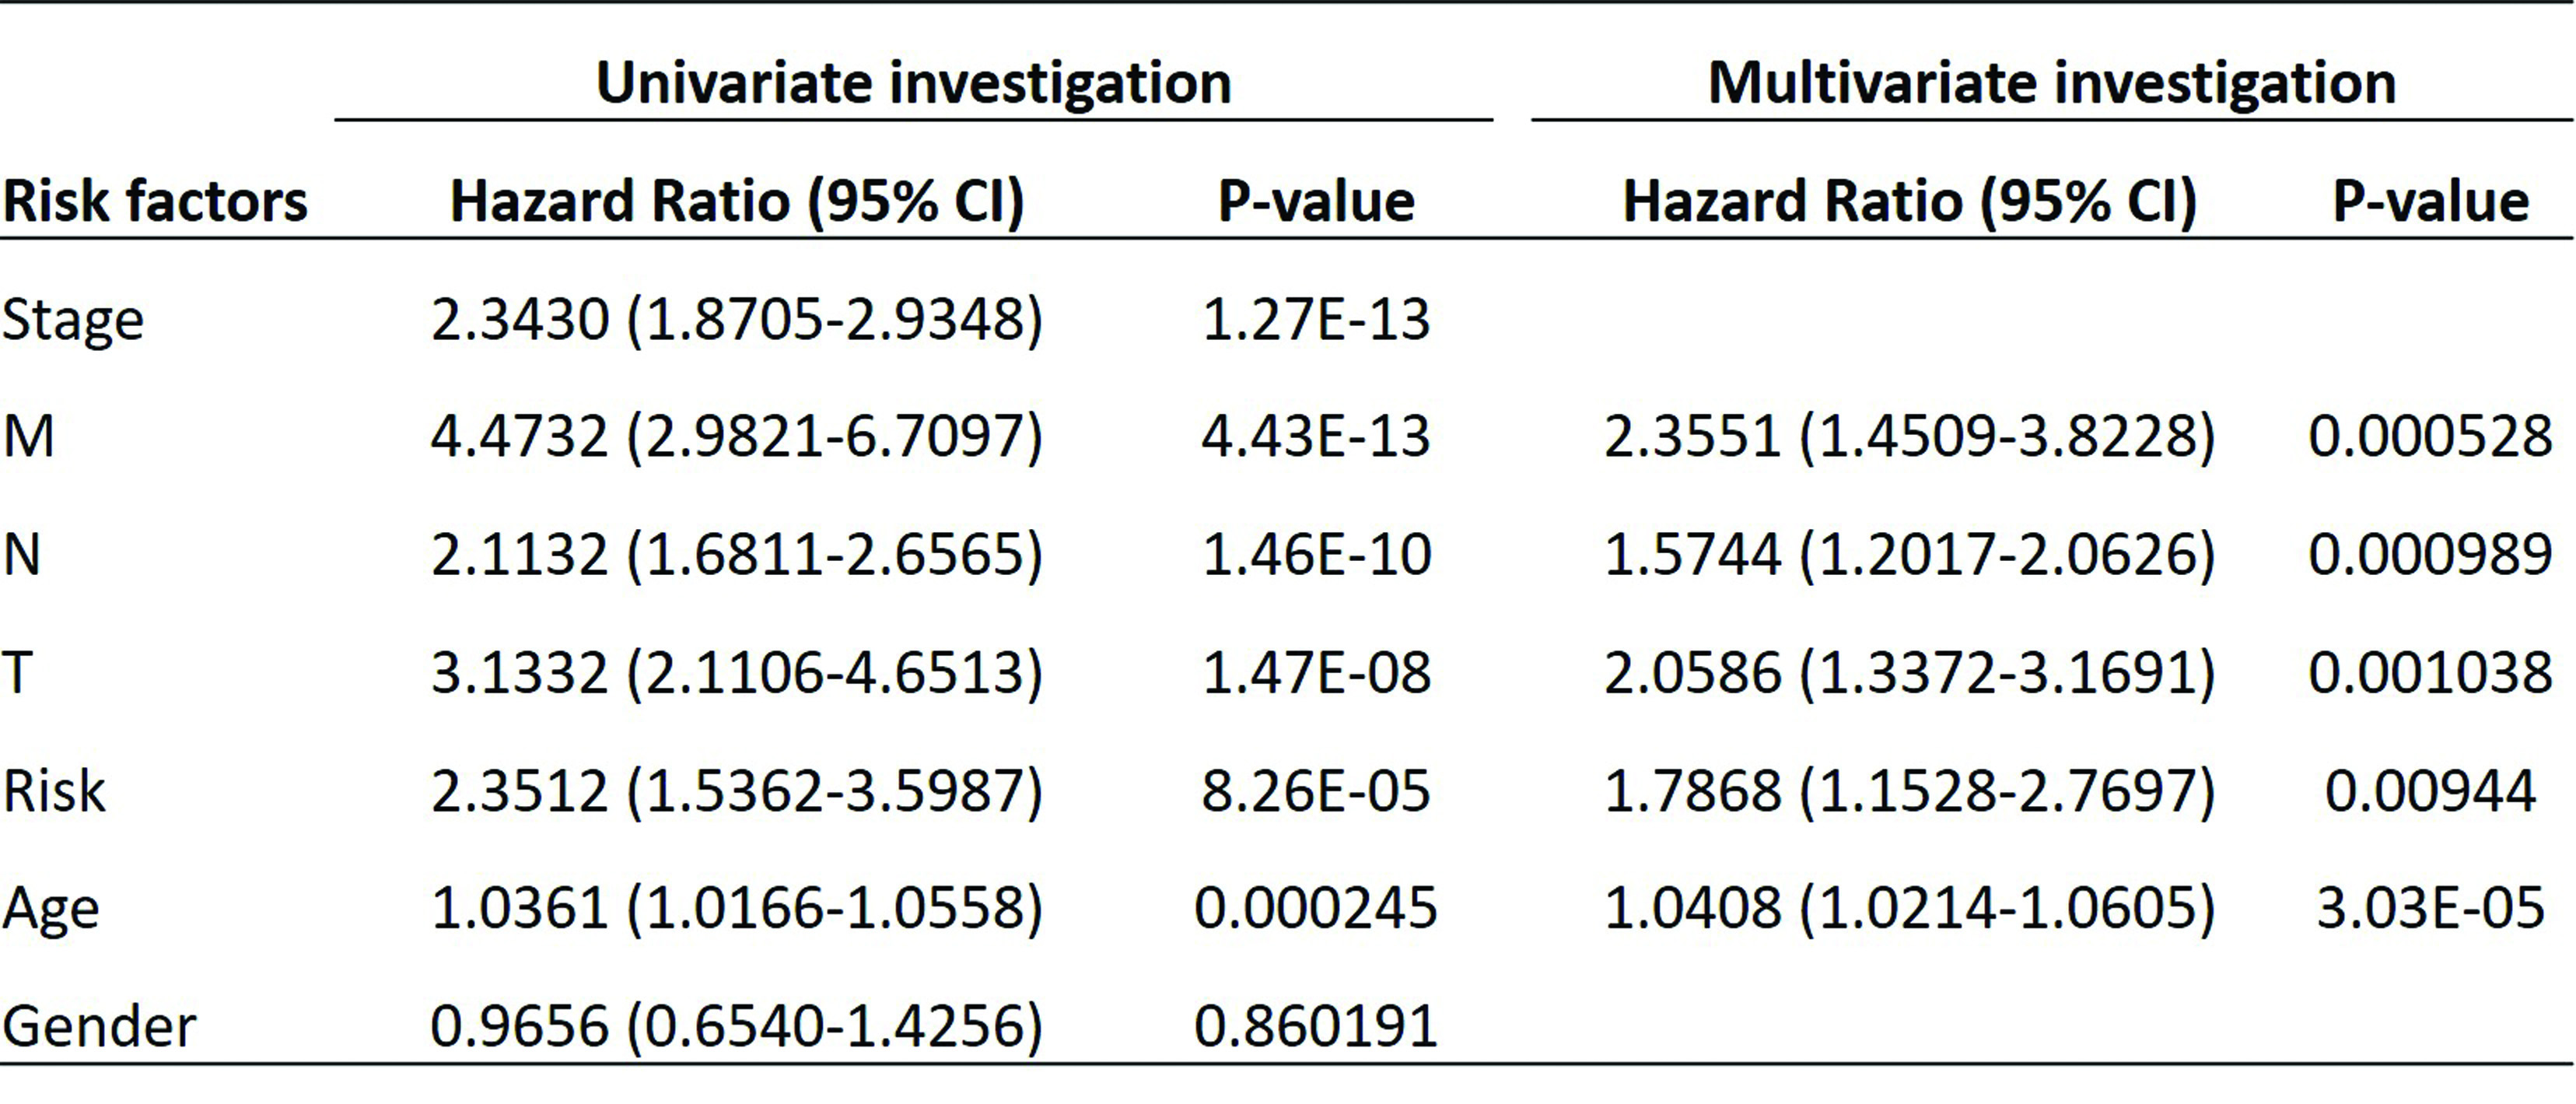
To further confirm the prognostic potential of this genetic risk score model, we combined all patients from the training set and testing set together, and performed univariate and multivariate analyses on the combined dataset to detect independent prognostic factors of CRC (Table 2). By univariate analysis, only gender was excluded since it was not associated with prognosis of CRC (HR 0.965, P = 0.86). In the further multivariate analysis, risk of the 7-gene MET signature exhibited a significant relationship with prognosis of CRC (HR 1.79, P = 0.009), as well as other clinical parameters such as age, TNM stage, indicating the predictive value of the 7-gene MET signature as independent prognostic factor of CRC. Furthermore, we established a prognostic nomogram for OS of CRC patients. As shown in Fig. 3E, the nomogram predicting 1-, 3-, and 5-year OS was built on the basis of the chosen parameters with significant difference based on the above multivariate Cox analysis. The nonogram showed the greatest contributing factor to prognosis was the age, followed by T, N, M and high-risk group. Through adding all these values and placing them into the total-point scale, the survival probabilities were calculated. The correction curve was then drawn based on the above prediction model. The C-index of this nomogram indicating OS, was 0.7729. The calibration plots presented an optimal agreement between the outcomes predicted by the nomogram and those actually observed in terms of the 1-, 3-, and 5-year OS. After calculation, the slope of 1-, 3- and 5-year is 0.7936, 0.5742 and 0.3453 respectively, indicating that the prediction effect is the best at 1-year (Fig. 3F).
GSEA revealed immune-related gene sets between high- and low-risk groups of METs signature. To better understand the underlying mechanisms of prognostic METs biomarkers in regulating CRC development, we analyzed the dysregulated genes between high- and low-risk groups by Gene Set Enrichment Analysis (GSEA), and found a total of 82 KEGG pathways and 2092 GO terms were significantly enriched. Among the top 10 KEGG pathways, except peroxisome pathway, cell adhesion molecules CAMs, complement and coagulation cascades, cytokine/cytokine receptor interaction, ECM receptor interaction, focal adhesion, graft versus host disease, system lupus erythematosus and viral myocarditis were all upregulated (Fig. 4A). As for GO terms ((Fig. 4B), some immune-related gene sets were enriched, such as adaptive immune response, adaptive immune response based on somatic recombination of immune receptors built from immunoglobulin superfamily domains, blood microparticle, indicating that immune plays an important role in prognostic MET regulated CRC.
Different tumor immune microenvironment between low- and high-risk groups. Based on the GSEA analysis, we hypothesized that the tumor immune microenvironment of low- and high-risk groups was different. Thus, we analyzed the immune infiltration between two groups by ssGSEA. Except activated CD4 T cells, activated CD8 T cells, CD56bright natural killer cells, effector memory CD4 T cells, immature dendritic cells, monocytes, neutrophils, type 17 T helper cells and type 2 T helper cells, 19 immune cells were significantly infiltrated into low- and high-risk groups (Fig. 5A). Moreover, we found that the expressions of prognostic MET biomarkers were strongly correlated with at least the abundance of three immune cell types (Fig. 5B), further suggesting the close relationship between MET and immune. In addition, the expressions of CD27, CD274, HAVCR2, LAG3, PDCD1LG2 and TIGIT were remarkably different between low- and high-risk groups (Fig. 5C). All of the above results demonstrated that the immune microenvironment was different between low- and high-risk groups, which may lead to different immunotherapeutic response. Therefore, TIDE was applied to predict the response of two groups to immunotherapy, and indeed different TIDE scores were observed (Fig. 5D). Due to immune checkpoint inhibitors targeting PD-1/PD-L1/CTLA4 are hot topics in the treatment of advanced malignant tumors, we also used SubMap algorithm to predict the likelihood of different subtype responding to immunotherapy. As shown in Fig. 5E, patients in high-risk group seems to be more sensitive to the treatment of CTLA4 inhibitors.
Gene mutation analysis in the high- and low-risk groups. Abnormally gene mutation is one the main reasons resulting in tumorigenesis and tumor progression15,16. Multivariate regression analysis showed that there were four somatic mutations among those seven genes, including missense mutation, truncating mutation, amplification and deep deletion (Fig. 6A). To study the differences in gene mutations between the high- and low-risk groups, somatic processes were downloaded from the GDC database. The high- and low-risk samples in the file were respectively proposed and processed by MAftools R package. The top ten genes with higher mutation frequency in the high-risk group were TP53, APC, TTN, KRAS, SYNE1, MUC16, PIK3CA, FAT4, CSMD1 and DNAH11 (Fig. 6B). While, APC, TP53, TTN, KRAS, MUC16, PIK3CA, SYNE1, FAT4, SYR2 and OBSCN were the top 10 genes frequently mutated in the low-risk group (Fig. 6C). Next, in order to study the difference in mutation frequency of genes in the high- and low-risk groups, we used Fisher's test to analyze the frequency of mutations in each gene in the high- and low-risk groups, respectively, resulting in a total of 539 genes significantly mutated. The top 10 genes were MUC16, FAT4, BDP1, CMYA5, ZNF735, CENPE, SLITRK2, ZNF208, CFAP46 and ALDH1A2, as shown in Fig. 6D (p < 0.05). However, whether these gene mutations have biological function in CRC development or not should be validated by in vitro and in vivo experiments.
Construction of the pharmacological network. To further explore the clinical value of the seven-gene prognostic MET biomarkers, DGIdb and TCMSP database were used to search for potential traditional Chinese herbs that may be used in the treatment of MET-mediated colorectal cancer patients. Firstly, 244 compounds were predicted to interact with AQP8, HPGD, CPT2 and CLCA1 by DGIdb. Thereafter, those 244 compounds were input into the TCMSP database, and a total of 115 herbs corresponding to 38 compounds, which interact with HPGD were identified. Thus, a pharmacological network composed of HPGD, 38 compounds and 115 herbs were constructed by Cytoscape software (Fig. 7).