Clone and analysis of SmERF1
According to the unigene (unigene-25151) sequence from our transcriptome data[28], we isolated the cDNA sequences of SmERF1 from S. miltiorrhiza with accession number: KC405081.1. Multiple sequence alignments were performed using ClustalW2 (https://www.ebi.ac.uk/Tools/msa/clustalw2/), and the results were rendered using the Boxshade Server. The conserved domain of SmERF1 was searched using the Conserved Domain Search Service (https://www.ncbi.nlm.nih.gov/guide/domains-structures/). The subcellular location of SmERF1 protein was predicted with WoLF PSORT (https://wolfpsort.hgc.jp/). The phylogenetic tree was constructed with MEGA X software using a Maximum Likelihood (ML) method based on an JTT model, and 500 bootstrap test replicates were used during the construction with other parameters as default[55].
Plant Materials
Mature seeds of S. miltiorrhiza Bunge were surface sterilized as described previously (Yan and Wang, 2007) and cultured on MS basal media (Murashige and Skoog, 1962) for germination. One-month-old seedlings were used for RNA isolation.
Tobacco (Nicotiana tabacum) plants for agroinfiltration were grown in a growth chamber at 22 °C under 16 h of light for 6 weeks. One-month-old tobacco plants were used for transient transformation. Seeds (T2 generation) collected from SmERF1-expressing tobacco plants were surface-sterilized with 25% bleach and planted on Murashige–Skoog (MS) medium for germination, then transplanted into soil and maintained at 25 °C with a 16 h light/8 h dark cycle. Seedlings after transplant were used for treatments and various tests.
Extraction Of Rna, Cdna Synthesis
Genomic DNA was isolated from young leaves of 2-month-old S. miltiorrhiza seedlings or tobacco seedlings with the Biospin Plant Genomic DNA Extraction Kit (BioFlux, China). Total RNA was extracted from transgenic tobacco and wild type plants, using BIOZOL reagent (BIOER, Hangzhou) according to the manufacturer’s instructions. The quality and concentrations of genomic DNA and RNAs were determined by 1.0% agarose gel electrophoresis and analysis on a spectrophotometer (SHIMADZU UV-2450, Japan). cDNA was synthesized with Revert Aid First Strand cDNA Synthesis Kit (Takara, Dalian).
Plant Transformation And Transgenic Plant Verification
We cloned the SmERF1 sequence with the attB recombination sites and inserted into pDONOR221 via the Gateway BP clonase (Invitrogen Corporation) reaction to create entry clones. Then, the sequence was moved into the destination vector pEarleyGate100 using Gateway LR clonase (Invitrogen Corporation) to create the expression vector (pO-ERF). The new constructs of the pO-ERF vector were transformed into Agrobacterium tumefaciens strain GV3101 via a freeze-thaw method[56]. Then, the transient transformation of tobacco leaves was accomplished according to Sparkes et al. [57]. The expression vector pO-ERF contained a Basta resistance selection marker; therefore, transformants were selected on 1/2 strength MS medium supplemented with IBA 0.5 mg/L and Basta 10 mg·mL− 1.
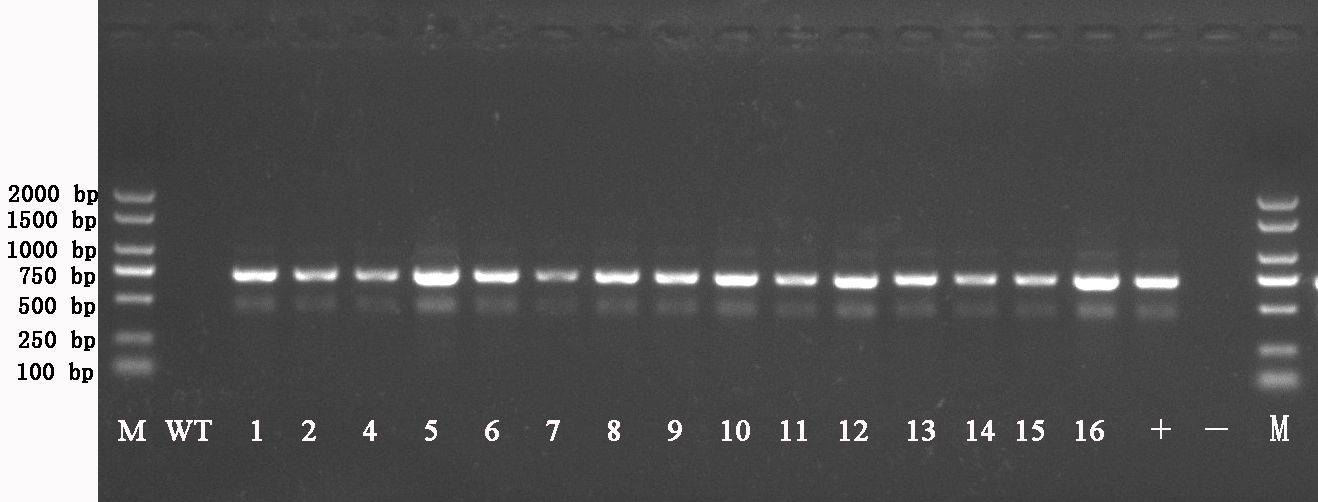
To determine whether the recombinant vector was inserted into the plant, we detected the CaMV35S promoter sequence in all transgenic tobacco lines (T0, T1 generation) by qPCR, primers were shown in Table 1.
Table 1
Primers used in this study
| Genes (GenBank Accession) | Sequence |
| SmERF1 (for clone and vector construction) | 5′-GGGGACAAGTTTGTACAAAAAAGCAGGCTTC GCCTAGCTCACATAATGACGTTCGA-3′ (attB sites was underlined) 5′-GGGGACCACTTTGTACAAGAAAGCTGGGTC CGACGTTAATTACTGTAAGCCGACTTC-3′(attB site was underlined) |
| SmERF1 (for qPCR) | 5′-GCCTAGCTCACATAATGACGTTCGA-3′ |
| | 5′-CGACGTTAATTACTGTAAGCCGACTTC-3′ |
| CAMV-35 | 5′-AATCTTCGTCAACATGGTGGAGC-3′ |
| | 5′-GCTGTCGTCGCCGGAGAATA-3′ |
| NtActin | 5′- CGTTATGGTTGGAATGGGACAGAA-3′ |
| (U60495.1) | 5′- AAGAACAGGGTGCTCCTCGTGG-3′ |
| NtSDR (AJ223177.1) | 5′- GAAGAGGAGGTCGCAAAGGCA-3′ 5′- CACTGATGGGTATTTTCGGATGAGA-3′ |
| NtGA2Oox (JQ413251) | 5′- GAAACCAGACCTCACTTTAGGGACA-3′ 5′- TGAAAGAGCCATAAATGTATCGCCT-3′ |
| NtACS (NM_001326220.1) | 5′- TCGGGCTCGTTTCAACACAGA-3′ 5′- GAACATCCCGTGTCTTTTCCCTA-3′ |
| NtACO (NM_001325967) | 5′- TCCAAGATGACAAAGTAAGCGGC-3′ 5′- TGTTTGCTCTCCGCTGCCTC-3′ |
Transgenic and wild-type tobacco lines with good growth for approximately 6 weeks in tissue culture were transplanted to the artificial culture room after seedling refining. The culture temperature was 24 °C, the humidity was 60%, and the light/darkness was 14/10 h.
Expression analyses of SmERF1 in transgenic tobacco
After selective culture, the transgenic plants were transferred to MS culture. Approximately 6 weeks after subculture, young seedlings (T0 generation) were transplanted into humus soil. Seeds (T1 and T2 generation) were collected when they were mature. The sizes of T2 seeds were observed with a stereomicroscope. The thousand seed weights of tobacco transgenic lines were also evaluated.
Detection of ABA and GA levels in transgenic plants of tobacco (T2)
Whole plant samples were collected from each transgenic plant. The contents of ABA and GA were detected according to the manuals of ELISA kits from ShaanXi Maiyuan Biotechnology Co., Ltd.
Detection of chlorophyll content of transgenic plants of tobacco (T2)
Two-week seedlings after germination of T2 generation seeds were used to calculate biomass and detecte the chlorophyll content. Chlorophyll (Chl) content was measured according to the method described by Frank et al. with slight modification[58]. Briefly, 200 mg of fresh seedlings was collected and ground with sterile mortar and pestle. The samples were transferred into 10 mL tubes, and then 10.0 mL of 80% acetone was added. After mixing well, the tubes were stratified at 4 °C for 24 h. The samples were centrifuged at 12000 g at 4 °C for 3 min, and then the OD value of the supernatant was assayed with a spectrophotometer (SHIMADZU UV-2450, Japan) at 665 nm and 649 nm wavelengths. Chlorophyll content (a & b) was calculated using the following formulas where A is the absorbance[59]: Chl (a) = 13.95 × A665–6.88 × A645; Chl (b) = 24.96 × A649–7. 32 × A665.
Resistance Analyses Of Transgenic Tobacco
The seeds of the T1 generation of transgenic and wild-type tobacco were germinated on filter paper. When the seedlings grew to approximately 1 cm in size, they were transplanted into the sowing and seedling substrate, one in each pot, cultivated in the artificial culture room, and watered once every 3 days. Two months after transplantation into the soil, the tobacco seedlings were watered with 400 mmol/L NaCl solution every other day. After 7 days of treatment, the growth states of the tobacco lines were observed, and the aerial parts of these seedlings were quickly frozen with liquid nitrogen for the detection of physiological indexes as follows.
The activities of catalase (CAT, EC 1. 11. 1. 6), peroxidase (POD, EC 1. 11. 1. 7) and superoxide dismutase (SOD, EC 1. 15. 1. 1)were assayed using the CAT Assay Kit (A007–1, Nanjing Jiancheng, Nanjing, China), Plant POD Assay Kit (A084–3, Nanjing Jiancheng, Nanjing, China) and Total SOD Assay Kit (S0102, Nanjing Jiancheng, Nanjing, China), respectively, as described by Shi et al.[60, 61]. The MDA content was extracted using thiobarbituric acid reagent, and quantified by determining the absorbance of the supernatant at 450 nm, 532 nm and 600 nm as previously described[61].
Quantitative Real-time Pcr (qrt-pcr)
The quantitative reactions were performed on an IQ5 real-time PCR detection system (Bio-Rad), using SYBR® Premix Ex Taq™ (Perfect Real Time) (TaKaRa). PCR amplifications included the following conditions: 50 °C for 2 min and 95 °C for 30 s, followed by 40 cycles of 95 °C for 10 s and 60 °C for 30 s. Gene-specific primers for qPCR are listed in Table 1. Nicotiana tabacum actin (Accession No. U60495.1) was used as an internal control. Their relative expression was calculated via the 2−ΔΔCt method [62]. Each sample was collected from five independent plants. Three independent biological replicates were used for each plant sample. Each data point represents the average of three experiments.
Data analysis
Data were analyzed using one-way analysis of variance (ANOVA) followed by the Turkey-Kramer test (P < 0.05) using SPSS software (version 19.0). Levels of statistical significance were marked with *P < 0.05, **P < 0.01 and ***P < 0.001.