Data characteristics:
The TCGA LUSC contains 553 samples including 502 primary tumor samples and 51 solid adjacent normal tissue samples. Among the 502 tumor samples, 386 have recurrence event information. All the 51 solid adjacent normal tissue samples have matched tumor tissue samples with 40 samples have recurrence event information. We downloaded three datasets from GEO including GSE8894, GSE30219, and GSE37745. GSE8894 contains 133 samples including 75 lung squamous cell carcinoma samples and 63 other types of lung cancer samples. All of the 75 squamous cell carcinoma samples have recurrence event information. GSE30219 contains 61 lung squamous cell carcinoma samples, 232 other types of lung cancer samples, and 14 normal tissue samples. 60 lung squamous cell carcinoma samples have recurrence event information in GSE30219. GSE37745 contains 66 squamous cell carcinoma samples and 130 other types of lung cancer samples while only 30 of the 66 squamous cell carcinoma samples have recurrence event information.
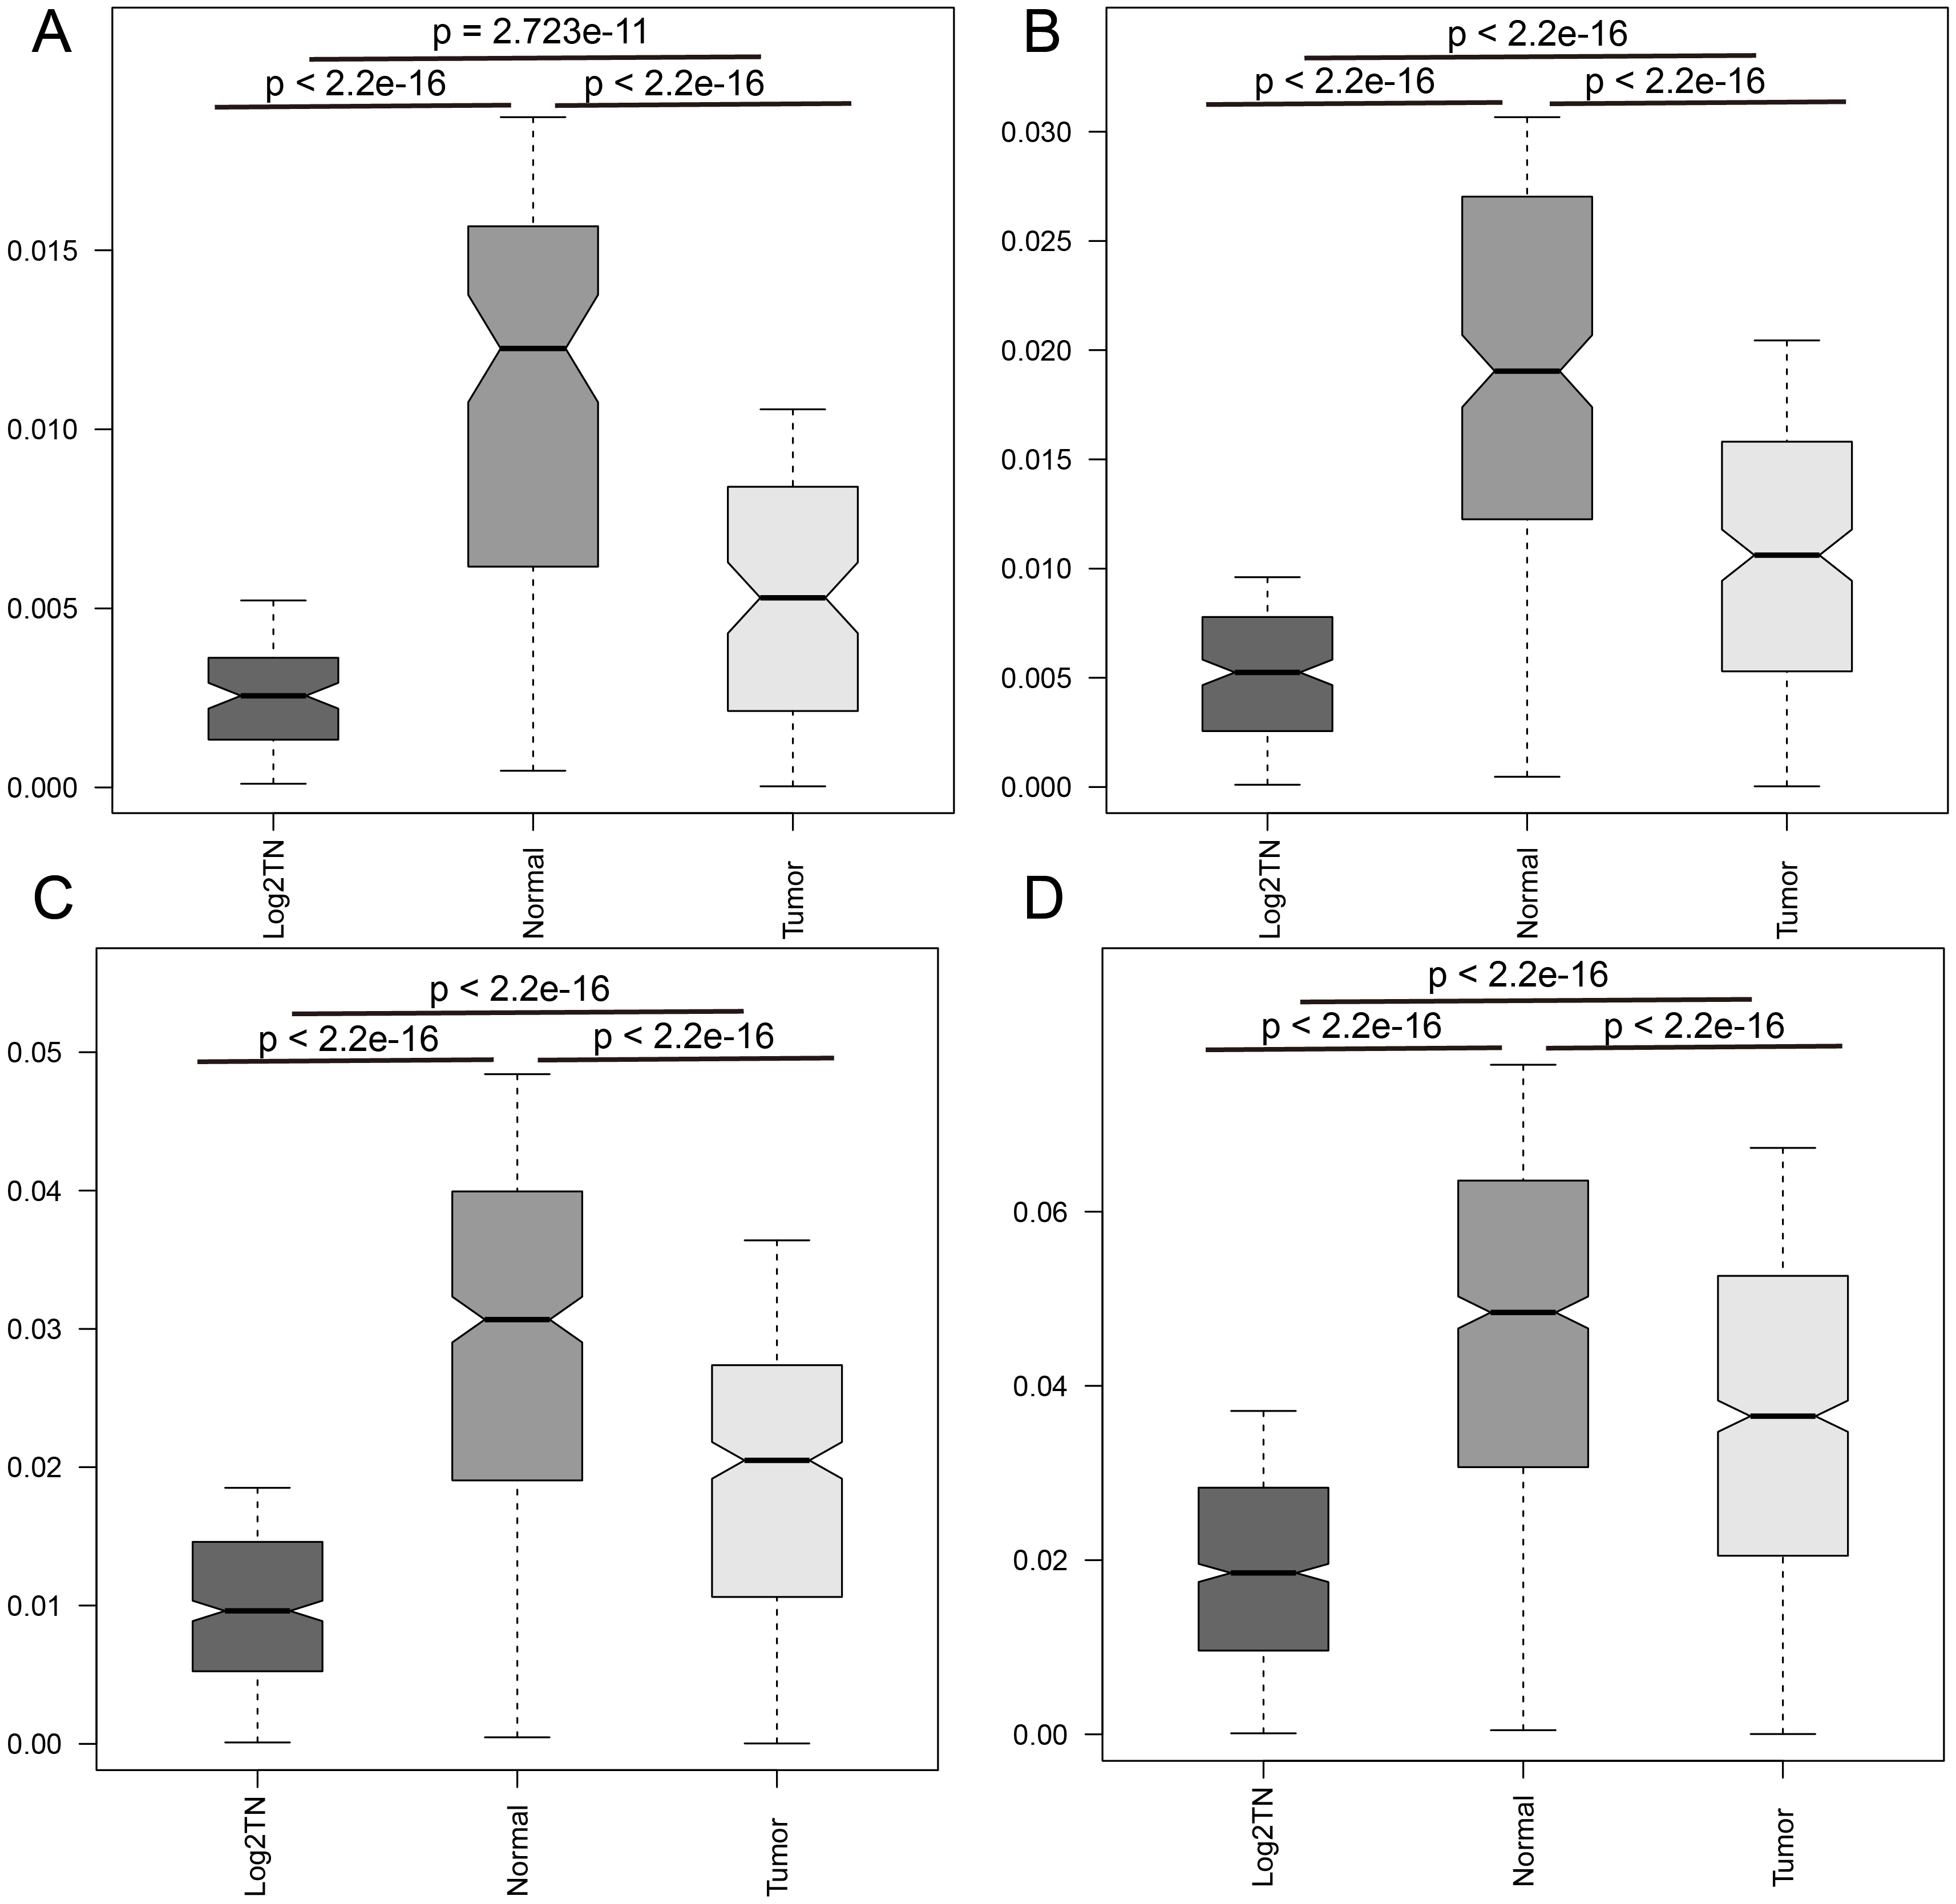
Genes explored via Log2TN are more robust and significant:
In the TCGA LUSC dataset, we selected the 40 tumor-normal paired sample with recurrence event information and calculated Log2TN for every gene. Then univariate Cox regression analysis was performed for each gene using Log2TN, expression profile of tumor tissue, and expression profile of normal tissue within these 40 individuals respectively. For the three datasets from GEO, even if only the expression profile of the tumor is available, we performed univariate Cox regression analysis for each gene using the tumor-derived expression profile in each dataset. Significant genes were picked out using P < 0.05. Then we investigated the overlapping between the TCGA LUSC and the other three datasets. Significant genes in TCGA LUSC dataset in anyone of the three datasets of GEO are defined as overlapped genes. The overlapping of significant genes between the TCGA LUSC dataset and the other three datasets are shown in Table 1.
Table 1
Overlapping between TCGA LUSC and three datasets from GEO
|
Positive coefficient
|
| |
All
|
Remaining
|
Overlapped
|
Ratio
|
P-value
|
|
Tumor
|
373
|
345
|
28
|
0.075
|
T-N: p = 0.871
T-L: p = 0.757
N-L: p = 0.722
|
|
Normal
|
214
|
199
|
15
|
0.070
|
|
Log2TN
|
231
|
213
|
19
|
0.082
|
|
Negative coefficient
|
|
Tumor
|
196
|
189
|
7
|
0.036
|
T-N: p = 0.622
T-L: p = 0 .012
N-L: p = 0.064
|
|
Normal
|
203
|
193
|
10
|
0.049
|
|
Log2TN
|
840
|
765
|
75
|
0.089
|
|
All
|
|
Tumor
|
569
|
494
|
75
|
0.132
|
T-N: p = 0.641
T-L: p = 1.000
N-L: p = 0.616
|
|
Normal
|
417
|
365
|
61
|
0.146
|
|
Log2TN
|
1071
|
929
|
142
|
0.133
|
| T-N: Tumor versus Normal; T-L: Tumor versus Log2TN; N-L: Normal versus Log2TN; p: Fisher's exact test |
For the genes with the Cox regression coefficient below zero, although the overlapping ratio of Log2TN is higher, it is not significant (Tumor versus Log2TN, p = 0.757; Normal versus Log2TN, p = 0.722, Fisher's exact test). For the genes with the Cox regression coefficient above zero, the overlapping ratio of Log2TN is significantly higher than the tumor (p = 0.012, Fisher's exact test). When contrasted with normal, the p-value is on the verge of significant (p = 0.064, Fisher's exact test). When combined with the two parts above, there is no difference. When compare the overlapping ratio of tumor and normal, there is no difference. Though there is no huge advantage on overlapping ratio for Log2TN, considering the Cox regression coefficient sign, the Log2TN is more robust, as shown in Table 2.
Table 2
Overlapped genes of consistent and inconsistent sign
| |
All
|
Consistent sign
|
Inconsistent sign
|
P-value
|
|
Tumor
|
75
|
35
|
40
|
T-N: p = 0.602
T-L: p = 0.006
N-L: p = 0.001
|
|
Normal
|
61
|
25
|
36
|
|
Log2TN
|
142
|
94
|
48
|
| T-N: Tumor versus Normal; T-L: Tumor versus Log2TN; N-L: Normal versus Log2TN; p: Fisher's exact test |
For the tumor, there are 28, 7 overlapped genes with the Cox regression coefficient above and below zero respectively. When combined with the genes with the coefficient above and below zero together, there are 75 genes, which means there are 40 genes with opposite Cox regression coefficients in TCGA LUSC and the three datasets. That means a good outcome with high (low) expression level of a gene in TCGA LUSC while poor outcome with high(low) expression level of that gene in the other three datasets. Log2TN has fewer genes of inconsistent compared with tumor and normal (Tumor versus Log2TN, p = 0.006; Normal versus Log2TN, p = 0.001, Fisher's exact test; Tumor versus Normal, p = 0.602). It is indicated that genes obtained via Log2TN are more robust.
Furthermore, we investigated the p-value of all genes between tumor, normal, and Log2TN. We found that p-value of Log2TN was lower than normal and tumor (Log2TN versus tumor, 0.495 versus 0.519, p = 3.08 × 10⁻¹⁵; Log2TN versus normal 0.495 versus 0.512, p = 4.01 × 10 − 8, Student's t-test). The p-value of normal was lower than that of the tumor (Normal versus tumor, 0.511 versus 0.519, p = 0.013, Student's t-test). Then we selected the top 100, 200, 400, and 800 low p-values from each of them and compared them using Student's t-test. As shown in supplementary Fig. 1, p-value of Log2TN was the lowest.
Cox regression model based on the consistent genes obtained via Log2TN is robust:
We acquired 35, 25, 94 consistent genes from tumor, normal and Log2TN respectively. The 40 tumor-normal paired samples in the TCGA LUSC dataset were used in the following analysis. For each of them, we selected the top 25 significant genes for further analysis. In the following analysis, we ran the same process for tumor, normal, and Log2TN using the corresponding expression value, for example, when using the 25 genes from normal, we used the expression profile from normal. First, factor analysis (FA) was performed to find out the nonredundant genes. Eigenvalues above zero was used to confirm the number of factors. Then, we selected the genes with the absolute value of factor loading above 0.5. At last, the LASSO was used to identify the prognostic genes and built the Cox regression model. For Log2TN, 10 factors were retained. In the 10 factors, there were 22 genes with the absolute value of factor loading above 0.5. Then after the LASSO selection, 14 genes (ZNF275, PODXL2, SLCO4C1, POMZP3, ACAD11, MAPK4, BCAR3, DKKL1, FRK, TRPM3, NRP1, PAEP, KLHL13, HRSP12) remained to build the Cox regression model. As shown in Table 3, the likelihood ratio test p-value of the model is 4.57e-05. For Tumor, at last, there were 12 genes (TNFRSF10A, PYGB, OSBPL10, LRRN4, HHIP, ZBED2, CECR6, MBOAT2, ZNF45, SLC14A1, C4orf26, XRRA1) kept for building the Cox model (p = 0.01052, likelihood ratio test). For normal, 11 genes (ITGB6, UNC80, TMEM92, VPS37D, KCNB1, FHDC1, CNR1, TIGD6, SLC16A4, LIX1, ARMC9) were left to build the Cox model (p = 1.044e-08, likelihood ratio test).
Table 3
Selected genes based Cox models in four datasets
| |
Factor number
|
Gene
Number
|
TCGA
LUSC
|
GSE8894
|
GSE30219
|
GSE37745
|
|
Log2TN
|
10
|
14
|
4.57 × 10− 5
|
0.00394
|
1.03 × 10− 5
|
0.0412
|
|
Tumor
|
10
|
12
|
0.0105
|
0.3082
|
0.0239
|
0.0528
|
|
Normal
|
8
|
11
|
1.04 × 10− 8
|
0.0171
|
0.0564
|
0.0154
|
| Values in the last for columns were likelihood ratio test p-value of cox regression. |
Then, we tested the selected genes in the three datasets from GEO for each of them. The selected genes were used to build the Cox regression model in each of the three datasets. The results were summarized in Table 3. Although the expression profile of tumor tissue was used to build the Cox model in the three datasets from GEO (only expression profile was obtained), we found that genes selected via Log2TN had the best performance. The Cox regression models based on these genes in the four datasets were all significant. In GSE8894 and GSE30129, Cox models based on these genes were the most significant. In GSE37745 and TCGA LUSC, the Cox models of normal based genes got the lowest p-value while the Log2TN based Cox models were the second. For each Cox model in each dataset, we calculated the prognostic index (PI) for each sample. We divided a dataset into two groups with the median of PI as the cutoff. Then, Kaplan-Meier curves were drawn and p-values were obtained by the log-rank test. The results of the three conditions in four datasets were shown in Fig. 1. The significant level of them was summarized in supplementary table 1. Except the TCGA LUSC, Log2TN based Cox models in the three datasets from GEO got the most difference between the two survival curves. It is unbelievable that tumor-derived genes from TCGA LUSC got the worst performance in the three datasets of GEO while the expression profile of the three datasets was tumor-derived. It seems that the adjacent-normal tissue of tumor plays an important role in the progress of tumor. Maybe even if it is adjacent-normal tissue, something has happened, which makes it not the same as the non-tumor normal tissue. Hence, Log2TN that calculated based on adjacent-normal and tumor could get the most robust genes.
In the previous analysis of this study, we used only the 40 tumor-normal paired samples with recurrence event information in TCGA LUSC because Log2TN needed paired samples to calculate the value. For comparable, these 40 tumor samples were used for tumor and normal too previously. To test the robustness of the selected genes via tumor, normal, and Log2TN, we built the Cox model with the 386 tumor samples that have recurrence information in the TCGA LUSC using tumor-derived expression profile based on the selected genes for them respectively. For normal-derived genes, it was not significant (p = 0.461, likelihood ratio test). It is reasonable because genes were selected based on the expression profile of normal while tested using tumor-derived expression profile. However, compared to the tumor, Log2TN derived genes got a more significant Cox model (tumor: p = 0.0315, Log2TN: p = 0.0191, likelihood ratio test). For each of the three models, we calculated the PI and divided the 386 samples into two groups using median of PI. Then, we drew Kaplan-Meier curves and assessed the difference between two survival curves using log-rank test. As shown in Fig. 2, although it isn't significant in the Cox model using normal-derived genes, the survival curve is discriminating. The power of their distinguishing for survival is almost the same. Thus, not only the tumor tissue, but also the adjacent-normal tissue may influence the outcome.
Gene set enrichment analysis of Log2TN genes:
Log2TN derived genes show the best robust performance. Thus we investigated the biological functions of genes ranked according to Log2TN univariable Cox regression via gene set enrichment analysis of KEGG pathways. For each gene, we multiply the sign of coefficient by -log10 of the p-value as its prognosis score. For example, if the coefficient and p-value of the Log2TN univariable Cox regression for a gene is -0.35 and 0.01, the score for this gene − 1 * (-log(0.01, 10)) = -2. Then, we ranked genes with this score and performed GSEA analysis. As shown in Fig. 3, these positively correlated pathways include multiple biological pathways, such as cell cycle, DNA replication, homologous recombination, ribosome, primary immunodeficiency, and p53 signaling pathway. The high-level Log2TN of genes in these pathways results in worse outcomes. These negatively correlated pathways mainly include metabolism-related pathways such as complement and coagulation cascades, fatty acid metabolism, retinol metabolism, primary bile acid biosynthesis, tryptophan metabolism, drug metabolism cytochrome P450, valine leucine and isoleucine degradation, and glycine serine and threonine metabolism. It seems that the tumor cells mainly focus on proliferation with losing functional metabolism.