Cell culture
Placentas were acquired from pregnancies at full term through caesarean delivery with parental permission. Every procedure was performed according to ethical requirement by the Affiliated Hospital of Qingdao University, China. CV-MSCs used were between passages 3 to 6. Briefly, the placental fetal part was sliced into roughly 1 mm3 pieces and washed by PBS. Tissue were digested by trypsin (0.25%) and collagenase I (0.1%) (Sigma-Aldrich, St. Louis, MO), followed by incubation at 37°C for half an hour. Following nylon filter filtration and centrifugation, the cells were seeded in a stem cell culture medium (SCCM), supplemented with Stem Cell Basic Medium (Dakewe Biotech Co., Guangzhou, China) and 5% UltraGROTM (Helios, USA).
JAR and HTR-8/SVneo cell lines were procured from Type Culture Collection China Centre. DMEM/F12 (10% FBS) was used for cell incubation in a 5% CO2 atmosphere at 37°C.
CV-MSC identification
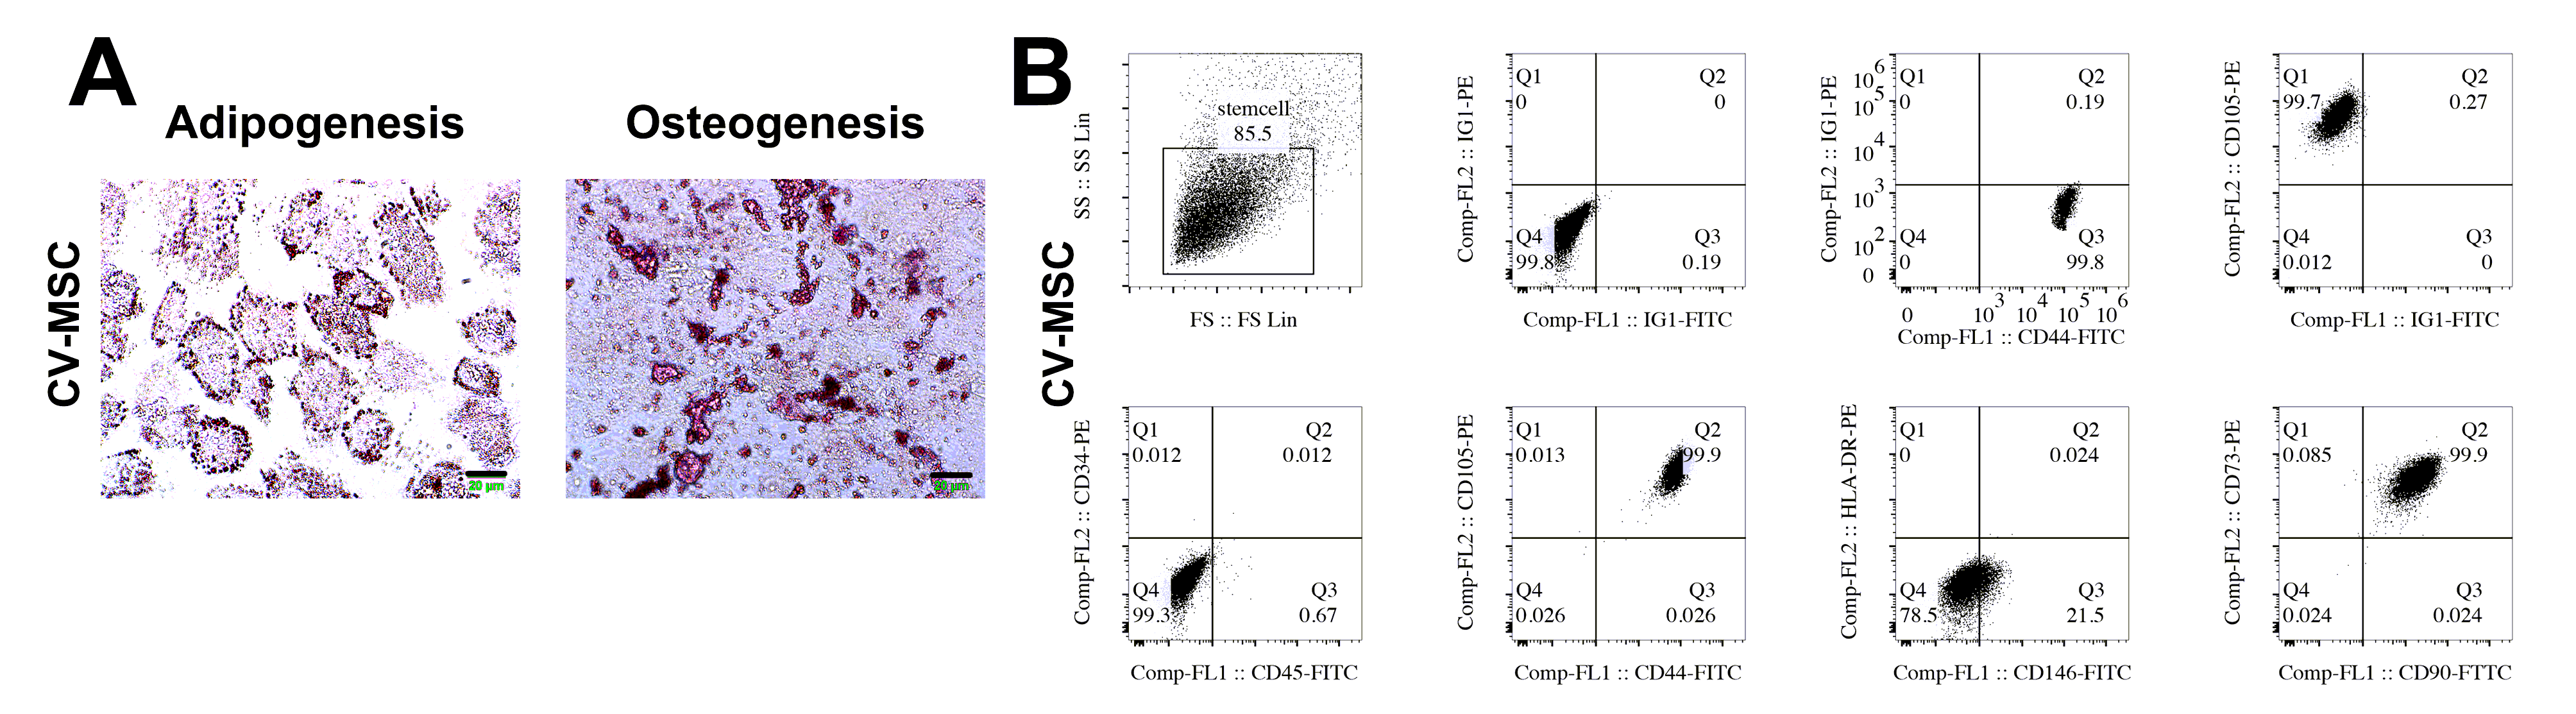
The cellular biomarkers in CV-MSCs (at passage 3) were detected by a flow cytometry using a series of antibodies (eBioscience, San Diego, CA); the biomarkers contained positive markers (CD44, CD73, CD90 and CD105) and negative markers (CD34, CD45, CD146, IG1 and HLA-DR).
Since CV-MSCs from placentas of normal pregnancies or placentas with severe PE could differentiate into osteoblasts as well as adipocytes, we assessed their differentiation capability. CV-MSCs were cultured in 6-well plates until reaching a confluency between 70% and 80%. Subsequently, the CV-MSCs were transferred into osteogenic or adipogenic differentiation medium (Gibco, Carlsbad, CA) for 3 weeks of incubation. Then CV-MSCs were stained by Alizarin red S for verifying differentiation of osteoblasts, followed by oil red O staining for adipocyte differentiation.
Exosome isolation
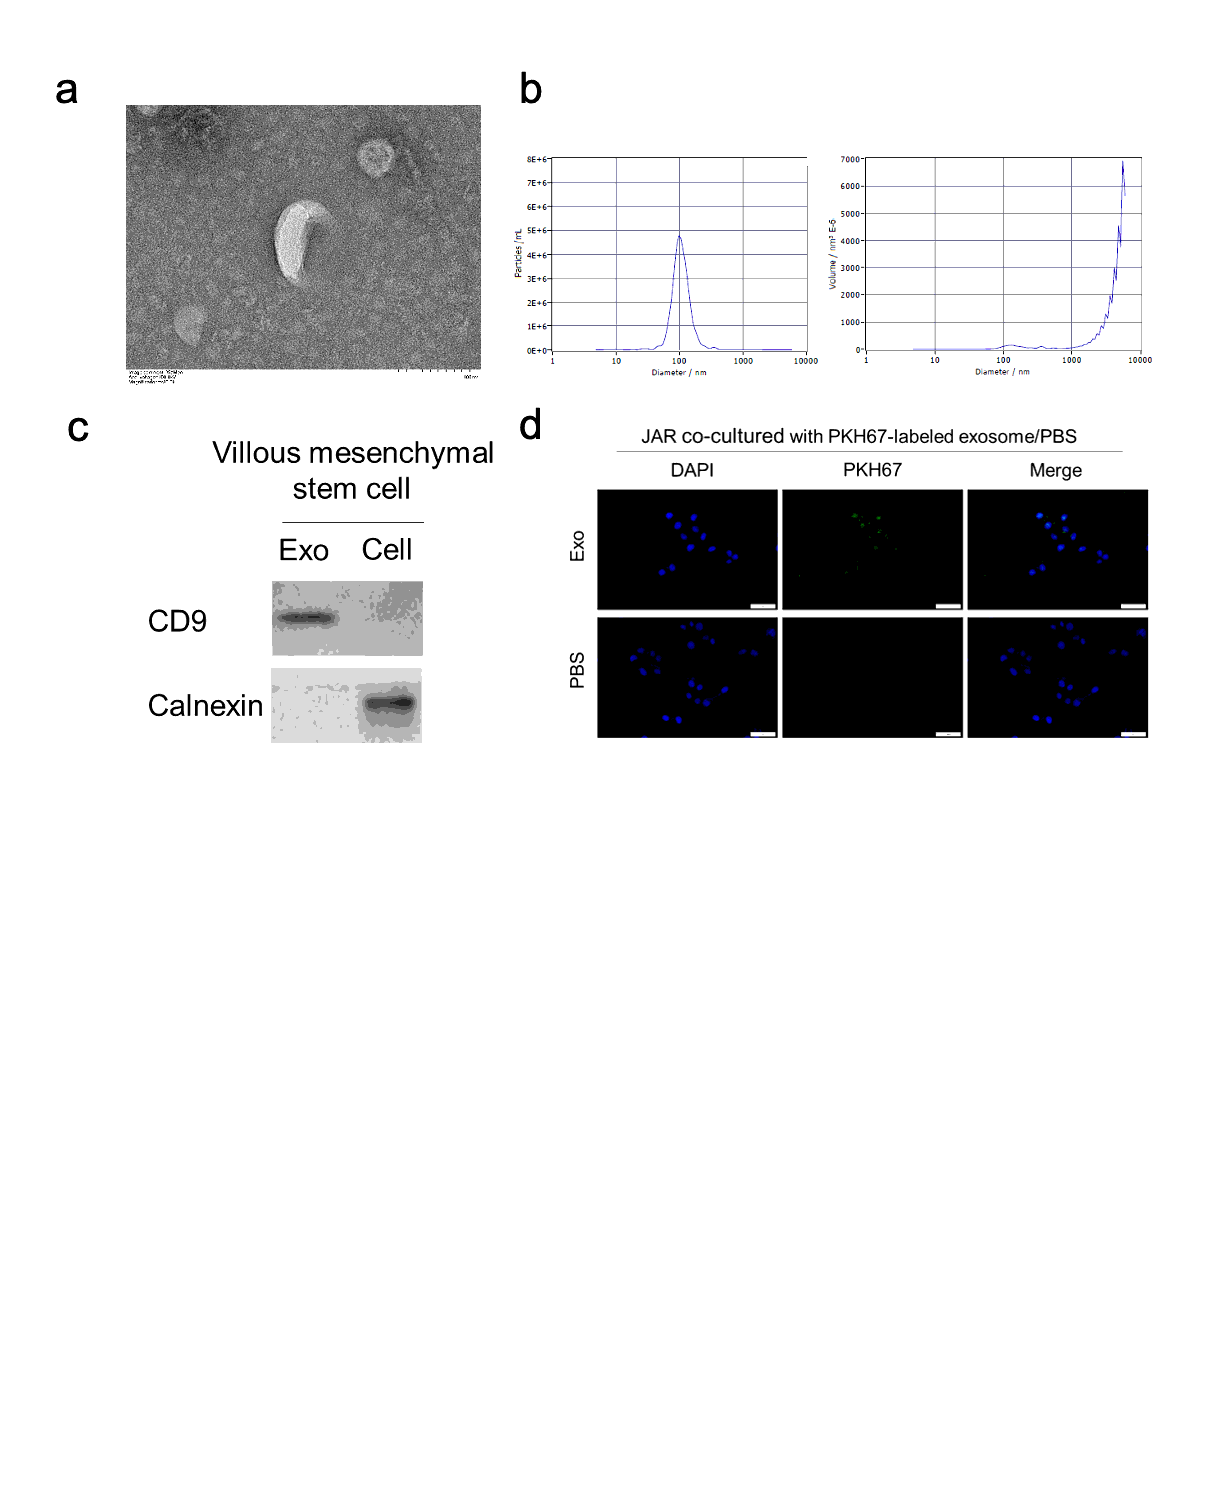
Epidural CV-MSC supernatants were differentially centrifuged to obtain exosomes. The medium was disposed of after attaining 70% confluency. DMEM/F12 (serum-free) was then adopted to culture cells for an additional day. The supernatants were pooled and sequentially centrifuged at 15,000 x g for half an hour, followed by filtration through filters (0.22 mm) (Millipore, Billerica, MA) and ultracentrifuge at 120,000 x g. The exosomes were rinsed by sterile PBS and collected. Pierce BCA Assay Kit (Thermo Fisher) was utilized to detect exosome concentration. Nanoparticle tracking analysis was used for determining the profile of size distribution and measurement of concentration through a particle tracker (ParticleMetrix, Germany).
Electron microscopy
During roughly ten mins, nearly 50 μl of exosome preparation was taken up by absorption in 300-mesh formvar/carbon coated grids. The grids were then dried at ambient temperature for half an hour and transferred to 3% phosphotungstic acid solution for negative staining. The exosomes were visualized by using an Olympus transmission electron microscope at 120.0 kV. Exosome images were taken using a CCD camera.
Exosome uptake
CV-MSC-derived exosomes were tagged by the PKH67 dye (Sigma-Aldrich) in accordance with the slightly modified protocol provided by the manufacturer. In brief, exosomes were subjected to suspension with 250 μL PBS and blended with 750 μL diluted PKH67 (1/50) (for cytomembrane labeling, in Diluent C), followed by 5 min of incubation at ambient temperature. After that, 2 mL BSA was used to end the labeling process. The isolation of labeled exosomes was performed as previously specified, followed by suspension in 1×PBS.
In uptake experiments, labeled exosomes (10μg) were incubated with JAR cells seeded on 24-well plates at 37 °C for 3 h. The cells were rinsed and fixed by 4 % paraformaldehyde in PBS for 30 min at ambient temperature. Nuclei staining was conducted with 4′,6-diamidino-2-phenylindole (DAPI, Sigma).
RNA-seq
Samples were collected using TRIzol (1 ml) (Thermo Fisher Scientific, and were placed at minus 80 °C. Libraries were prepared according to the instructions for an Illumina TruSeq RNA Sample Prep Kit, and sequencing was performed on a MiSeq instrument. Analysis of data (from Annoroad Gene Technology, Beijing, China) was performed on RSEM software. With labeling of no. SRR9943697–no. SRR9943702, all RNA-seq data are available at Sequence Read Archive (SRA).
miRNA mimics and lentivirus infection
Transient transfections for lentivirus infection were performed by Lipofectamine 2000 (Invitrogen, Carlsbad, USA). These transfected cells were extracted after being treated by puromycin to generate stable transfected cell lines.
The shRNA sequences are as follows: sh-Control, 5’- GCAAGCTGACCCTGAAGTT -3’; sh-TXNIP, 5’-GCCTTCGGGTTCAGAAGAT-3’. Control microRNA, miR-135b-5p mimics were purchased from Hanbio (Shanghai, China). Control lentivirus (Vector), lentiviral constructs expressing full-length TXNIP, miR-135b-5p overexpression and control lentiviruses (NC) were used to establish stably overexpressed cell lines.
Protein isolation, western blot analysis and qRT-PCR
Protein isolation, western blot analysis and qRT-PCR were carried out as previously described26.
The primary antibodies adopted for western blotting analysis are as follows: TXNIP (NBP2-75692, Novus, Cambridge, USA; 1/1000), CD9 (ab254175, Abcam, Cambridge, USA; 1/1000), Calnexin (ab22595, Abcam; 1/1000), β-catenin (#8480, Cell Signaling Technology, Beverly, USA; 1:1000), GAPDH (ab181603, Abcam; 1:5000), Histone H3 (ab176842, Abcam; 1:1000), β-catenin (#8480, Cell Signaling Technology, Beverly, USA; 1:1000).
The primer sequences are listed below: TXNIP, forward, 5’-TAGTGTAACCAGCGGCGTAT -3’, reverse, 5’-CACACCTCCACTATCACCCG-3’; GAPDH forward, 5’- AATGGGCAGCCGTTAGGAAA-3’, reverse, 5’- GCGCCCAATACGACCAAATC-3’. The primers for miR-135b-5p were purchased from Ribobio (Guangzhou, China).
Cell proliferation analysis
Cells (5×10³/well) were seeded in the 96-well plates. The CCK-8 (Thermo Fisher Scientific, MA, USA) was added to evaluate cell viability each day as per the protocol. The OD value at 450nm was detected through a microplate reader. Cell growth curves were carried out in triplicate.
Trophoblast invasion assay
Two trophoblast lines (5×10⁵ cells) were plated into transwell membrane (Corning, NY, USA). The pore membranes were covered by Matrigel™ matrix dilution (1:10) . The trophoblasts were then incubated for 12 h. Medium (with 10% FBS) treated with or without CV-MSCs-exosomes (control) was added into the lower layer. Transwell assays were conducted while trophoblasts were cultured without FBS for 24 h. Subsequently, cell fixation was performed using 4% paraformaldehyde. Cells having traversed the membrane were quantified. Each experiment was conducted for at least 3 independent times.
Luciferase reporter assays
Cells (3×10³/well) were seeded in 96-well plates. The plasmids containing pGL3- TXNIP 3’ UTR WT and pGL3- TXNIP 3’ UTR MUT were procured from Hanbio (Shanghai, China). Co-transfection was performed with WT/MUT plasmids and miR-135b-5p mimic using Lipofectamine3000 (Thermo Fisher Scientific).
The reporter plasmids containing wild-type (TOPflash) or mutated (FOPflash) TCF/LEF DNA binding sites were purchased from Addgene (Addgene, Cambridge, USA) and Renilla reporter constructs were from Promega (Promega; Madison, USA). Luciferase reporters and Renilla reporters were co-transfected into cells with Lipofectamine 3000 (Thermo Fisher Scientific). Luciferase reporter activity was normalized against Renilla activity for 24 h.
Dual-Luciferase Reporter Assay Kit (Promega) was used to detect luciferase activity.
Bioinformatics analysis
TargetScan (http://www.targetscan.org), a miRNA target predicting tool, was adopted for predicting the potential miRNA-miR135b-5p of TXNIP.
Immunofluorescence
Trophoblasts were treated with or without purified CV-MSCs-exosomes (10 μg/ml), and then cultured for 24 h. They were then collected, separated and settled in 4% paraformaldehyde for 60 min. The pellets were desected into 4-μm thick sections and placed in paraffin. Later, the sections were bathed thrice in PBS, closed with 10% goat serum for 1 h and subsequently bathed twice in 0.2% Triton X-100. Then, primary antibodies (TXNIP and β-catenin from Abcam, MA, USA), secondary antibodies (Invitrogen) and DAPI (Guangzhou RiboBio, Guangzhou, China) were used for cell incubation. And the images were take through a fluorescence microscope.
Placental explant culture
After being collected within 10 mins, all placentas were then processed in 30 min and observed carefully for abnormalities. Following thorough rinse in PBS thrice to remove remaining blood, the villous tissue was cut into small bits of tissue (8 mm3). DMEM/F12 (4 ml per well) supplemented with 1% penicillin/streptomycin and amphotericin B (Gibco, Carlsbad, CA) was adopted for culturing the placental explants in an incubator at 37 °C at an oxygen concentration of 2% for 2 days. Following treatment with CV-MSC-exosomes for 24 h, the explants were rinsed with PBS and then placed in liquid nitrogen.
Statistical Analysis
Two-tailed Student’s t-test was adopted for data analysis. Each experiment was conducted independently in triplicate and all data were given as mean ± SEM. Prism (Ver. 7) (GraphPad; La Jolla, USA) was used to analyze data. P values less than 0.05 suggested statistical significance and were denoted by “*”; P values between 0.05 and 0.01 were denoted by “**”; P values between 0.01 and 0.001 were denoted by “***”; P > 0.05 denoted no significance (n.s.).