Study design
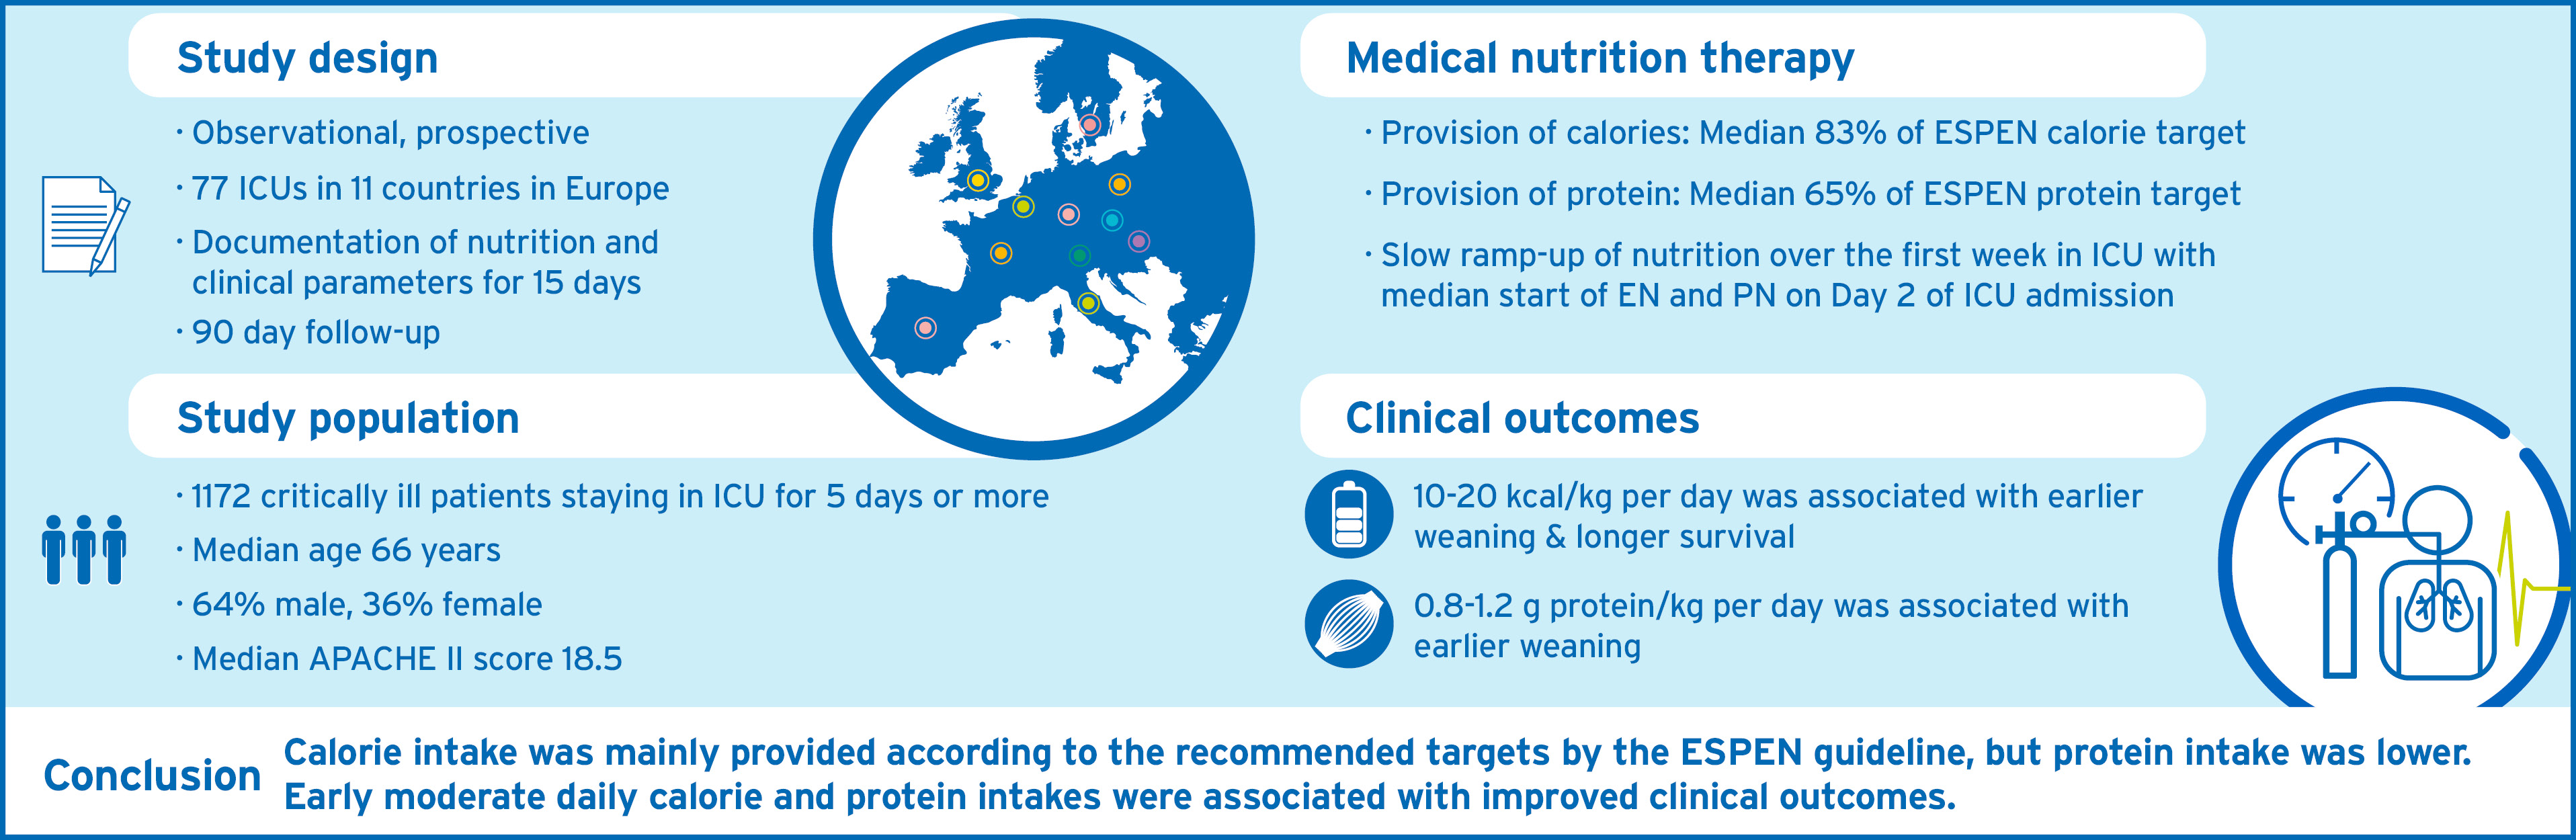
The present study was a multinational, prospective observational cohort study conducted between November 2019 and July 2020 in 11 European countries (Austria, Belgium, Czech Republic, France, Germany, Hungary, Italy, Poland, Spain, Sweden, and United Kingdom), approved by the respective Ethics Committees and Institutional Review Boards. The study protocol was published previously (15).
Patients
The study included critically ill adults, aged 18-95 years, with a body mass index (BMI) of ≥18.5 kg/m² and ≤45 kg/m², hospitalized in any type of ICUs for at least five consecutive days, and receiving medical nutrition therapy as part of ICU care. Exclusion criteria included: burns; chronic, pre-existing neuromuscular, psychiatric, or neurological conditions precluding assessment of functional status; home nutritional support or chronic mechanical ventilation before or at the time of ICU admission; palliative care; or concurrent enrolment in any nutrition-related interventional study. After informed consent, demographic, clinical characteristics, and nutrition variables were recorded for eligible patients until ICU discharge, death, or maximum day 15 of ICU stay. We assessed 90-day survival time, and patient’s mobility status (ICU Mobility Score (16), IMS) at baseline, reflecting IMS values before ICU admission, and at day 15, 30, and 90 after ICU admission. Patients were followed up until day 90 after ICU admission, either via telephone, or visited by site personnel.
Outcomes
The primary outcome of this study was described as the median [Q1;Q3] calorie and protein balances, calculated as the percentage deviation from the ESPEN targets during the first 15 days of ICU stay. Intakes were calculated from all nutritional sources, i.e., oral nutrition, oral nutritional supplements (ONS), enteral nutrition (EN), parenteral nutrition (PN), and non-nutritional calories, i.e., propofol, clevidipine, citrate, or glucose. Since ESPEN guidelines do not define explicitly the daily targets for the acute phase, we approximated daily targets based on an estimated energy expenditure of 25 kcal/kg per day: 10 kcal/kg body weight (BW) on day 1 (≈ 40% of energy expenditure), 15 kcal/kg on day 2 and 3 (≈ 60% of energy expenditure), 20 kcal/kg on day 4 to 6 (≈ 80% of energy expenditure), 25 kcal/kg on day 7 to 15 (≈ 100% of energy expenditure).
Daily protein targets were set at 0.6 g/kg on day 1, 0.9 g/kg on day 2 and 3, and 1.3 g/kg on days 4 to 15. Calculations were based on actual (admission) BW for patients with a BMI <30 kg/m² and on adjusted BW, determined by the formula: (actual BW - ideal BW) x 0.33 + ideal BW when BMI was ≥30 kg/m², estimating ideal BW as per Peterson (17).
Other outcomes were time-to-weaning from IMV, defined as the time in days from the start of IMV to either successful weaning (irrespective of subsequent death) or to death while intubated, 90-day survival time.
Quantifying macronutrient intake
Daily protein and calorie intake was collected from the day of ICU admission (day #1 in ICU) for a maximum of 15 days. Documentation of calorie and protein intake was stopped after a patient had been discharged from the ICU, or after day 15 for patients longer in the ICU. Total daily protein intake was classified by using established thresholds (18) defining three different levels based on the daily amount of received protein (level I, low: <0.8 g protein/kg; level II, moderate: 0.8-1.2 g protein/kg; level III, high: >1.2 g protein/kg).
Classification of total daily calorie intake was based on the assumption of a maximum energy expenditure of 30 kcal/kg per day during the acute phase (19), and on established categories of expenditure of <33.3%, 33.3 – 66.6%, >66.6% (20, 21), resulting in the categories per kcal/kg: level I, low: < 10 kcal/kg per day; level II, moderate: 10-20 kcal/kg per day; level III, high: > 20 kcal/kg per day.
Statistical analyses
For descriptive statistics, continuous variables were described as number of patients with valid/missing observations, and non-normally distributed data was described as median and interquartile range [Q1;Q3] values.
Independent predictors for daily calorie and protein intakes were identified using linear mixed-effect models with repeated measures and reported as estimates and 95% CI. Study site was included as random effect, and ICU day as fixed effect. Discharge date was excluded since mostly partial nutrition data was available depending on discharge time. Continuous variables were modelled by flexible penalized spline to account for possible nonlinear relationships with the outcome variables. A p-value <0.05 was considered a significant association.
To estimate hazard rates of medical nutrition therapy for time until successful weaning and time until death (while still being intubated) in a subgroup of patients with IMV between day 1 to 3, we used piece-wise exponential additive mixed models (22, 23), which allowed for an easy accommodation of time-varying covariates such as nutrition, and had been recently extended to cumulative effects (22, 24) and to competing risks (25). R packages pammtools (24) and mgcv (26) were used to estimate corresponding models. This novel combination of statistical techniques has already been used before to estimate complex associations between nutrient intakes and different outcomes (27, 28).
A similar approach was used for modelling associations of medical nutrition therapy with survival time. Confounders included demographic and clinical patient characteristics, and study site as random effect (additional file, eTables 1-4). We also used leads and lags. The lead time thereby defines the putative delay until an effect of nutrition. The lag time aims to minimize the indication bias originating from possible changes of calorie intake prior to weaning from IMV, discharge, or death (23, 27).
To facilitate interpretation of the time-varying hazard ratios (HR) between nutrition and outcome, we predefined different hypothetical time-varying medical nutrition therapies with three levels of calorie or protein intake (low, moderate, high) in combination with an early (day 1 to 4) and late (after day 4) period over days 1-15 (Table 1). Importantly, these hypothetical medical nutrition therapies represent concepts similar to clinically established nutrition protocols, but do not reflect selected patient cohorts contained in this study. We modelled associations between these hypothetical medical nutrition therapies and outcomes by designing six pairwise medical nutrition therapy comparisons while controlling for confounders. All hazard ratios of these pairwise comparisons of different hypothetical medical nutrition therapies were calculated under the assumption that all other variables were fixed.
For survival analysis, our statistical model required information on calorie and protein intake for all 15 days after ICU admission, even if a patient had been discharged from the ICU before. Recent surveys showed that after ICU discharge patients on average only receive 0.8-1.0 g protein/kg per day and 14-18 kcal/kg per day (29). On the days before ICU discharge, our surviving patients had on average an intake of 1.2 g protein/kg per day and of 20 kcal/kg per day. Therefore, to account for missing days with medical nutrition therapy on an individual basis, we imputed a daily calorie and protein intake reflecting 80% of the patient`s average preceding intake of the three last days prior to discharge; no other imputations were performed.
A detailed explanation of the methodology, and how to translate these pairwise comparisons into the cox-type models is provided in the additional file (eAnnex 1, and eFigure 1).