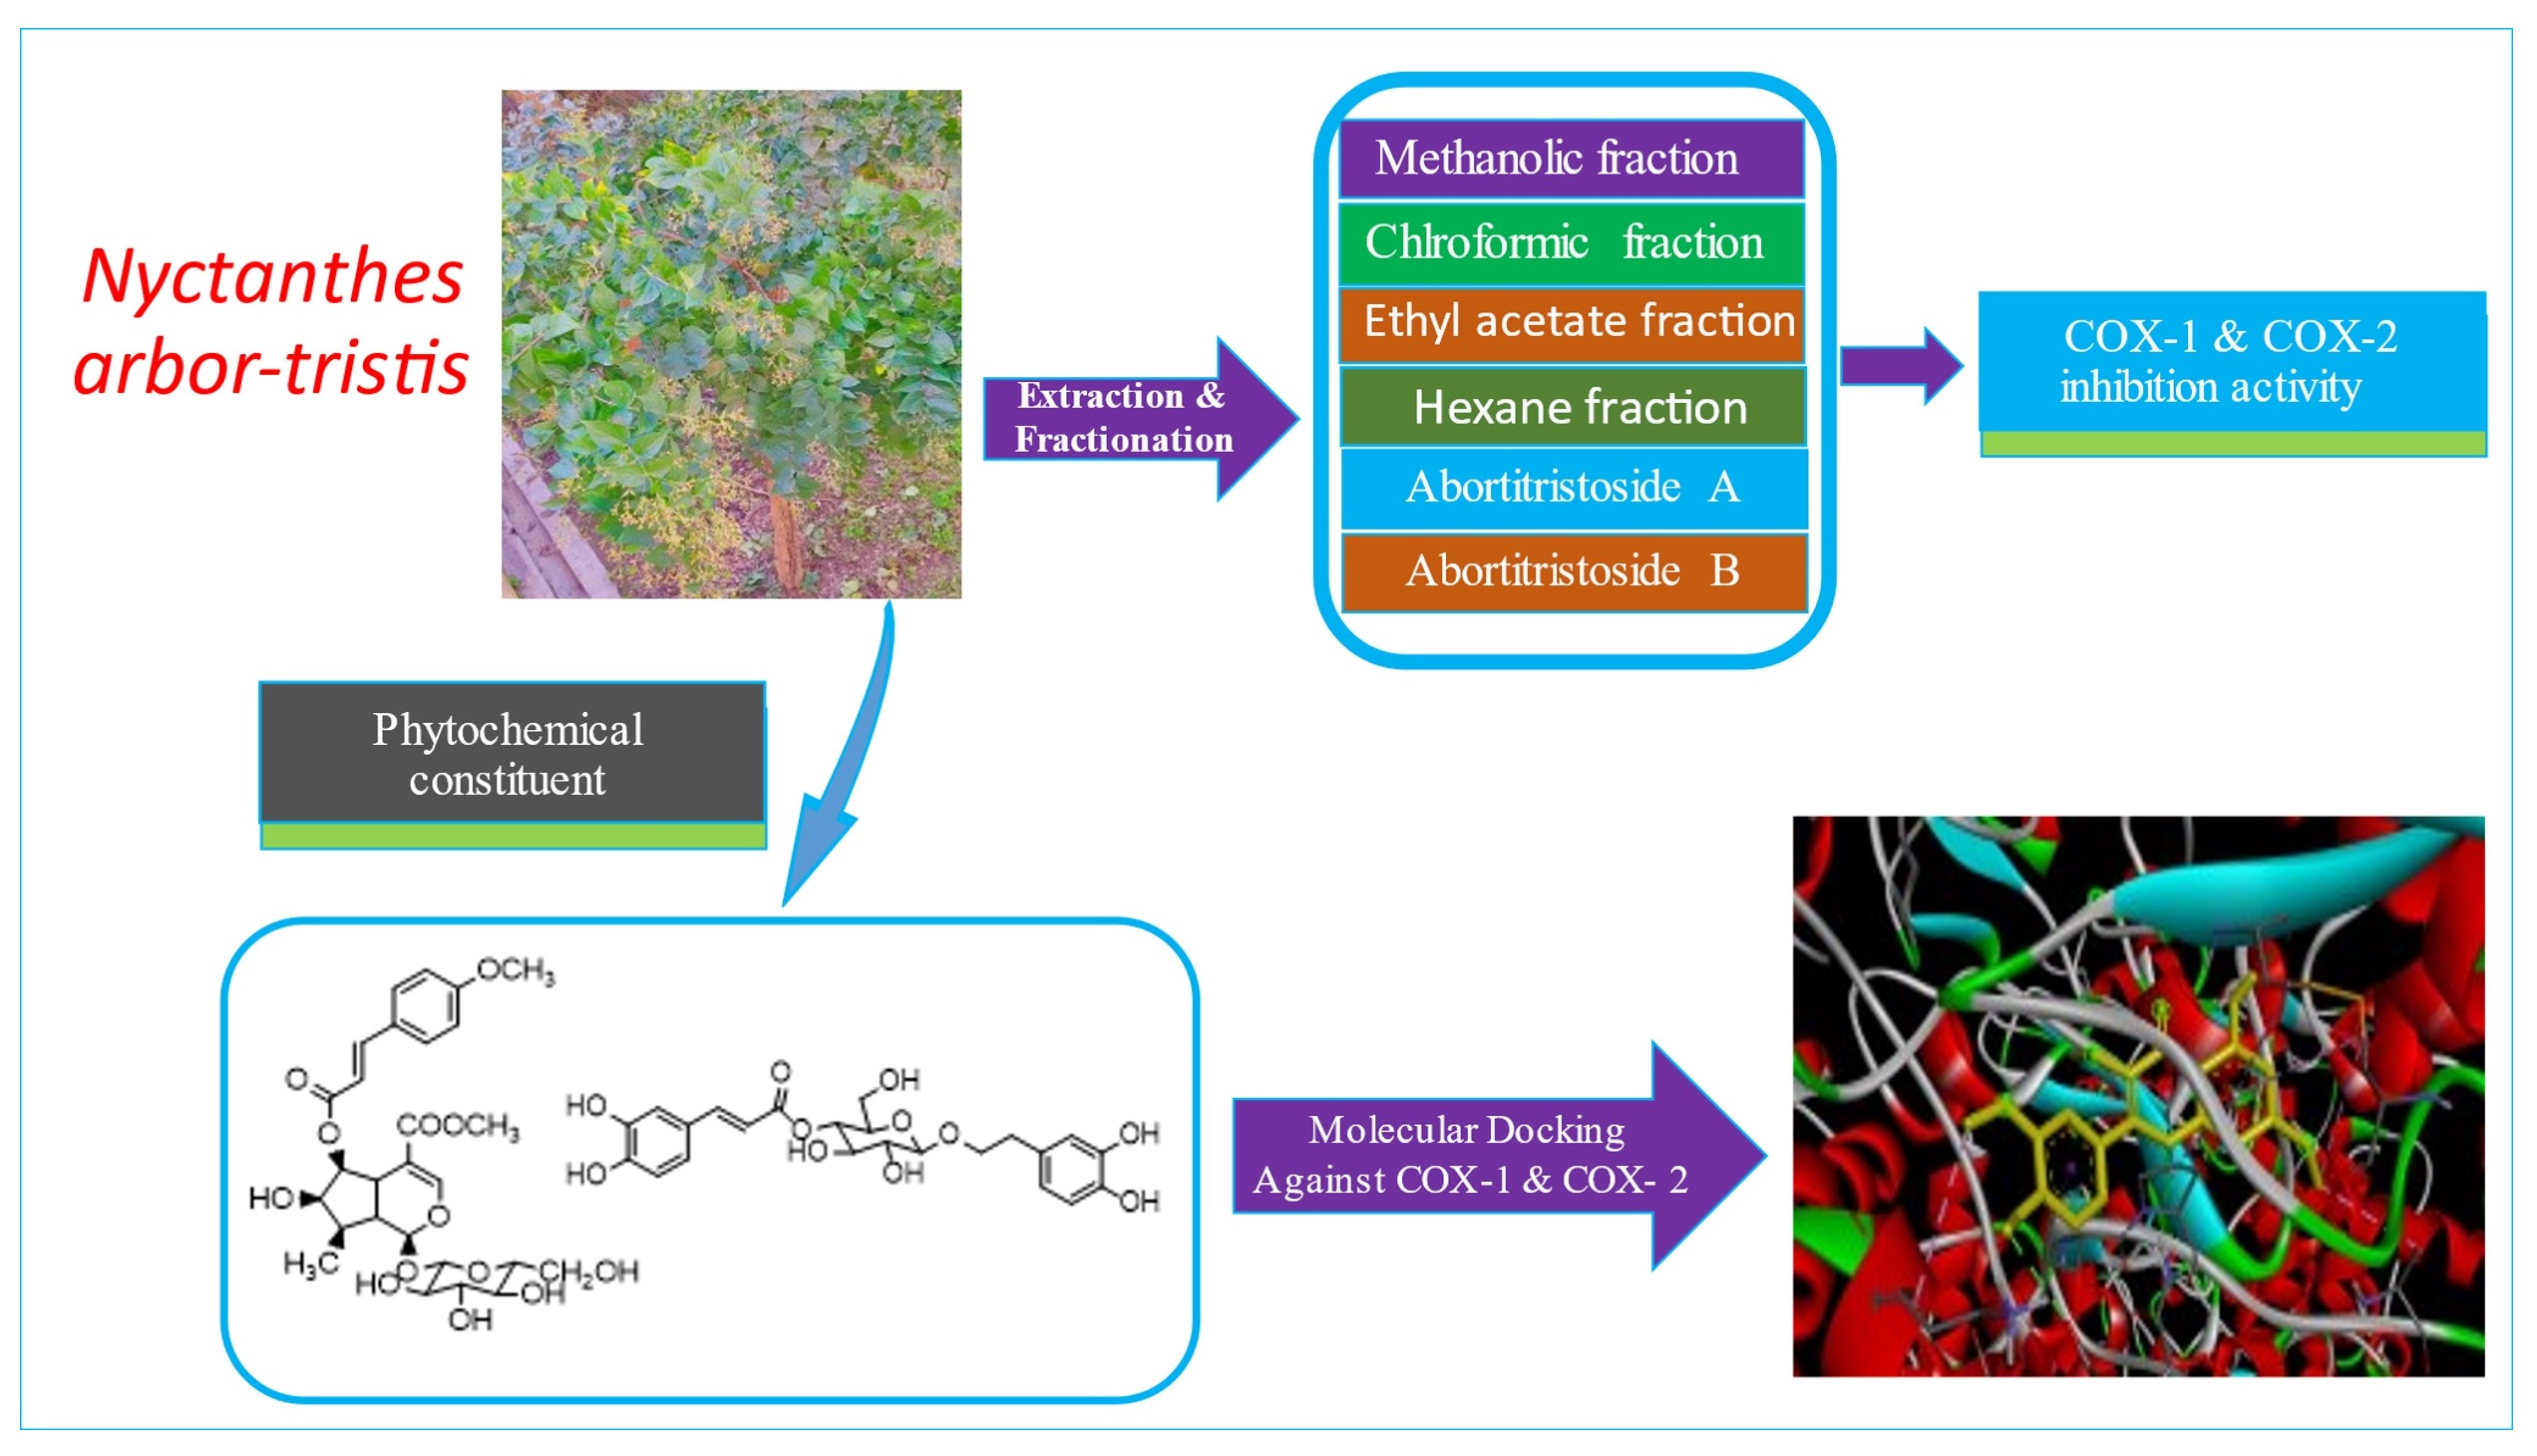
The plant Nyctanthes arbor-tristis belongs to the genus Betula (Betulaceae family) which is used is in the treatment of many diseases like diabetes, cancer, inflammation, intestinal problem and tuberculosis in many countries of Asia. In this analysis, we have investigated the anti-inflammatory activity of various extracts of leaves of Nyctanthes arbor-tristis by the in-vitro method as the cyclooxygenase inhibitory potential. The reported phytochemical constituent of the plant was in-silico screened to find the cyclooxygenase inhibitory potential by molecular docking method. The molecular docking study of pre-isolated phytochemicals from the leaves of plants shows that compounds possess a great inhibition potential against COX-1 and COX-2 therefore, an in-vitro comparative study is required to conclude the selective and potential COX-2 inhibitor for the development of new anti-inflammatory drug without causing any gastrointestinal ulcer. Here we deliver a new strategy to design selective COX-2 inhibitor from the plant origin natural compound by using molecular docking technique and in-vitro screening of plant extract. In the other part of the paper abortitristoside A (1) and abortitristoside B (2) were isolated from the leaves part of the plant. The isolated compound possesses good activity against COX-2 and COX-1 with IC50 value (4.51-4.55 ug/ml against COX-2) which is also established by structure-activity relationship analysis.
Research Article
Abortitristoside A and Desrhamnosylverbanscoside: The Potential COX-2 Inhibitor From the Leaves of Nyctanthes Arbor-tristis as Anti-inflammatory Agents Based on the in-vitro Assay, Molecular Docking and ADMET Prediction
https://doi.org/10.21203/rs.3.rs-1345800/v1
This work is licensed under a CC BY 4.0 License
Version 1
posted
You are reading this older preprint version
Nyctanthes arbor-tristis
COX-1/2 inhibitor
molecular docking
phytochemistry
Inflammation is a responsive phase of physical, chemical injury, or damage by the attack of a pathogen like bacteria or viruses [1, 2] The component involved in the inflammation are degradative enzyme and superoxide [3], chemotactic factors [4, 5], vasoactive substances, and neuropeptide substances [6]. To treat the inflammation NSAIDs block the enzyme cyclooxygenase (COX) also known as prostaglandin synthase hence inhibiting the synthesis of prostaglandin at the site of inflammation [7].
The discovery of two different COX isoenzymes that is COX-1 (present throughout the gastrointestinal tract) and COX-2 (present at the site of inflammation) leads to the improvement of NSAIDs. Although only COX-2 involve in inflammation, therefore a COX-2 selective molecule is required to treat the inflammation without causing any ulcer throughout the gastrointestinal tract [8]. Different type of stimuli that triggers the activation of cytosolic phospholipase A2 (cPLA2) set amino acid (AA) free from membrane phospholipids [9]. COX-1 or, and COX-2 induced and catalyzed the biosynthesis of endoperoxidase PGH2 which is highly unstable and converted into prostaglandins (PGD, PGE and PGF), prostacyclin’s (PGI) and thromboxane’s (TX) by specific catalyst (Fig. 1) [10–13]. Biosynthesize PGE2 increases cell proliferation which causes various prolonged inflammatory diseases like the progression of cancer, Alzheimer’s disease, arthritis, cardiovascular disorder, neurological disorders and autoimmune [14–18].
Nyctanthes arbor-tritis (family: Oleaceae) is well known medicinal plant generally known as Night jasmine or Harsinger native to India, wildly distributed in the sub-Himalayan region and is also used as an ornamental plant in many regions of Asia [19]. The root part of the plant is used to treat anorexia and fever, the leaf part is used to treat the vermifuge, fever, diaphoretic and diabetes, bark part is used as an expectorant while the whole plant is used to control cancer [20, 21]. Ethnobotanical importance shows that different extracts of the different parts of the plant possess anti-arthritis, antimalarial activity [22], anti-oxidant and anti-inflammatory activity [23, 24]. The sap of greeneries exhibits digestive, diuretic and antivenom properties and is also used as a tonic [25–27]. The plant showed antiviral activity against Semliki Forest virus and Encephalomyocarditis virus while leaves were used to reduce the enlargement of the liver spleen [28]. The plant is very famous for its pharmacological properties from ancient science. Extensive research has been done on the plant Nyctanthes arbor-tristis because of its pharmacological properties. In the present study, we have tried to find a potential COX-2 inhibitor by in-vitro analysis of the different extracts of various parts and by virtual screening of phytochemical using molecular docking techniques.
Isolation of abortitristoside A (1) and abortitristoside B (2)
The compound (1) was identified as abortristoside A an iridoid glucoside based on its chemical reaction and spectral analysis. On alkaline hydrolysis with glucosidase gives p-methoxy cinnamic acid confirms the iridoid glucoside skeleton. the UV spectral analysis shows the presence of phenyl group, ester and para-substituted phenyl ring. The IR spectral analysis confirms the presence of ester (1220, 1180 cm− 1), ether (1050 cm− 1), -CH3 (1369 cm− 1), C = C (1660 cm− 1), -C = O (1727 cm− 1), -OH (3428 cm− 1) and monosubstituted benzene ring (750 cm− 1). The 1H-NMR spectral analysis of compound 1 shows that it possesses -CH3 (δ 1.02, 3H, d, J = 7.0 Hz), -OH (δ 3.58–3.68), ester (δ 4.07, 4.52) groups, trans-olefinic protons (δ 6.51, 7.71, J = 15.7) and aromatic protons (δ 6.34, 7.16), -OCH3 (3.72, s, 3.77, s). Further, the presence of -CH3 (δ 19.3), -OCH3 (δ 56.0, s), ester (δ 168.5, s) groups, olefinic (δ 145.6, s) and aromatic (δ 114.3-130.3) carbon were confirmed by 13C-NMR spectra. The NMR spectral analysis of compound 2 shows the absence of -OCH3 (3.77, s) peak in 1H-NMR spectra and -OCH3 (δ 56.0, s) peak in 13C-NMR spectra. The mass spectra of compound 1 shows the major abundance of fragments [a+] (402), [b+] (226), p-methoxy cinnamic acid 178), p-methoxy cinnamoyl moiety (161), [c+] (156) as shown in Fig. 2. Evaluating and matching the 1H-NMR, 13C-NMR, UV, IR and Mass spectral data from literature confirms that compounds 1 and 2 are abortitristoside A (1) and abortitristoside B (2). These compounds were also isolated from the seed part of the plant Nyctanthes arbor-tristis [29, 30].
COX-1 and COX-2 inhibition activity of various extracts, abortitristoside A(1) and abortitristoside B (2)
All the four extracts, abortitristoside A (1) and abortitristoside B (2) isolated from leaves were tested to analyze their inhibitory activity towards COX-1 and COX-2. The tests were performed using the markedly available COX-(human) inhibitor screening kit (Catalog No. 701070, 701080, Cayman Chemical, PLM Pvt. Ltd., New Delhi, India). In this method, we analyze the quantity of PGF2α by using the enzyme immunoassay. Results were expressed in the terms of percentage inhibition of COX by 30uM solution of each extract in triplicate observation with a two-digit standard deviation. Further IC50 values were evaluated for the extracts having high inhibitory potential, abortitristoside A (1) and abortitristoside B (2) based on percentage inhibition (Table 1, Fig. 3).
|
Sample |
% Inhibition |
IC50 Value (ug/ml) (COX-2) |
|
|---|---|---|---|
|
COX-2 |
COX-1 |
||
|
Methanolic Extract |
88.97 ± 1.24 |
80.87 ± 0.96 |
5.10 |
|
Ethyl Acetate Extract |
67.82 ± 0.66 |
80.29 ± 0.62 |
-- |
|
Chloroform Extract |
85.23 ± 0.89 |
69.19 ± 0.66 |
6.76 |
|
Hexane Extract |
78.27 ± 0.54 |
72.31 ± 0.99 |
-- |
|
Abortitristoside A (1) |
90.67 ± 0.45 |
55.58 ± 0.65 |
4.51 |
|
Abortitristoside B (2) |
90.56 ± 0.43 |
55.61 ± 0.64 |
4.55 |
|
Celecoxib |
91.69 ± 0.34 |
22.35 ± 0.45 |
4.17 |
The inhibitory effectiveness of the extracts was estimated at a concentration of 30 µM and percentage inhibition values were the means of three observations. Among all the extracts the methanolic extract shows the highest percentage inhibition against COX-2 (88.97%) and COX-1 (80.87%) but reduced selectivity towards COX-2 as compared to celecoxib. Instead of methanolic extract, chloroform extract also showed a remarkable percentage inhibition against COX-2 (85.23%) and COX-1 (69.19%) but lessor than celecoxib. The IC50 Values were evaluated for chloroform, methanolic extracts, abortitristoside A (1) and abortitristoside B (2) against COX-2 which shows that abortitristoside A (1) possess the lowest IC50 value (4.51 ug/ml) amongst all tested sample but higher than celecoxib (4.17 ug/ml).
Molecular docking analysis of phytochemical against COX-1 and COX-2 isoenzyme
Molecular docking result (Table 2, Fig. 4) of all 21 selected ligands and 7 standard compounds against 3KK6 and 3LN1 isoenzyme were represented in term of Total Binding Energy (EBIND = EVDW + EH−BOND + EELECTROSTATIC) where the molecule having the lowest binding energy have highest docking score towards the host protein structure. The result shows phytochemical ligands 6 (-9.5 kcal/mol), 21 (-9.2 kcal/mol), 2 (-8.8 kcal/mol) and 1 (-8.3 kcal/mol) have highest binding affinity/docking score for 3KK6 (COX-1 enzyme) while ligands 14(-10.3 kcal/mol), 1(-10.2 kcal/mol), 2(-10.2 kcal/mol) and 6(-9.8 kcal/mol) have highest binding affinity for 3LN1 (COX-2 enzyme). Active sites of COX-2 contain LEU359, LEU352, ARG120, VAL349, ALA527, LEU384, TRP387, TYR355, TYR385, SER353, MET522, SER530, VAL523, LEU531, GLY526 amino acid residues while COX-1 are SER530, LEU531, TYR355, LEU359, VAL349, LEU352, GLY526, ALA527, LEU384, TYR385, MET522, ILE523, HIS90, MET113, TRP387, ILE517, SER353, PHE381, VAL116, ARG120, PHE518, TYR348 [31]. There are three main domains at COX-2 active site: (1) a hydrophilic domain (possess GLU524, ARG120 and TYR355); (2) a hydrophobic domain (possess ALA201, TYR385, LEU352, PHE518, TYR248 and TRP387) at the beginning of active site; (3) a side pocket having VAL523, HIS90 and ARG513 [32].
|
Phytochemical Ligands |
Binding Energy (COX-2 or 3LN1) |
Binding Energy (COX-2 or 3LN1) |
|---|---|---|
|
14 |
-10.3 |
-8.1 |
|
1 |
-10.2 |
-8.3 |
|
2 |
-10.2 |
-8.8 |
|
6 |
-9.8 |
-9.5 |
|
20 |
-9.5 |
-7.5 |
|
3 |
-9.4 |
-8.1 |
|
5 |
-9.1 |
-8.8 |
|
16 |
-9.1 |
-8.3 |
|
15 |
-9 |
-7.9 |
|
18 |
-9 |
-7.8 |
|
19 |
-9 |
-8 |
|
17 |
-8.9 |
-7.9 |
|
10 |
-8.8 |
-8.1 |
|
4 |
-8.7 |
-8 |
|
7 |
-8.5 |
-7.2 |
|
8 |
-8.4 |
-6.5 |
|
13 |
-8.4 |
-7.9 |
|
11 |
-8.3 |
-7.3 |
|
12 |
-8 |
-7.7 |
|
21 |
-7.8 |
-9.2 |
|
9 |
-6.2 |
-6.6 |
|
Celecoxib |
-10.9 |
-9.5 |
|
NS398 |
-8.9 |
-8.4 |
|
Piroxicam |
-9 |
-9.7 |
|
Tamoxifen |
-9 |
-8.7 |
|
Aspirin |
-9.8 |
-10 |
|
Diclofenac |
-7.8 |
-7.5 |
|
Indomethacin |
-8.6 |
-8.9 |
Further ligand-protein residue interaction study (Table 4 and Fig: 5, 6) reflex that standard compound Aspirin having highest docking score against COX-1 shows hydrogen bonding and hydrophobic bonding with LYS (A:532), GLN (A:372) and SER (A:126) amino a cid residues. In other hand the standard compound Celecoxib hiving highest docking score against COX-2 shows hydrogen bonding and hydrophobic bonds with CYS (D:32), TRP (C:309), MLT (D:33), TYR (D: 122), PRO (D:140), HIS (D:119), VAL (D:119), GLY (D:121), ASP (D:143), ALA (D:142), PRO (D:139), PRO (D:25) and CYS (D:21) amino acid residues. Following these data, the top two phytochemical ligands possess hydrogen bonding and hydrophobic bonding with ALA(A:199), ALA(A:202) MET(A:391), GLN(A:203), HIS(A:388) HIS(A:383) VAL(A:451), GLU(A:454), HIS(A:386), HIS(A:207), ALA(A:202), LEU(A:390), HIS(A:207, 388), HIS(A: 446), GLU(A:454), THR(A:212), HIS(A:385), ASN(A:382) and PHE(A:210) amino acid residues of the active site of COX-1 and ASP(A:143), ALA(A:142), ASN(A:24, 19), GLN(B:313), CYS(A:32), GLU(B:312), TRP(B:309), SER(A:34), TYR(120), SER(B:34), TRP(A:309), TYR(B:122), ASN(B:24), CYS(B:21), GLN(B:447), GLU(B:451), LEU(B:138), ARG(B:455), CYS(B:32) and TYR(B:116) amino acid residues of the active site of COX-2 to display the good docking score as exhibited by standard one.
Next to these, ADMET properties were predicted for all selected phytochemical ligands and two of the potential anti-inflammatories (Table 3) to know the drug likeliness which shows some of the phytochemical ligands are drug likely molecule and have zero Lipinski violation and some of them shows 1–2 Lipinski violation. The results of ADMET prediction shows that celecoxib and aspirin also possess hepatotoxicity.
|
Ligands |
MW |
nRB |
nHBA |
nHBD |
TPSA |
MLogP |
LD 50 |
HPT |
nLV |
|---|---|---|---|---|---|---|---|---|---|
|
1 |
566.55 |
10 |
13 |
5 |
190.67 |
-1.2 |
2.321 |
No |
2 |
|
2 |
568.52 |
9 |
14 |
7 |
221.9 |
-1.88 |
2.39 |
No |
3 |
|
3 |
552.52 |
9 |
13 |
6 |
201.67 |
-1.4 |
2.43 |
No |
3 |
|
4 |
568.52 |
9 |
14 |
8 |
232.9 |
-2.69 |
2.214 |
Yes |
3 |
|
5 |
566.55 |
10 |
13 |
5 |
190.67 |
-1.2 |
2.318 |
No |
2 |
|
6 |
610.56 |
11 |
15 |
9 |
245.29 |
-2.57 |
2.264 |
Yes |
3 |
|
7 |
406.38 |
5 |
11 |
6 |
175.37 |
-2.52 |
2.26 |
Yes |
2 |
|
8 |
422.38 |
6 |
12 |
7 |
195.6 |
-3.28 |
2.279 |
Yes |
2 |
|
9 |
154.16 |
0 |
3 |
1 |
46.53 |
-0.23 |
2.903 |
No |
0 |
|
10 |
448.38 |
4 |
11 |
7 |
190.28 |
-2.1 |
2.428 |
Yes |
2 |
|
11 |
534.55 |
9 |
11 |
5 |
172.21 |
-0.78 |
2.339 |
Yes |
2 |
|
12 |
536.53 |
9 |
12 |
5 |
181.44 |
-0.92 |
2.21 |
No |
2 |
|
13 |
630.59 |
12 |
14 |
5 |
207.74 |
-0.32 |
2.566 |
No |
2 |
|
14 |
478.45 |
9 |
11 |
7 |
186.37 |
-1.01 |
2.324 |
Yes |
2 |
|
15 |
614.59 |
11 |
13 |
4 |
187.51 |
0.43 |
2.582 |
No |
2 |
|
16 |
782.74 |
19 |
17 |
0 |
211.79 |
1.89 |
2.319 |
No |
2 |
|
17 |
494.49 |
8 |
11 |
4 |
161.21 |
-0.23 |
2.32 |
Yes |
1 |
|
18 |
662.64 |
16 |
15 |
0 |
185.49 |
1.3 |
2.511 |
No |
2 |
|
19 |
510.49 |
8 |
12 |
5 |
181.44 |
-0.99 |
2.324 |
Yes |
2 |
|
20 |
720.67 |
18 |
17 |
0 |
211.79 |
0.95 |
2.423 |
No |
2 |
|
21 |
778.71 |
21 |
19 |
0 |
238.09 |
0.61 |
2.434 |
Yes |
2 |
|
Aspirin |
180.16 |
3 |
4 |
1 |
63.60 |
1.51 |
2.377 |
No |
0 |
|
Celecoxib |
381.37 |
4 |
7 |
1 |
86.36 |
2.65 |
2.027 |
No |
0 |
| Where, MW = Molecular Weight, nRB = Number of Rotatory Bond, nHBA = Number of Hydrogen Bond Acceptor, nHBD = Number of Hydrogen Bond Donar, TPSA = Total Polar Surface Area, MLogP = Predicted Octanol/Water Partition Coefficient, LD50 = Oral Rat Acute Toxicity, HPT = Hepatotoxicity, nLV = Number of Lipinski Violations. | |||||||||
|
Ligands |
COX-2 Interacting residues |
COX-1 Interacting residues |
|---|---|---|
|
1 |
ASP(A:143, 144) GLY(A:121, B:310) CYS(A:21, 145, 22, 32) ALA(A:142) VAL(A:141) PRO(A:140, 139) ASN(A:24, 19) GLN(A:447, B:313) MET(A:33) GLU(B:308, 31, 312) TYR(A:122) TRP(B:309) SER(A:34) |
---- |
|
6 |
---- |
LEU(A:390) ALA(A:199) TRP(A:387) ALA(A:202) MET(A:391) THR(A:206) VAL(A:447) GLN(A:203) VAL(A:291) HIS(A:388) HIS(A:383) VAL(A:451) SER(A:455) LEU(A:460) MET(A:458) MET(A:379) GLU(A:454) LYS(A:211) THR(A:212) ASN(A:382) HIS(A:386) PHE(A:210) TYR(A:385) HIS(A:207) |
|
14 |
SER(B:34) TRP(A:309) GLN(A:313) GLU(A:308) TYR(B:122) ASN(B:19) ALA(B:142) ASN(B:24) VAL(B:141) CYS(B:22, 145, 21) GLN(B:447) GLU(B:441) LYS(B:454) ASN(B:28) ARG(B:29) LEU(B:138) ARG(B:455) GLY(B:30) CYS(B:32) PRO(B:139) TYR(B:116) GLY(B:14) MET(B:33) |
---- |
|
21 |
---- |
ALA(A:202) LEU(A:390) HIS(A:207, 388) VAL(A:291) LEU(A:298, 294, 295, 408) PHE(A:409) MET(A:391) ILE(A:444) HIS(A:443, 406) VAL(A:447) GLU(A:454) LYS(A:211) THR(A:212) HIS(A:385) ASN(A:382) PHE(A:210) THR(A:206) TYR(A:385) ALA(A:199) TRP(A:387) |
|
Aspirin |
---- |
LYS(A:532) GLN(A:372) SER(A:126) PHE(A:371) GLN(A:370) PRO(B:542) TYR(B:373) PRO(A:127) ILE(A:124) ASN(A:122) SER(A:121) |
|
Celecoxib |
CYS(D:32) TRP(C:309) MLT(D:33) TYR(D:122) PRO(D:14) HIS(D:119) VAL(D:119) CYS(D:21) GLY(D:121) ASP(D:143) PRO(D:139) PRO(D:25) ALA(D:142) |
--- |
Structure-Activity Relationship
The phytochemicals 1 and 14 contain a propenoate active group for interaction with COX-1/2 enzyme residues (Fig. 7). The compound 1-furan-2-yl-3-pyridine-2-yl-propenone (FPP-3) synthesized by Jahng and his colleagues possess the highest COX-2 inhibition potency (IC50 = 1.89 uM) which is a preclinical drug for the treatment of chronic inflammatory diseases like rheumatoid arthritis without causing any gastrointestinal ulcer [33, 34]. Further, the FPP-3 confirmed that 5,6-membered aromatic/heterocyclic rings at 1, 3 positions were the basis for its increased potency [35] and 3-substituted larger phenyl group shows better selectivity towards COX-2 isoform to reduce side effects [36]. The presence of (-SO2Me) group at five or six-membered rings attached to 1 or 3 positions enhanced the selectivity as well as activity of compound towards COX-2 isoform due to hydrogen bonding at the secondary active site of COX-2 [37, 38].
General
Double beam UV-Visible Spectrometer (Elico SL 218), Bruker Advance-400 (400 MHz for 1H-NMR and 100 MHz for 13C-NMR), Agilent Cary 630 FTIR Spectrometer (Range: 4000 − 450 cm-1) and Agilent 6520 Q-TOF Mass Spectrometer with AGILENT 1200 HPLC System (ESI/APCI-HRMS & LC-HRMS) were used to record the spectra.
Plant material
The plant was collected from the Chauraas Campus, HNB Garhwal University, District Tehri (UK, India) and the identification of the plant was done by the expertise of the Department of Botany, FRI, Dehradun, Uttarakhand and herbarium is deposited (210/Dis./2021/Syst.Bot./Rev.Gen./4–5).
Isolation and characterization
The leaves of Nyctanthes arbor-tristis was dried and powdered (Dry weight = 2 kg) and then extracted with n-Hexane, Chloroform, Ethyl acetate and Methanol respectively with 1:5 (wt/vol.) ratio of plant material and the solvent by using Soxhlet extractor. The extracts were concentrated at reduced pressure (70kPa) and temperature by using rotatory evaporator (Roteva®, Medica instrument MFG.). The extracts; n-Hexane (72.30 gm), Chloroform (87.54 gm), Ethyl acetate (78.67 gm) and Methanol (76.43 gm) were stored for further experiment.The methanolic extract was adsorbed on 20 gm of silica gel and chromatographed on column packed with silica gel (100–120 mesh 1.4 Kg) and eluted with mixture of chloroform and methanol with increasing mixture polarity (chloroform-methanol, 98:2, 96:4 to 60:40). The eluent of chloroform-methanol mixture at 92:8 and 82:18 gives crude 1(light yellow color powdered crystal) and 2 (white color hydroscopic crystal). The crude 1 and 2 were concentrated, washed with 2N HCL and recrystallized with dissolving in hexane. The compound 1 (140 mg) with molecular formula C27H34O13 shows following spectral data: MP: 226–229; [α]D: -93˚ (MeOH); UV (MeOH): 206, 227, 300 and 308 nm; 1H NMR (400 MHz, CDCl3): δ 1.02 (3H, d, J = 7.0 Hz), 2.08 (1H, q, J = 7.0, 5.5 Hz), 2.33 (1H, td, J = 5.4, 2.8 Hz), 2.94 (1H, dd, J = 6.9, 5.4 Hz), 3.12–3.25 (2H, 3.18 (dd, J = 3.5, 2.7 Hz), 3.20 (dd, J = 3.5, 2.7 Hz)), 3.44 (1H, td, J = 4.5, 2.7 Hz), 3.58–3.87 (9H, 3.63 (t, J = 3.5 Hz), 3.72 (s), 3.77 (s), 3.81 (d, J = 4.5 Hz), 3.81 (d, J = 4.5 Hz)), 4.07 (1H, dd, J = 8.1, 7.0 Hz), 4.52 (1H, d, J = 2.7 Hz), 4.86 (1H, dd, J = 8.1, 6.9 Hz), 6.34–6.58 (2H, 6.39 (d, J = 2.8 Hz), 6.51 (d, J = 15.7 Hz)), 7.16 (2H, ddd, J = 8.8, 1.2, 0.5 Hz), 7.49 (2H, ddd, J = 8.8, 1.7, 0.5 Hz), 7.71 (1H, d, J = 15.7 Hz), 7.95 (1H, s); 13C NMR (100 MHz, CDCl3): δ 19.3 (1C, s), 40.0 (1C, s), 40.7–40.8 (2C, 40.7 (s), 40.7 (s)), 52.2 (1C, s), 56.0 (1C, s), 62.3 (1C, s), 71.1 (1C, s), 74.0 (1C, s), 76.7 (1C, s), 78.1 (1C, s), 80.2 (1C, s), 86.2 (1C, s), 96.8 (1C, s), 99.2 (1C, s), 109.7 (1C, s), 114.3 (2C, s), 115.1 (1C, s), 128.7 (2C, s), 130.3 (1C, s), 145.6 (1C, s), 154.1 (1C, s), 159.8 (1C, s), 166.8 (1C, s), 168.5 (1C, s); IR bands (KBr, MeOH): 3424, 2950, 1719, 1662, 1633, 1514, 1450, 1377, 1220, 1180, 1050, 877, 835, 750 and 591 cm− 1; Ms (m/z): 402, 226, 200, 178, 161, 156.
The compound 2 (163 mg) with molecular formula C26H32O14 shows following spectral data, MP: 226–229; [α]D: -69˚ (MeOH); 1H NMR (400 MHz, CDCl3): δ 1.02 (3H, d, J = 7.0 Hz), 2.08 (1H, quintd, J = 7.0, 5.5 Hz), 2.33 (1H, td, J = 5.4, 2.8 Hz), 2.94 (1H, dd, J = 6.9, 5.4 Hz), 3.12–3.25 (2H, 3.18 (dd, J = 3.5, 2.7 Hz), 3.20 (dd, J = 3.5, 2.7 Hz)), 3.44 (1H, td, J = 4.5, 2.7 Hz), 3.58–3.87 (6H, 3.63 (t, J = 3.5 Hz), 3.72 (s), 3.81 (d, J = 4.5 Hz), 3.81 (d, J = 4.5 Hz)), 4.07 (1H, dd, J = 8.1, 7.0 Hz), 4.52 (1H, d, J = 2.7 Hz), 4.88 (1H, dd, J = 8.1, 6.9 Hz), 6.39 (1H, d, J = 2.8 Hz), 6.57 (1H, d, J = 15.7 Hz), 6.77 (1H, dd, J = 8.4, 0.5 Hz), 7.28 (1H, dd, J = 1.9, 0.5 Hz), 7.63–7.80 (2H, 7.69 (dd, J = 8.4, 1.9 Hz), 7.74 (d, J = 15.7 Hz)), 7.95 (1H, s); 13C NMR (100 MHz, CDCl3): δ 19.3 (1C, s), 40.0 (1C, s), 40.7–40.8 (2C, 40.7 s), 52.2 (1C, s), 62.3 (1C, s), 71.1 (1C, s), 74.0 (1C, s), 76.7 (1C, s), 78.1 (1C, s), 80.2 (1C, s), 86.2 (1C, s), 96.8 (1C, s), 99.2 (1C, s), 109.7 (1C, s), 114.8 (1C, s), 115.1 (1C, s), 115.8 (1C, s), 128.2 (1C, s), 128.7 (1C, s), 145.6 (1C, s), 145.8 (1C, s), 146.3 (1C, s), 154.1 (1C, s), 166.8 (1C, s), 168.5 (1C, s); IR bands (KBr, MeOH): 3350, 2920, 1690, 1630, 1520, 1440, 1270, 1080, 950, 860, 810 and 770 cm− 1; Ms (m/z): 404, 226, 210, 178, 163, 156.
Cyclooxygenase inhibition assay
The repressive action of various extracts against COX-2 was calculated by the fair marketable quality COX-(human) inhibitor screening kit (Catalog No. 701070, 701080, Cayman Chemical, PLM Pvt. Ltd., New Delhi, India) based on the producer’s directions. The prepared reaction buffer contains 160 uL, 0.1 M Tris-HCl (pH 8.0), 5mM EDTA and 2 mM phenol. COX-1/2 (10 uL) was added in 10uL, 30uM solution of each extract in the presence of 10 uL Heme solution. All these test solutions were relaxed for 10 minutes at 37°C. Further, 10 uL arachidonic acid and 30 uL stannous chloride were added to test solution (sample) and blank solution (control) to start the reaction to produce the PGF2α by the reduction of PGH2 and relaxed exactly for 5 minutes at 37°C. The amount of produced PGF2α was calculated for sample and control by immunoassay method using the UV microplate reader at the wavelength 410 nm to calculate the percentage inhibition. The following equation was used to calculate the percentage inhibition:

Where [PGF2α]control is PGF2α produced in blank solution (without extracts) and [PGF2α]sample is PGF2α produced in the test sample solution (with extracts). The test compounds, dissolved in 5% DMSO, were evaluated at a concentration of 30 µM.
ADMET Calculation
In order to know drug likeliness of molecule/ligand PKCSM [39] and Swiss ADME [40] was used to predict the molecular weight, water partition coefficient (MLogP), H-bond donors, H-bond acceptor, total polar surface area (TPSA), Lipinski (drug-likeness), hepatotoxicity and Oral Rat Acute Toxicity (LD50) [41].
Molecular docking study
Geometry optimization of reported molecules
The designing of all compounds was done by using ACD Chemsketch and their optimization was done by choosing molecular mechanics (MM2) as a force field. These optimized compounds were used for docking. The following 21 reported phytochemicals of Nyctanthes arbor-tristis were used for the docking: abortitristoside A (1), abortitristoside B (2), abortitristoside C (3), abortitristosideD (4), abortitristoside E (5), nyctoside A (6), 6-beta-hydroxyloganin (7), nyctanthoside (8), rngyolne (9), astragalin (10), 7-o-trans-cinnamoyl-6b-hydroxyloganin (11), 6-o-trans-cinnamoyl-6b-hydroxyloganin (12), 6,7-di-o-benzoylnyctanthoside (13), desrhamnosylverbanscoside (14), arborside A (15), arborside A tetraacetate (16), arborside B (17), arborside B tetraacetate (18), arborside C (19), arborside C pentaacetate (20), arborside D hexaacetate (21) [10].
Protein Preparation
The groundwork of protein was done employing UCSF Chimera 1.11.2 in dock prep module, where the deletion of inherent ligand attached to crystal structure, hydrogen addition, water, solvents, replacing partial residues employing Dunbrack rotamer library, renovation of bromo-UMP to UMP, renovation of selenomethionine to methionine, alteration of methylselenyl-dCMP to CPM. AMBER.ff14SB force field were used to dispensed the charges on protein molecule [42]. Then the augmented protein was used for docking study.
Molecular Docking, Docking parameters & Post Docking modeling
The docking of all reference compounds and the selected phytochemicals of Nyctanthes arbor-tristis was performed using PyRx against COX-1 (PDB ID – 3KK6) and COX-2 (PDB ID – 3LN1). This software used generic algorithms for the docking. The defined parameters in PyRx for docking with Grid center (X = 26.0916, Y = 157.3507, Z = 10.1225 for COX-1 and X = 48.1391, Y = 33.8036, 25.3268 for COX-2), Dimension (X = 82.5649, Y = 89.4395, Z = 118.3433 Å for COX-1 and X = 133.5613, 89.4395, 118.3433 Å for COX-2), population size (n = 200), generations (g = 10) and number of solutions for each compound (s = 1). Based on the above set parameters, the compounds were screened. The post dock modeling of docked poses was executed by Discovery studio visualizer v3.5.The top four compounds were chosen by considering the lowest energy of docking/binding. The binding energy of a ligand to the protein is given by:

where EVDW means for Vander Waal energy, EH−BOND means for hydrogen bonding energy and EELECTROSTATIC means for electro statistic energy [43].
As in the case of inflammation COX-2 enzyme is responsible while COX-1 involve to maintain normal physiology. Most of the known anti-inflammatory drugs inhibit both the isoenzyme and cause a peptic ulcer or gastrointestinal ulcer therefore a selective drug molecule is required. The in-vitro analysis of all the four fractions of the leave of Nyctanthes arbor-tristis shows that the methanolic fraction has the greatest potential to inhibit the COX-2 as compared to other fractions. Further in-vitro and in-vivo analysis of methanolic fraction in the different models also may provide a good therapeutic option to treat the inflammation. The molecular docking study of pre-isolated phytochemicals from the leave of the plant also shows that compounds 6 (-9.5 kcal/mol), 21 (-9.2 kcal/mol), 2 (-8.8 kcal/mol) and 1 (-8.3 kcal/mol) have the highest binding affinity/docking score for 3KK6 (COX-1 enzyme) while ligands 14(-10.3 kcal/mol), 1(-10.2 kcal/mol), 2(-10.2 kcal/mol) and 6(-9.8 kcal/mol) have highest binding affinity for 3LN1 (COX-2 enzyme) but compound 1, 2 and 14 also shows docking selectivity for COX-2 express the novelty for finding good NSAIDs. Therefore, the methanolic fraction was subjected to isolation and two compounds (abortristoside A and abortristoside B) were isolated and tested against COX-1 and COX-2. The in-vitro screening against COX-1 and COX-2 reflexes that compound 1 and compound 2 have selectivity for COX-2 over COX-1 with IC50 near to celecoxib which is also established by structure-activity relationship analysis. Further in-vitro analysis of 1 and 2 in the different models also may provide a good therapeutic option to treat the inflammation Therefore, in-vivo analysis of abortristoside A (1) and abortristoside B (2) in the different models may provide a good therapeutic option to treat the inflammation without causing any gastrointestinal ulcer. Desrhamnosylverbanscoside a verbascoside reported phytochemical of the Nyctanthes arbor-tristis shows the highest docking score which isolation and screening against COX-1/2 may give the potential anti-inflammatory agent. Further, we provide a new strategy to design potential selective COX-2 inhibitors from the plant-origin natural compound by using molecular docking technique, in-vitro screening of plant extract and isolated compounds in this paper.
Conflict of interest
The authors declare no conflict of interest.
Acknowledgment
The author expresses thanks to the CSIR-HRD, New Delhi for providing financial assistance in the form of an award of Junior Research Fellowship (Award No. 09/386(0061)/2018-EMR-1)
- Nagajyothi PC, Cha SJ, Yang IJ, Sreekanth TV, Kim KJ, Shin HM. Antioxidant and anti-inflammatory activities of zinc oxide nanoparticles synthesized using Polygala tenuifolia root extract. Journal of Photochemistry and Photobiology B: Biology. 2015;146:10-7.
- Hassan MM, Shahid-Ud-Daula AF, Jahan IA, Nimmi I, Adnan T, Hossain H. Anti-inflammatory activity, total flavonoids and tannin content from the ethanolic extract of Ageratum conyzoides linn. Leaf. International Journal of Pharmaceutical and Phytopharmacological Research. 2017;1(5):234-41.
- Cai X, Cao C, Li J, Chen F, Zhang S, Liu B, Zhang W, Zhang X, Ye L. Inflammatory factor TNF-α promotes the growth of breast cancer via the positive feedback loop of TNFR1/NF-κB (and/or p38)/p-STAT3/HBXIP/TNFR1. Oncotarget. 2017;8(35):58338.
- Recinella L, Chiavaroli A, Orlando G, Ferrante C, Marconi GD, Gesmundo I, Granata R, Cai R, Sha W, Schally AV, Brunetti L. Antinflammatory, antioxidant, and behavioral effects induced by administration of growth hormone-releasing hormone analogs in mice. Scientific reports. 2020;10(1):1-4.
- Cooper C, Chapurlat R, Al-Daghri N, Herrero-Beaumont G, Bruyère O, Rannou F, Roth R, Uebelhart D, Reginster JY. Safety of oral non-selective non-steroidal anti-inflammatory drugs in osteoarthritis: what does the literature say?. Drugs & aging. 2019;36(1):15-24.
- Mallick P, Taneja G, Moorthy B, Ghose R. Regulation of drug-metabolizing enzymes in infectious and inflammatory disease: Implications for biologics–small molecule drug interactions. Expert opinion on drug metabolism & toxi. 2017;13(6):605-16.
- Ameen AM, Elkazaz AY, Mohammad HM, Barakat BM. Anti-inflammatory and neuroprotective activity of boswellic acids in rotenone parkinsonian rats. Canadian journal of physiology and pharmacology. 2017;95(7):819-29.
- Leone S, Recinella L, Chiavaroli A, Orlando G, Ferrante C, Caramanico M, Cai R, Sha W, Salvatori R, Schally A, Brunetti L. MON-478 Antinflammatory and Antioxidant Effects of MIA-690 and MR-409 in GHRHKO Mice Colon and Prefrontal Cortex. Journal of the Endocrine Society. 2019;3(1):475-478.
- Smith WL, Fitzpatrick FA. The eicosanoids: cyclooxygenase, lipoxygenase, and epoxygenase pathways. New Comprehensive Biochemistry. 1996;31:283-307. https://doi.org/10.1016/S0167-7306(02)36015-0.
- Rouzer CA, Marnett LJ. Endocannabinoid oxygenation by cyclooxygenases, lipoxygenases, and cytochromes P450: cross-talk between the eicosanoid and endocannabinoid signaling pathways. Chemical reviews. 2011;111(10):5899-921. https://doi.org/10.1021/cr2002799.
- Sharma NP, Dong L, Yuan C, Noon KR, Smith WL. Asymmetric acetylation of the cyclooxygenase-2 homodimer by aspirin and its effects on the oxygenation of arachidonic, eicosapentaenoic, and docosahexaenoic acids. Molecular pharmacology. 2010;77(6):979-86. https://doi.org/10.1124/mol.109.063115.
- Smith WL, Urade Y, Jakobsson PJ. Enzymes of the cyclooxygenase pathways of prostanoid biosynthesis. Chemical reviews. 2011;111(10):5821-65. https://doi.org/10.1021/cr2002992.
- Clària J. Cyclooxygenase-2 biology. Current pharmaceutical design. 2003;9(27):2177-90. https://doi.org/10.2174/138161203345405
- Hyde CA, Missailidis S. Inhibition of arachidonic acid metabolism and its implication on cell proliferation and tumour-angiogenesis. International immunopharmacology. 2009;9(6):701-15. https://doi.org/10.1016/j.intimp.2009.02.003.
- Willerson JT, Ridker PM. Inflammation as a cardiovascular risk factor. Circulation. 2004;109(21):2-10. https://doi.org/10.1161/01.CIR.0000129535.04194.38
- Abou-Raya A, Abou-Raya S. Inflammation: a pivotal link between autoimmune diseases and atherosclerosis. Autoimmunity reviews. 2006;5(5):331-7. https://doi.org/10.1016/j.autrev-2005.12.006.
- Coussens LM, Werb Z. Inflammation and cancer. Nature. 2002;420(6917):860-7. https://doi.org/10.1038/nature01322.
- Lucas SM, Rothwell NJ, Gibson RM. The role of inflammation in CNS injury and disease. British journal of pharmacology. 2006;147(S1):S232-40. https://doi.org/10.1038/sj.bjp.0706400.
- Chetty M, Sivaji K and Rao KT. Flowering plants of Chittoor district Andhra Pradhesh, 1 edition, Published by student offset printer, Tirupati, 2008; 193. 3.
- Mathuram V and Kundu AB. Occurrence of two new ester of 6-Hydroxyloganin in Nyctanthes arbortristis. J Indian Chem Soc. 1991;68:581-584.
- Saxena RS, Gupta B, Saxena KK and Srivastava VK and Prasad DN. Analgesic, antipyretic and ulcerogenic activities of Nyctanthes arbortristis leaf extract. J Ethnopharmacol. 1987;19:193-200.
- Amarite O, Bhuskat P, Patel N and Gadgoli. C. Evaluation of antioxidant activity of carotenoid from Nyctanthes arbortristis. Int J Pharmacol Biol Sci. 2007;2:57-59.
- Rathee JS, Shyam, Hassarajani and Subrata C. Antioxidant activity of Nyctanthes arbortristis leaf extract. Food Chem. 2007;103:1350-1357.
- Omkar A, Jeeja T and Chhaya G. Evaluation of anti-inflammatory activity of Nyctanthes arbortristis and Onosma echiodes. Phrmacog. mag. 2006;8:258-260.
- Nadkarni AK. Indian Materia Medica, Vol.I, 3rd ed. (Popular Prakashan Pvt. Ltd.,) 1982;857-858.
- Kirtikar KR and Basu BD. Indian Medicinal Plants, Vol.VII, (Sri Satguru Publications, New Delhi,) 2000;2110-2113.
- Wealth of India, A Dictionary of Indian Raw Materials and Industrial Products, Vol.VII, (National Institute of Science Communication, CSIR, New Delhi), 1997; 69-70.
- Gupta P Bajpai SK, Chandra K, Singh KL and Tandon JS. Antiviral profile of Nyctanthes arbortristis L. against encephalitis causing viruses. Indian J Exp Biol. 2005;43:1156- 1160.
- Das S, Sasmal D, Basu SP. Anti-inflammatory and antinociceptive activity of arbortristoside-A. Journal of Ethnopharmacology. 2008;116(1):198-203. https://doi.org/10.1016/j.jep.2007.11.034.
- Purushothaman KK, Venkatanarasimhan M, Sarada A. Arbortristoside A and B, two iridoid glucosides from Nyctanthes arbor-tristis. Phytochemistry. 1985;24(4):773-6. https://doi.org/10.1016/s0031-9422(00)84892-x.
- Jeong HJ, Han NR, Kim KY, Choi IS, Kim HM. Gomisin A decreases the LPS-induced expression of iNOS and COX-2 and activation of RIP2/NF-κB in mouse peritoneal macrophages. Immunopharmacology and Immunotoxicology. 2014 Jun 1;36(3):195-201. https://doi.org/10.3109/08923973.2014.909848.
- Bourn J, Cekanova M. Cyclooxygenase inhibitors potentiate receptor tyrosine kinase therapies in bladder cancer cells in vitro. Drug Design, Development and Therapy. 2018;12:1727. https://doi.org/2147/DDDT.S158518
- Shanmugam S, Lee ES, Lee SK, Jeon TW, Yong CS, Yoo BK. The Effect of 1-Furan-2-yl-3-pyridine-2-yl-propenone on Pharmacokinetic Parameters of Theophylline. Biological and Pharmaceutical Bulletin. 2006;29(6):1282-5. https://doi.org/10.1007/BF02978843
- Lee ES, Park BC, Paek SH, Lee YS, Basnet A, Jin DQ, Choi HG, Yong CS, Kim JA. Potent analgesic and anti-inflammatory activities of 1-furan-2-yl-3-pyridin-2-yl-propenone with gastric ulcer sparing effect. Biological and Pharmaceutical Bulletin. 2006;29(2):361-4. https://doi.org/10.1248/bpb.29.361
- Jahng Y, Zhao LX, Moon YS, Basnet A, Kim EK, Chang HW, Ju HK, Jeong TC, Lee ES. Simple aromatic compounds containing propenone moiety show considerable dual COX/5-LOX inhibitory activities. Bioorganic & medicinal chemistry letters. 2004;14(10):2559-62. https://doi.org/10.1016/j.bmcl.2004.02.099
- Moreau A, Chen QH, Rao PP, Knaus EE. Design, synthesis, and biological evaluation of (E)-3-(4-methanesulfonylphenyl)-2-(aryl) acrylic acids as dual inhibitors of cyclooxygenases and lipoxygenases. Bioorganic & medicinal chemistry. 2006;14(23):7716-27. https://doi.org/10.1016/j.bmc.2006.08.008
- Manju SL, Ethiraj KR, Elias G. Safer anti-inflammatory therapy through dual COX-2/5-LOX inhibitors: A structure-based approach. European Journal of Pharmaceutical Sciences. 2018 Aug 30;121:356-81. https://doi.org/10.1016/j.ejps.2018.06.003
- Pontiki E, Hadjipavlou-Litina D, Litinas K, Nicolotti O, Carotti A. Design, synthesis and pharmacobiological evaluation of novel acrylic acid derivatives acting as lipoxygenase and cyclooxygenase-1 inhibitors with antioxidant and anti-inflammatory activities. European journal of medicinal chemistry. 2011;46(1):191-200. https://doi.org/10.1016/j.ejmech.2010.10.035
- Pkcsm In: Biosig.unimelb.edu.au. http://biosig.unimelb.edu.au/pkcsm/prediction.
- SwissADME. In: Swissadme.ch. https://www.swissadme.ch.
- Lipinski CA. Lead-and drug-like compounds: the rule-of-five revolution. Drug disc. today: Technologies. 2004;1(4):337-41.
- Trott O, Olson AJ. AutoDock Vina: improving the speed and accuracy of docking with a new scoring function, efficient optimization, and multithreading. Journal of computational chemistry. 2010;31(2):455-61.
- Forli S, Huey R, Pique ME, Sanner MF, Goodsell DS, Olson AJ. Computational protein–ligand docking and virtual drug screening with the AutoDock suite. Nature Protocols. 2016;11(5):905–19. https://www.nature.com/articles/nprot.2016.051.