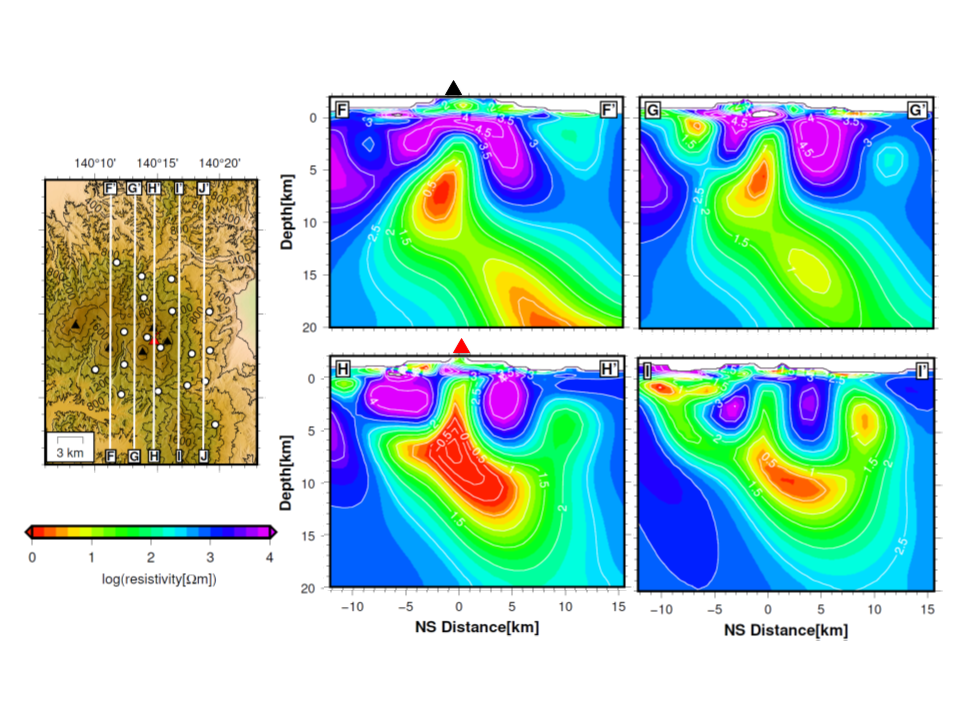
An electrical resistivity image beneath Azumayama Volcano, NE Japan is modeled using magnetotellurics to probe the magma/hydrothermal fluid distribution. The 3-D inversion modeling images the conductive magma reservoir beneath Oana crater at depths of 3–15 km. The resolution scale for the conductor is 5 km by checkerboard resolution tests and the 67 % and 90 % confidential intervals of resistivity are 0.2–5 Ωm and 0.02–70 Ωm, respectively, for the region of less than 3 Ωm resistivity. The shallower part of the conductor is not explained by a water-saturated (5.5 wt %) dacitic melt, and the more probable interpretation is that it consists of a water-saturated, dacitic melt-silicic rock-hydrothermal fluid complex. The deeper part of the conductor is interpreted as a water-saturated (8 wt %) andesitic melt-mafic rock complex. The Mogi inflation source determined from GNSS and tilt data is located near the top boundary of the conductor at a depth of 2.7–3.7 km, which suggests that the ascent of hydrothermal fluids exsolved from the dacitic melt is interrupted by the impermeable wall and conduit. Assuming two phases of hydrothermal fluid and silicic rock, the resistivity at the inflation source, regarded as the upper bound resistivity of the conductor, is realized by the hydrothermal fluid fraction below the percolation threshold porosity in an effusive eruption. This indicates that the percolation threshold porosity in an effusive eruption characterizes the impermeable wall and conduit associated with the Mogi inflation source.