The COX2/PGE2 axis is co-related with Sj-induced liver fibrosis
Our previous studies have shown that the extent of hepatic fibrosis reached advanced levels at week (wk) 8 of Sj infection [27, 32]. To evaluate the correlation among COX2/PGE2 axis and hepatic fibrosis, the transcriptional level of COX2, Ptges, Ptger1-4, Abcc4 and Slco2a1 in mice liver were measured using RT-qPCR (Fig. 1a), and the translational level of COX2, mPGES-1 and EP1-4 in mice liver were detected by western blotting (Fig. 1b) in 8-week Sj-infected and uninfected mice groups. Compared with the uninfected mice, the RNA expression level of COX2, Ptges, Ptger1-4 andAbcc4 significantly increased, while Slco2a1was significantly decreased (t-test: wk 8vs (-): COX2: t(12) = 5.690, P = 0.0001; Ptges: t(12) = 9.702, P < 0.0001; Ptger1: t(12) = 12.02, P < 0.0001; Ptger2: t(12) = 9.783, p < 0.0001; Ptger3: t(12) = 8.954, P < 0.0001; Ptger4: t(12) = 9.550, P < 0.0001; Abcc4: t (12) = 10.58, p < 0.0001; Slco2a1: t(12) = 2.888, P = 0.0136).Protein expression levels of COX2, mPGES-1and EP2, EP4 were also increased in wk 8 Sj-infected mice.
To assess whether the COX2/PGE2 axis is involved in the formation of liver fibrosis induced by Sj infection, we started to inject the COX2 inhibitor NS398 to Sj-infected mice at week 5 of infection. The whole treatment lasted for 3 weeks. NS398 treatment lowered the protein expression levels of COX2, mPGES-1, EP4 and α-SMA, Col I according to western blotting result (Fig. 2a, 2b) (t-test: DMSO/Sj(+) vs NS398/Sj(+): COX2: t(8) = 5.409, P = 0.0006; mPGES-1: t(8) = 2.450, P = 0.0399; EP4: t(8) = 2.660, P = 0.0288; α-SMA: t(8) = 2.453, P = 0.0397; COL1: t(8) = 2.569, P = 0.0332), without significant change of EP2(t-test: DMSO/Sj(+) vs NS398/Sj(+): t(8) = 0.8025,P = 0.9534). The expression of α-SMA changed from moderate to low level and Col I from high to moderate level according to Image J evaluated results. in the IHC assay (Fig. 2c-2f)(t-test: DMSO/Sj(+) vs NS398/Sj(+): α-SMA: t(53) = 3.437, P = 0.0012; COL1: t(34) = 5.107, P < 0.0001). In addition, the NS398-treated mice exhibited a significant reduction in the extent of collagen deposition after Sj infection (Fig. 2g, 2 h) (t-test: DMSO/Sj(+) vs NS398/Sj(+): t(29) = 3.681, P = 0.0010). The averageSj eggs load in the per liver section showed the tendency to increase but without significant differences (Fig. 2i) (t-test: DMSO/Sj(+) vs NS398/Sj(+): t(6) = 0.8619, P = 0.4218). These indicated that the COX2/PGE2 axis is not only positively associated with CDAA-, TAA- and BDL-induced rat liver fibrosis [10, 11] and liver cirrhosis in rats, mice, and patients [9, 12], but also positively related with Sj infection-induced liver fibrosis.
TLR4 pathway activation stimulated the COX2/PGE2 axis, in Sj-infected mice andin LPS-exposed cultured HSCs
TLR4 signaling has been reported to induce HSCs activation and liver fibrosis through many mechanisms [22, 23]). The relationship of TLR4 and COX2/PGE2 axis in the Sj-infected liver is still unknown. To determine whether the TLR4 pathway regulates the COX2/PGE2 axis during Sj infection-induced liver fibrosis, we examined the levels of several key proteins in this axis using infected mice liver after TAK242 treatment. TAK242 treatment down-regulated the expression of mPGES-1, EP2, and EP4 in infected mice liver (Fig. 3a). Albumin (ALB) has been reported to trigger PGE2 degradation [9, 30]. Herein, the level of sera ALB was significantly lowered in the 8-week Sj-infected group compared to the non-infected one and TAK242 treatment did not reverse this reduction (Fig. 3b)(t-test, Sj(+) vsSj(-): t(5) = 5.932, P = 0.0019). This observation rules out an implication of albumin in modulating PGE2 levels as a result of TLR4 pathway inhibition. Because Sj egg deposition increased the richness of microbiome in the gut of infected mice [33], we checked the level of LPS in serum, which might increase as a result from the larger quantities of Gram-negative bacteria in the gut. The concentration of serum LPS slightly increased gradually with Sj infection (Fig. 3c) (Ordinary one-way ANOVA, F(4, 5) = 14.43, P = 0.0059, followed by Uncorrected Fisher’s LSD-ttest: wk 5 vs (-): P = 0.7332, wk 6 vs (-): P = 0.2824, wk 8vs (-): P = 0.0196, wk 12vs (-): P = 0.0013), likely to a too limited extent to produce a significant biological response.
To validate whether the TLR4 pathway regulates the COX2/PGE2 axis in the human HSCs line -LX-2, we examined the levels of several key proteins in this axis using cells exposed to LPS alone or after TAK242 treatment. COX2, mPGES-1, EP2 and EP4 were distinctly induced by LPS in a dose-dependent manner (Fig. 4a), and TAK242 pre-treatment gradually lowered these inductions, especially at a dose of 10uM (Fig. 4b).
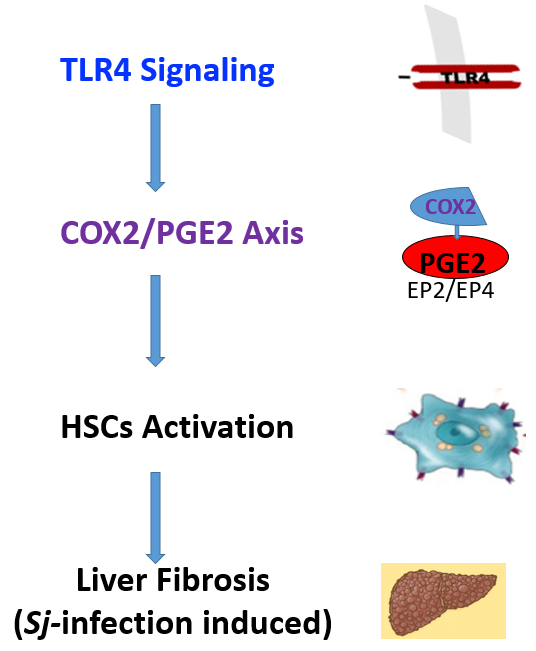
In summary, our data are compatible with the model according to which TLR4 pathway activation stimulates the COX2/PGE2 axis, in Sj-infected mice andin LPS-exposed cultured HSCs.
Confirmation of the relationship between TLR4 signaling and HSCs activation & fibrogenesis
To verify the correlation between TLR4 signaling and HSCs activation and fibrogenesis, the LX-2 HSCs were employed and protein expression levels were monitored after exposure to LPS, or treatment with TAK242 or TLR4-specific siRNAs. LPS treatment from 1 ng/mL to 1ug/mL activated TLR4 signaling as monitored by the increased expression levels of TLR4 and p-p65, and the up-regulated protein expression of α-SMA and COL I (Fig. 5a). The protein levels of TLR4 and α-SMA in LPS-treated LX-2 (100 ng/ml) increased with the time of incubation (Fig. 5b). The increased TLR4, p-p65, α-SMA and COL I levels after LPS stimulation were reduced by TAK242 treatment, especially at a dose of 10uM (Fig. 5c). The up-regulation of α-SMA and COL I induced by LPS treatment were markedly decreased after TLR4-specific siRNA transfection (Fig. 5d). These data confirmed that TLR4 signaling is positively associated with HSCs activation and fibrogenesis.
The COX2/PGE2 axis was required for TLR4 signaling-induced HSCs activation and fibrogenesis
To assess the role of PGE2 in HSCs activation, we treated the LX-2 cell line with synthetic PGE2. HSCs activation was enhanced by synthetic PGE2 as monitored by the augmentation of α-SMA protein expression, while the expression of both EP2 and EP4 increased with the time of incubation (Fig. 6a). As reported in macrophages, intestinal epithelial cells, esophageal, and auditory cells [28, 29, 30, 31, 34], TLR4 signaling controls the activation of COX2-PGE2 pathway. Herein, we observed that in cultured HSCs, the activation of TLR4 signaling by LPS increased the protein expression levels of COX2, mPGES-1, EP2, EP4, α-SMA, and COL-I. These increased expression levels were reduced by NS398 treatment, especially at doses of 7.5uM and 10uM (Fig. 6b). Therefore, TLR4 signaling-dependent HSC activation and fibrogenesis is mediated at least partially through COX2/PGE2 axis.