The east-west ward variation of MAGDAS/CPMN magnetometer 1-hour time resolution data at Davao (Philippines) station operated by International Center for Space Weather Science and Education, Kyushu University from August 1998 to July 2020 are used to investigate the characteristics of the long-term Inter-hemispheric field-aligned currents (IHFACs). The recent in-situ satellite and ground-based observations have reported the dusk-side current polarity of IHFACs are often inconsistent with the Fukushima’s IHFACs model. We investigated whether the dusk-side IHFACs polarity is consistent or not with the current direction predicted by Fukushima’s IHFACs model, by analyzing the time-series data of the day-to-day IHFACs variations. We confirmed that the solstices dusk IHFACs flow the same direction of noon IHFACs and the equinoxes dusk IHFACs disagree with Fukushima’s model. Seasonal IHFACs variations exhibited remarkable asymmetry in both dawn and noon sectors. By contrast, the profile of dusk-side IHFACs intensity was symmetry. We presented that solar cycle dependence can be seen in the peak-to-peak amplitude, monthly average and yearly integral intensity of IHFACs. However, while the dawn and noon IHFACs intensity decreased with year by year, the dusk intensity tended to increase year-to-year. In contrast to annual variations of IHFACs polarity in the dawn/noon sectors, there were multiple periodicities in the dusk sector: annual variation during the declining phase of solar cycle and semiannual or terannual variations during the increasing and maximum phase. The dusk-side day-to-day IHFACs variations were more coherent with F10.7 variability compared with the dawn and noon sectors. It suggests that the dusk IHFACs is affected by the solar cycle activities.
Express Letter
Long-Term Analysis of Day-To-Day Equatorial IHFACs Variations During Solar Cycle 23-24
https://doi.org/10.21203/rs.3.rs-139626/v1
This work is licensed under a CC BY 4.0 License
Journal Publication
published 21 Jul, 2021
You are reading this latest preprint version
Inter-hemispheric field-aligned currents (IHFACs)
ground-based magnetometer data
equatorial magnetic field
solar cycle SC23 and SC24
MAGDAS/CPMN
seasonal variations
Fukushima’s model
Inter-hemispheric field-aligned currents (IHFACs) are one of the major current systems causing changes in geomagnetic field around low and mid latitudes. IHFACs flow from the summer hemisphere to the winter hemisphere in the dawn sector and from the winter hemisphere to the summer hemisphere in the noon and dusk sectors (Fukushima, 1994). Van Sabben (1966) first suggested the existence of IHFACs by using the north-south difference of equivalent Sq current. The IHFACs are caused by inter-hemispheric imbalance of the ionospheric solar quiet (Sq) current system at the mid-low latitudes (Van Sabben, 1966; 1969; 1970), due to asymmetry of the north-south Sq current vortices that established a potential difference between the northern and southern hemispheres (Fukushima, 1979; Tomás et al., 2009). Many numerical calculation studies have predicted IHFACs intensity and supported the dependence of IHFACs current polarity changing with local time (Maeda, 1974; Schieldge et al., 1973; Stening, 1977; Takeda, 1982; Van Sabben,1969, 1970).
Fukushima’s IHFACs model is characterized by (1) IHFACs flow from the summer hemisphere to the winter hemisphere in the dawn sector and the opposite current flows in the noon sector, (2) IHFACs current polarity between the noon and dusk sector is in-phase and (3) the absolute intensity of IHFACs is stronger in both dawn and noon sectors than the dusk sector. The current polarity of Fukushima’s IHFACs model has been supported by in-situ satellite observations and ground-based magnetometer data analysis as well as the above-mentioned numerical studies. The first experimental evidence has been provided from Magsat observations (Olsen, 1997). The morphology of IHFACs has been extensively described by many papers, for example, seasonal climatology of IHFACs by Ørsted satellite (Yamashita and Iyemori, 2002), seasonal, longitudinal and local-time IHFACs climatology by CHAMP satellite (Park et al., 2011) and Swarm satellite constellation (Lühr et al., 2015; 2019; Fathy et al., 2019), ground-based local-time and seasonal dependence (Bolaji et al., 2012; Shinbori et al., 2017; Abidin et al., 2019), latitudinal dependence (Owolabi et al., 2018; Park et al., 2020a).
In recent years, unexpected IHFACs characteristics in dusk sector have been reported by the ground-based magnetometer (Shinbori et al., 2017) and satellite observations (Lühr et al., 2015; 2019; Fathy et al., 2019; Park et al., 2011; 2020a; 2020b). The dusk-side current polarity of IHFACs is often inconsistent with the Fukushima’s IHFACs model. These papers show the dusk-side IHFACs flowing southbound irrespective of season, by using the average value of magnetic field obtained from in-situ satellite or ground-based magnetometer observations for each month in 1-hour local time (LT) bin. Although this analysis revealed the major distribution of IHFACs polarity, a little attention has been paid to the day-to-day IHFACs variations. In addition, their analysis periods were almost limited to demonstrate the solar cycle dependence of IHFACs, namely less than solar cycle period (11 years) (e.g. Park et al., 2011; Owolabi et al., 2018; Lühr et al., 2019). Shinbori et al. (2017), only, used long-term (59 years) ground-based magnetometer data for the comparison of IHFACs intensity between higher and lower solar activity periods. They, however, separated the observational data into two groups and discussed the solar cycle dependence of IHFACs, not examined the day-to-day IHFACs variations. Therefore, the dusk-side IHFACs polarity still remains controversial.
In order to conclude the existence of the dusk-side IHFACs predicted Fukushima’s model, it is important to conduct a long-term time-series analysis of IHFACs variations in terms of day-to-day IHFACs variations. In contrast to the in-situ satellite observations which provides the global distribution of IHFACs on the two-dimensional map (longitude-latitude), the ground-based magnetometer data allows us to investigate the day-to-day IHFACs variations. Especially, the equatorial D-component magnetic fields are used in this paper, since they include more essential effects of IHFACs variation than the equatorial H-component magnetic fields which are dominated by the equatorial electrojet effect (Yamazaki and Maute, 2017).
The field-aligned currents (FACs) observed at the high latitude regions are excited by the plasma environment and its dynamics in the magnetosphere. Their extinction strongly reflects the interaction between the solar wind, magnetosphere, and ionosphere. On the other hand, the IHFAC, which we focus on in this study, is a current system flows along the magnetic field line that is excited by reflecting the asymmetry of ionospheric current system between northern and southern hemispheres. At the low and mid-latitudinal region, electromotive forces for generation of ionospheric current are dynamo effect by the atmospheric wind and penetrated electric field from polar to equatorial ionosphere in which involves variety range of spatiotemporal phenomena. Therefore, a close examination of the IHFAC is very important for understanding the magnetosphere-ionosphere coupling system excited by the solar wind, the global atmospheric motion driven by sunlight, and the electromagnetic environment of the global near-earth system resulting from their coupling. However, most of the related studies that have been carried out so far confirm the existence of IHFACs, and even the morphology of their appearance tendency has not yet been established. Since IHFACs are excited along the magnetic field lines at the mid- and low-latitude regions, their development is known to be remarkably appeared in the east-west component of the ground magnetic field data. The purpose of this study is to understand the long-term variation of the IHFAC using the east-west component of the low-latitude geomagnetic field data continuously observed for two solar activity cycles, and to develop the leading edge of systematic IHFAC research.
The main aim of this paper is to investigate whether the dusk-side IHFACs polarity is completely inconsistent with the current direction predicted by Fukushima’s IHFACs model. The present study puts its focus on analyzing the time-series data analysis of the day-to-day IHFACs variations and using long-term ground-based equatorial magnetometer data from 1998 to 2020 for the examination of the solar cycle dependence in IHFACs. About 22-year long-term analysis enables us to investigate the solar cycle dependence of IHFACs (Fujimoto et al., 2016), which is the secondary purpose of this work. In Sect. 2, we briefly describe observation data, their sources, and data analysis method to determine the variation of IHFACs (∆D). In Sect. 3, we show day-to-day variations of ∆D, climatology of IHFACs polarity and solar cycle dependence of IHFACs. In Sect. 4, we discuss the seasonal dependence of dusk-side IHFACs polarity and solar cycle dependence of periodicity and intensity of IHFACs. We summarize the present study in Sect. 5.
Observation data and Analysis Method
We used long-term MAGnetic Data Acquisition System/Circum-pan Pacific Magnetometer Network Data (MAGDAS/CPMN) magnetometer 1-hour time resolution data at Davao station (Geographical latitude 7˚N, Geographical longitude 124.5˚E, Geomagnetic latitude − 2.22˚N, Geomagnetic longitude 197.9˚E, Dip latitude − 0.24˚) operated by International Center for Space Weather Science and Education (ICSWSE), Kyushu University (Yumoto et al.,1996; 2001; 2006; 2007), from 1998 August-2020 July. The D-component (east-west direction) of magnetic field was analyzed for investigating the characteristics of IHFACs, since the northward (southward) IHFACs induce the westward (eastward) magnetic field variations on the ground. In this paper, “northward (southward) IHFACs” is referred as the current flowing from southern (northward) hemisphere to northern (southward) hemisphere. The westward (eastward) ∆D magnetic field corresponds to the northward (southward) IHFACs.
To derive IHFAC effect from the D-component variation, we first subtracted the base line calculated by using the midnight averaged values from each hour data point. Since the source of the daytime ionospheric wind dynamo is the solar daily radiations, the magnetic effect of this dynamo is generally negligible during the nighttime (Yamazaki and Maute, 2017). Fambitakoye and Mayaud (1976) determined the base level by interpolating linearly between two midnights neighboring the day considered. This derivation manner was adapted in this paper. The residual of D-component variations was defined as ∆D, and ∆D was calculated according to the Eq. (4).
Daily variation of the D component was calculated with respect to the midnight-to-midnight baseline (daily baseline). Midnight data points for the daily baseline were selected as hourly values of previous day 23:00H (Dp23h, the subscript “p” indicates “previous”), previous midnight 00:00H (Dp00h), target day 01:00H (D00h), target day 23:00H (D23h), next midnight 00:00H (Dn00h, the subscript “n” indicates “next”) and next day 01:00H (Dn01h). The baseline was calculated as a linear function which fits for these six data points of adjacent midnights. The linear function is represented as the following Eq. (1) and slope (a) and y-intercept (b) are constants to be determined.
y = ax +b (1)
Domain values for x were determined as (-1, 0, 1, 23, 24, 25) according to the function (2) below so that the distance between x values of any adjacent hours become one and the distance between any x values gives the number of hours between those data points.

The linear function constants a and b were calculated using Least Squares Polynomial Fit technique so that the calculated linear function can represent as possible as all data points. The projected data points of the daily base line for any given hour were calculated according to the Eq. (3) below.
Db(h) = ah + b, {h є Z|-1 ≤ h ≤ 25} (3)
D component variation with respect to daily baseline (∆D) is calculated as below. ∆D represent the daily variation of the D component relative to the daily base line. Value of ∆D was calculated as per the equation below for each day.
ΔDh = Dh - Db(h), {h є Z}|0 ≤ h ≤ 23} (4)
F10.7 cm Radio Flux index (F10.7) and Dst index were used to monitor the solar cycle activities and the magnetospheric disturbances, respectively. Daily F10.7 and Dst indexes data were obtained from SPDF OMNIWeb (King and Papitashvili 2005; SPDF-OMNIWeb Service 2020). The analysis periods from 1998 to 2020 have almost covered last two solar cycles SC23 (1996–2008) and SC24 (2008–2019, NASA officially released that SC25 has begun in 2019 December [NASA 2020]).
Day-to-day of IHFACs variations
We examined day-to-day ∆D variations to demonstrate the transition of IHFACs polarity, especially the dusk-side IHFACs polarity change. Figure 1 shows examples of day-to-day IHFAC-∆D variations as a function of local time (LT) and day of year, in 2010, 2013, 2015 and 2016. The direction of HFACs among both hemispheres was flipped twice around February and October, but not exactly on March/September equinoxes. During March-September months, the eastward ∆D (= southward IHFACs) and the westward ∆D (= northward IHFACs) were observed in the dawn (06–08 h, LT) and noon (11–13 h, LT) sectors, respectively. For these two sectors, the directions of IHFACs from October to February were opposite to those of March-September months. The dusk (16–18 h, LT) polarity of IHFACs around June/December solstices was roughly in-phase with that of the noon sector. The out-of-phase of IHFACs polarity between the noon and dusk sectors often occurred throughout rest of each year.
Climatology of IHFACs polarity
We applied the 61-days centered moving average to day-to-day ∆D variations with respect to each local time, in order to thoroughly identify the long-term transition of IHFACs polarity. Figure 2 shows the long-term transition of IHFACs polarity from 1999 to 2019 with F10.7 and Dst-index. We found annual cyclic variations of IHFACs polarity in the dawn and noon sectors and multiple periodicities in the dusk sector annual variation. Figure 2 (b-d) give the time series variations of IHFACs intensity in each LT sector (dawn, noon and dusk). We can see that the relationship between IHFACs polarity in the dawn and noon sectors is out-of-phase ~ 180˚. As shown in Fig. 2d, the dusk IHFACs polarity has annual variation during the declining phase of solar cycle and semiannual or terannual variations during the solar cycle’s ascending-maximum phase.
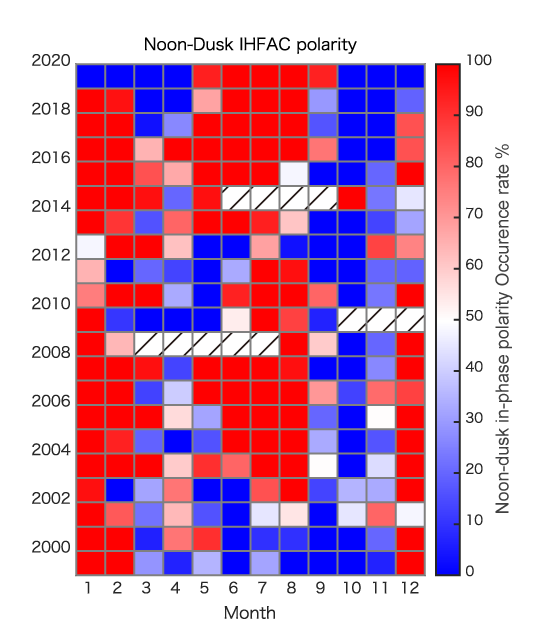
In order to clarify the seasonal occurrence rate of the noon-dusk in-phase IHFACs polarity, we calculated the ratio of in-phase polarity days to the total number of observation days for each month in each year bin (Fig. 3a). The significantly higher occurrence of in-phase days appeared in solstices and the higher occurrence of out-of-phase days dominantly happened from September to November. The slightly higher occurrence rate of out-of-phase polarity was found around March equinox.
We detected that the distribution of occurrence rate is separated into three groups: 1999–2000, 2001–2017 and 2018–2019. The coincident and incoincident relationship between dusk-side HFACs observations and Fukushima's model is summarized in Table 1, representing that the dusk-side observational solstices IHFACs agrees with Fukushima's model and the incoincident observational IHFACs inhabit in other months.
Solar cycle dependence of IHFACs intensity
We derived the amplitude of IHFACs in each LT sectors to discuss the solar cycle dependence of IHFACs intensity (Fig. 4). The peak-to-peak amplitude is defined as shown in Fig. 4a. As shown in Fig. 4c, the peak-to-peak amplitude of yearly IHFACs was roughly 2 ~ 3 times larger in the dawn and noon sectors than the dusk sector. While the IHFACs intensity decreased with increasing year in the dawn and noon sectors, the dusk IHFACs intensity tended to increase year-to-year. The dusk IHFACs intensity was smaller during the maximum-declining-minimum phase of solar cycle. Conversely, we can see a larger intensity of dusk IHFACs during the ascending phase of solar cycle (2003–2004, 2016–2017).
Figure 4b shows the monthly average of IHFACs intensity. The data was classified into two groups in terms of solar cycle activity: the ascending-maximum phase (1998–2003, 2011–2015) and declining-minimum phase (2004–2010, 2016–2019). Absolute monthly average of IHFACs intensity in both dawn and noon sectors was stronger around September equinox, |∆D| ~30 nT, and the weaker around December solstice, |∆D| ~10 nT. A remarkable seasonal asymmetry is exhibited in dawn and noon IHFACs variations. On the other hand, the dusk-side IHFACs intensity was symmetry throughout the year, |∆D| ~5 nT. The declining-minimum phase absolute IHFACs intensity was decreased by 30% and 20%, increased 150% compared with that of the ascending-maximum phase for the dawn, noon and dusk sectors, respectively.
The yearly integral IHFACs intensity was calculated to examine the total IHFACs amount of dependence on the solar cycle activity (Fig. 4d). The yearly integral IHFACs intensity was derived by the summation of ∆D (hatched areas in Fig. 4a) for each year. We found that the dawn IHFACs dominantly flow southward throughout each year. By contrast, in noon sector the northward IHFACs mainly flow. The dusk-side IHFACs relatively flow southward.
The purpose of the present study was (1) to investigate whether the dusk-side IHFACs polarity is coincident or not with the IHFACs direction predicted by Fukushima's model and (2) to examining the solar cycle dependence of IHFACs.
IHFACs in the dusk sector
While the earlier studies based on in-situ and ground-based observations has been shown the consistency of dusk-side Fukushima’s model (Olsen, 1997; Yamashita and Iyemori, 2002), some recent in-situ and ground-based observational studies claimed the opposite direction of dusk-side IHFACs (Lühr et al., 2015; 2019; Fathy et al., 2019; Park et al., 2011; 2020a; 2020b; Shinbori et al., 2017). In this study, the long-term day-to-day ∆D variation analysis resulted in the following findings.
-
The dawn and noon IHFACs polarity was consistent with Fukushima’s model: the solstices IHFACs flow from the summer to winter hemisphere in the dawn sector and from winter to summer hemisphere around the noon sector (Fig. 1, 2).
-
The noon-dusk out-of-phase IHFACs polarity (which is inconsistent with Fukushima’s model) dominantly occurred during September-November months and slightly around March equinox. By contrast, the dusk-side June/December solstices IHFACs agreed with Fukushima’s model (Fig. 3, Table 1).
The previous studies and our results suggest that the solstices dusk-IHFACs flow the same direction of noon-IHFACs and the equinoxes dusk IHFACs disagree with Fukushima’s model. What is it that caused the dusk IHFACs to flow the opposite direction of noon-IHFACs? The period of disagree with Fukushima’s model corresponds to the transition phase when the direction of HFACs was flipped among both hemispheres. We obtained the evidence of seasonal dependence of IHFACs intensity. There was remarkable asymmetry in seasonal IHFACs variations in both dawn and noon sectors. On the other hand, the dusk-side IHFACs intensity was exhibited with seasonal symmetry (Fig. 4b). During September-November/February-April, while the noon IHFACs shifted northward flow, the dusk IHFACs keeps flowing southward. Figure 4b represents the additional information regarding as the month of intersection where IHFACs flows flip. For dawn and dusk sector, the intersection month was April and November. The noon sector intersection was March and November. It is clear that the noon and dusk IHFACs flip at the different intersection month. These results led us that these differences between noon and dusk of seasonal IHFACs polarity variability (symmetry/asymmetry) cause to the incoherent dusk IHFACs against Fukushima's model.
Solar cycle dependence of IHFACs
As mentioned above in the introduction, other previous studies involving the solar cycle discussion used the period less than solar cycle period (11 years). Also, they discussed the average value and neglected year-to-year IHFACs variations. In the present paper, we used 22-year long-term ∆D data and analyzed not only the day-to-day variations but also the year-to-year variation of IHFACs intensity. The following characteristics are first detected for day-to-day/year-to-year IHFACs in this paper:
-
Solar cycle dependence can be seen in the peak-to-peak amplitude, monthly average and yearly integral intensity of IHFACs (Fig. 4).
-
While the IHFACs intensity decreased with increasing year in the dawn and noon sectors, the dusk intensity tended to increase year-to-year (Fig. 4c).
-
While annual variations of IHFACs polarity was found in the dawn/noon sectors, there were multiple periodicities in the dusk sector: annual variation during the declining phase of solar cycle and semiannual or terannual variations during the increasing and maximum phase (Fig. 3d).
The dusk-side day-to-day IHFACs variations were more coherent with F10.7 variability compared with the dawn and noon sectors (Fig. 3d, e). It suggests that the dusk IHFACs is affected by the solar cycle activities. The magnetosphere is also influenced by the solar cycle activities, but no remarkable relationship exhibited between ∆D and Dst-index.
It is noteworthy that peak-to-peak amplitude of IHFACs depends on the trend of F10.7. Considering the sources of IHFACs, the interhemispheric imbalance of the ionospheric horizontal Sq current system, the effect of decreasing F10.7 values suggests the decreasing IHFACs intensity. The dawn and noon amplitude agreed with the above explanation, but dusk IHFACs few correlated with F10.7 variability.
According to Park et al. (2011), IHFACs densities are generally in the range between ± 15 mA/m, corresponding to zonal magnetic deflections between ± 20 nT. We found the monthly average IHFACs intensity is ± 30 nT, ± 10 nT and ± 5 nT around September equinox, December solstice in both dawn and noon sectors and irrespective season in the dusk sector, respectively. The amount of IHFACs were approximately consistent with the previous satellite observations. The amount of HFACs current flows more at dawn/noon and less on the dusk side (inconsistent with Park et al., 2020). The amount of HFACs current is large in the northern hemisphere in summer (consistent with Park et al., 2011).
We investigated whether the dusk-side IHFACs polarity is coincident or not with the IHFACs direction predicted by Fukushima's model and examined the solar cycle dependence of IHFACs, by using the day-to-day of equatorial ∆D variations at Davao station with 1-hour time resolution data from August 1998 to July 2020.
The dawn/noon IHFACs polarity agreed with Fukushima’s model irrespective of season: the solstices IHFACs flow from the summer to winter hemisphere in the dawn sector and from winter to summer hemisphere around the noon sector. The solstices dusk-IHFACs flow the same direction of noon-IHFACs and the equinoxes dusk-IHFACs disagree with Fukushima’s model. The noon sector intersection was March and November. It is clear that the noon and dusk IHFACs flip at the different intersection months.
The remarkable solar cycle dependence of IHFACs were exhibited in all LT sectors. Since the dusk-side day-to-day IHFACs variations with multiple periodicities were more coherent with F10.7 variability compared with the dawn and noon sectors, and it suggests that the dusk IHFACs is affected by the solar cycle activities.
CHAMP
Challenging Minisatellite Payload; ICSWSE:International Center for Space Weather Science and Education, FACs:field-aligned currents, IHFAC:Inter-hemispheric field-aligned current; LT:Local time; MAGDAS/CPMN:MAGnetic Data Acquisition System/Circum-pan Pacific Magnetometer Network Data, Sq:solar quiet, Solar Cycle:SC.
Ethics approval and consent to participate
Not applicable
Consent for publication
Not applicable
Availability of data and materials
The original data used in this study are publicly available as follows. The ground-based magnetometer data at Davao station of MAGDAS/CPMN are provided by ICSWSE, Kyushu University (http://data.icswse.kyushu-u.ac.jp). The F10.7 and Dst indices are provided by the OMNIWeb service of the Space Physics Data Facility at the Goddard Space Flight Center (http://omniw eb.gsfc.nasa.gov/).
Competing interests
The authors declare that they have no conflict of interest.
Funding
This work is financially supported by National Research Council (NRC) of Sri Lanka (16-098). The MAGDAS observation is financially supported by Japan Society for the Promotion of Science (JSPS) as Grant-in-Aid for Overseas Scientific Survey (15253005, 18253005). AF was supported by the JSPS KAKENHI Grant (17J40136, 19K03956). AY was supported by JSPS KAKENHI Grant (19K03956, 15H05815, JP20H01961).
Authors' contributions
MR and AF analyzed the data and wrote the manuscript. AF and AY and designed the current research and interpreted the data analysis results. CJ gave suggestions for improvement. All authors read and approved the final manuscript.
Acknowledgements
Special thanks to Daniel J. McNamara and Quirino M. Sugon Jr., Ateneo de Manila University, for their time and dedication to collecting of the magnetometer data at Davao observatory of MAGDAS network.
Authors' information
1Department of Physics, University of Colombo, 2Faculty of Computer Science and Systems Engineering, Kyushu Institute of Technology, 3Department of Earth and Planetary Sciences, Faculty of Science, Kyushu University
- Abidin ZZ, Jusoh MH, Abbas M, Bolaji OS, Yoshikawa A (2019) Features of the inter-hemispheric field-aligned current system over Malaysia ionosphere. Journal of Atmospheric and Solar-Terrestrial Physics 192.
- Bolaji OS, Rabiu AB, Oyeyemi EO, Yumoto K (2012) Climatology of the inter-hemispheric field-aligned currents system over the Nigeria ionosphere. Journal of Atmospheric and Solar-Terrestrial Physics 89:144-153. https://doi.org/10.1016/j.jastp.2012.07.008.
- Fambitakoye O, Mayaud PN (1976) Equatorial electrojet and regular daily variation SR—I. A determination of the equatorial electrojet parameters. . Journal of Atmospheric and Solar-Terrestrial Physics 38(1):1-17. https://doi.org/10.1016/0021-9169(76)90188-4.
- Fathy A, Ghamry E, Arora K (2019) Mid and low-latitudinal ionospheric field-aligned currents derived from the Swarm satellite constellation and their variations with local time, longitude, and season. Advances in Space Research 64:1600-1614.
- Fujimoto A, Uozumi T, Abe S, Matsushita H, Imajo S, Ishitsuka JK, Yoshikawa A (2016) Long-term EEJ variations by using the improved EE-index. Sun and Geosphere 11(1):37-47.
- Fukushima N (1994) Some topics and historical episodes in geomagnetism and aeronomy. Journal of Geophysical Research 99(A10):19,113-19,142.
- Fukushima N (1979) Electric Potential Difference between Conjugate Points in Middle Latitudes Caused by Asymmetric Dynamo in the Ionosphere. J Geomagn Geoelectr 31:401-409.
- King J, Papitashvili N (2005) Solar wind spatial scales in and comparisons of hourly Wind and ACE plasma and magnetic field data. Journal of Geophysical Research 110(A02104). doi:10.1029/2004JA010649.
- Lühr H, Kervalishvili G, Michaelis I, Rauberg J, Ritter P, Park J, Merayo JMG, Brauer P (2015) The interhemispheric and F region dynamo currents revisited with the Swarm constellation. Geophys Res Lett 42:3069-3075. doi:10.1002/2015GL063662.
- Lühr H, Kervalishvili GN, Stolle C, Rauberg J, Michaelis I (2019) Average characteristics of low‐latitude interhemispheric and F region dynamo currents deduced from the swarm satellite constellation. Journal of Geophysical Research: Space Physics 124:10,631-10,644.
- Maeda H (1974) Field-aligned current induced by asymmetric dynamo action in the ionosphere. Journal of Atmospheric and Terrestrial Physics 36:1395-1401.
- NASA (2020) Solar Cycle 25 Is Here. NASA, NOAA Scientists Explain What That Means. https://www.nasa.gov/press-release/solar-cycle-25-is-here-nasa-noaa-scientists-explain-what-that-means/. Accessed 20 Dec 2020
- Olsen N (1997) Ionospheric F region currents at middle and low latitudes estimated from Magsat data. Journal of Geophysical Research 102:4563-4576.
- Owolabi OP, Bolaji OS, Adeniyi JO, Oyeyemi EO, Rabiu AB, Habarulema JB (2018) Excursions of interhemispheric field-aligned currents in Africa. Journal of Geophysical Research: Space Physics 123:6042-6053.
- Park J, Lühr H, Min K (2011) Climatology of the inter-hemispheric field-aligned current system in the equatorial ionosphere as observed by CHAMP. Annales Geophysicae 29:573-582. doi:10.5194/angeo-29-573-2011.
- Park J, Yamazaki Y, Lühr H (2020a) Latitude Dependence of Interhemispheric Field-Aligned Currents (IHFACs) as Observed by the Swarm Constellation. Journal of Geophysical Research: Space Physics 125. doi:10.1029/2019JA027694.
- Park, J, Stolle, C, Yamazaki, Y, Rauberg, J., Michaelis, I, Olsen, N (2020b) Diagnosing low-/mid-latitude ionospheric currents using platform magnetometers: CryoSat-2 and GRACE-FO.Earth Planets Space 72, 162. https://doi.org/10.1186/s40623-020-01274-3
- Shinbori A, Koyama Y, Nosé M, Hori T, Otsuka Y (2017) Characteristics of seasonal variation and solar activity dependence of the geomagnetic solar quiet daily variation. Journal of Geophysical Research: Space Physics 122:10,796-10,810.
- Schieldge JP, Venkateswaran SV, Richmond AD (1973) The ionospheric dynamo and equatorial magnetic variations. Journal of Atmospheric and Terrestrial Physics 35(6):1045–1061. https://doi.org/10.1016/0021-9169(73)90004-4
- SPDF - OMNIWeb Service (2020) SPDF - OMNIWeb Service - NASA. https://omniweb.gsfc.nasa.gov/form/dx1.html. Accessed 10 Aug 2020
- Stening RJ (1977) Field-aligned currents driven by the ionospheric dynamo. Journal of Atmospheric and Terrestrial Physics 39:933–937.
- Takeda M (1982) Three dimensional ionospheric currents and field aligned currents generated by asymmetrical dynamo action in the ionosphere. Journal of Atmospheric and Terrestrial Physics 44(2):187–193. https://doi.org/10.1016/0021-9169(82)90122-2
- Tomás AT, Lühr H, Rother M (2009) Mid-latitude solar eclipses and their influence on ionospheric current systems. Annales Geophysicae 27(12):4449–4461. https://doi.org/10.5194/angeo-27-4449-2009.
- Takeda M (1990) Geomagnetic field variation and the equivalent current system generated by an ionospheric dynamo at the solstice. Journal of Atmospheric and Terrestrial Physics 52(1):59-67.
- Van Sabben D (1964) North-South asymmetry of Sq. Journal of Atmospheric and Terrestrial Physics 26:1187-1195. https://doi.org/10.1016/0021-9169(64)90127-8.
- Van Sabben D (1966) Magnetospheric currents, associated with the N–S asymmetry of Sq. Journal of Atmospheric and Terrestrial Physics 28:965-982. https://doi.org/10.1016/S0021-9169(17)30026-0.
- Van Sabben D (1969) The computation of magnetospheric currents, caused by dynamo action in the ionosphere. Journal of Atmospheric and Terrestrial Physics 31:469-474. https://doi.org/10.1016/0021-9169(69)90072-5.
- Van Sabben D (1970) Solstical Sq-currents through the magnetosphere. Journal of Atmospheric and Terrestrial Physics 32:1331-1336. https://doi.org/10.1016/0021-9169(70)90064-4.
- Yamashita S, Iyemori T (2002) Seasonal and local time dependences of the interhemispheric field-aligned currents deduced from the Ørsted satellite and the ground geomagnetic observations. Journal of Geophysical Research 107(A11): SIA 11-1-SIA 11-10. doi:10.1029/2002JA009414.
- Yamazaki Y, Maute A (2016) Sq and EEJ—A review on the daily variation of the geomagnetic field caused by ionospheric dynamo currents. Space Science Reviews 206(1-4):299–405. https://doi.org/10.1007/s11214-016-0282-z
- Yumoto K, 210MM Magnetic Observation Group (1996) The STEP 210 magnetic meridian network project. J Geomag Geoelectr 48(11):1297-1310.
- Yumoto K, CPMN Group (2001) Characteristics of Pi 2 magnetic pulsations observed at the CPMN stations: A review of the STEP results. Earth Planets Space 53:981-992. https://doi.org/10.1186/BF03351695.
- Yumoto K, MAGDAS Group (2006) MAGDAS project and its application for space weather, Solar Influence on the Heliosphere and Earth's Environment: Recent Progress and Prospects, Edited by N. Gopalswamy and A. Bhattacharyya, ISBN-81-87099-40-2:309-405.
- Yumoto K, MAGDAS Group (2007) Space weather activities at SERC for IHY: MAGDAS. Bull Astr Soc India 35(4):511-522.
Table 1 The coincident/incoincident relationship between dusk-side HFACs observations and Fukushima's model.
|
Periods |
Coincident months |
Incoincident months |
|
1999-2000 |
December solstice |
March-November |
|
2000-2017 |
June/December solstices |
March/September equinoxes |
|
2018-2019 |
June solstice |
October-April |