Patient specimens
In the retrospective study, we collected a total of 589 liver cancer patients admitted to hospital for SBRT between January 2012 and December 2018. After excluding 55 patients who were lost for follow-up, a total of 534 patients were involved in the following research. In the prospective study, 51 samples were collected, the outcome after SBRT were followed up and recorded, the relationship between markers and prognosis, the ROC and assessment of prognostic value were analyzed.
Prognostic analysis of commonly-used serum tumor biomarkers
Cancer biomarkers, such as AFP, CEA, CA199, CA153, CA125, are commonly used for diagnosis. By detecting the levels of these biomarkers, clinician can make a preliminary assessment of the occurrence and progress of tumors. Jung J et al.[13] reported that liver cancer patients had a better prognosis when AFP levels returned to normal levels 3 months after SBRT, Uemotok et al.[14] found that the risk of recurrence was associated with the elevated AFP level. Whether those biomarkers are with prognostic value is our concern. In this study, we selected patients together with serum biomarker examination before SBRT, 3 months after SBRT, and 6 months after SBRT. The results are shown in Table 1. We found that AFP, CA125 and CA199 were differential expressed before and after SBRT.
Then, we wanted to figure out the relationship between these markers and the overall survival (OS) for 1-year, 2-year, and 3-year (Table 2). From Table 2, significant differences were found between the survival group and the death group, i.e., change ratio of AFP in 6 months after SBRT, and CA125 in 3 months and 6 months after SBRT in 1-year, 2-year and 3-year OS. And no difference was found between the survival group and the death group in the change of CA199.
The diagnostic ability of these markers were then evaluated. The ROC curve was made and the sensitivity, specificity, AUC (Area Under the ROC Curve), Youden index and cut-off values were shown in Table 3. The Yoden index of AFP, CA125 and CA199 as prognostic markers for judging the efficacy of SBRT was less than 0.5. In addition, the AUC values of the change ratio of tumor biomarkers distinguishing survival group and death group were almost less than 0.70, except for CA125 in 6 months which were 0.781 and 0.715 in 1-year group and 2-year group, respectively, indicating that these commonly-used biomarkers do not provide a good assessment of the therapeutic efficacy of SBRT. Therefore, it is necessary to find more effective biomarkers for accurate assessment of the efficacy of SBRT in patients with liver cancer.
High-throughput sequencing for gene profiles
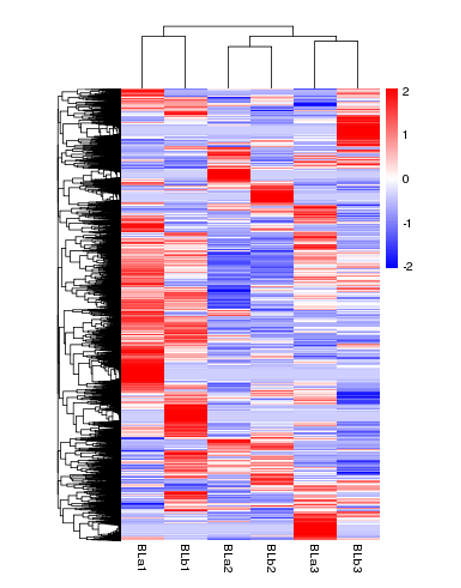
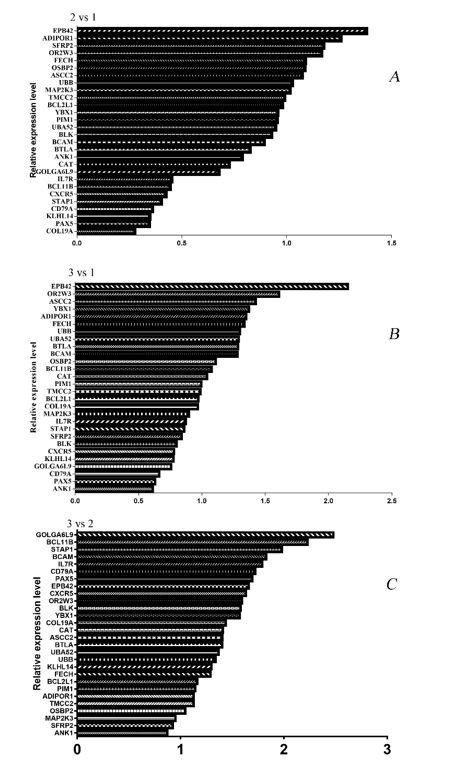
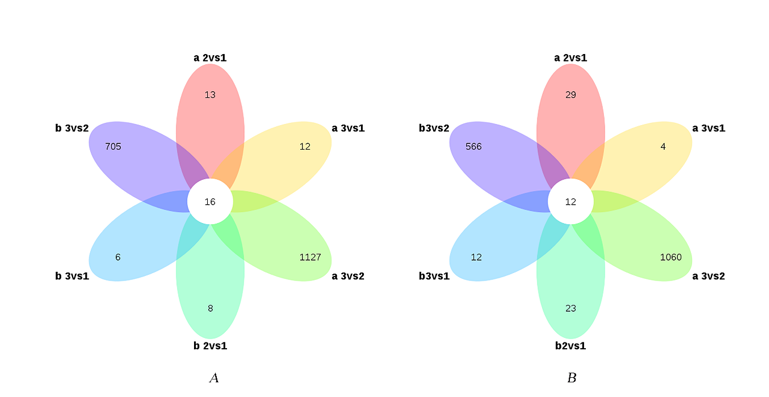
By the high-throughput sequencing, we obtained gene expression profiles before and after SBRT. Then, we compared the changes in gene expression before discharge (group 2) with pre-treatment (group 1), 2 months after SBRT treatment (group 3) with pre-treatment (group 1), and also group 3 vs group 2. Genes with P<0.05 were used as the differential gene, and the FPKM values of all differential genes in each comparison group were summarized. log2FC >0 (FC: fold change) was considered to be up-regulated, and log2FC <0 was considered to be down-regulated, the visualization of the heatmap of the liver cancer samples are shown in Supplementary Fig. 1. In addition, due to the excessive number of differentially expressed genes, we limited the criteria for differential genes. By using q<0.05 (q value is adjusted p value) and | log2FC | > 1 as screening criteria, differentially expressed genes were found out. Then, we listed all the differentially expressed genes of group 2 vs 1, group 3 vs 1 and group 3 vs 2, it was found that a total of 16 differentially expressed genes remained elevated in all liver cancer patients after SBRT (i.e., up-regulated in group 2 vs 1 and in group 3 vs 1, but no difference in group 3 vs 2) (shown in Supplementary Fig.2A). In addition, a total of 12 differentially expressed genes remained downregulation in all liver cancers after SBRT (i.e. down-regulated in group 2 vs 1 and in group 3 vs 1, but no difference in group 3 vs 2) (shown in Supplementary Fig.2B).
Evaluation of the differential genes for SBRT efficacy in liver cancer
The expression of the above 28 genes were further verified by qPCR, which are shown in Supplementary Fig.3 A-C. Nonparametric test was used to determine whether there were differences in gene expression before and after SBRT. We found that 21 genes were differently expressed, the detailed results are shown in Table 4.
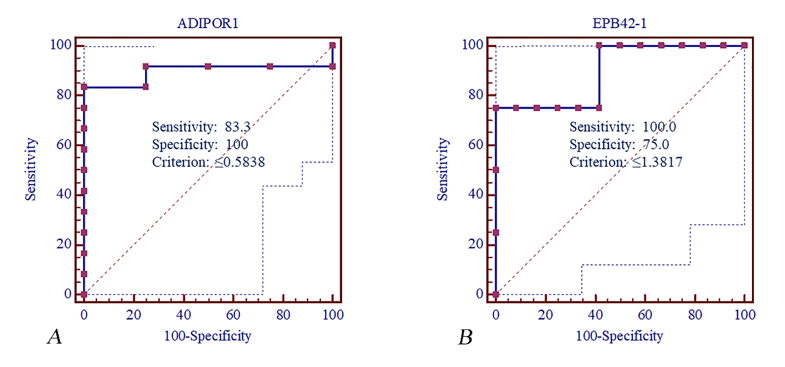
Furtherly, we calculated the changes of 21 genes and evaluated whether the change in group 2 vs 1, group 3 vs 1 were different between the effective and ineffective groups after SBRT. According to the imaging data of liver cancer patients, the therapeutic effects were divided into CR, PR, SD and PD based on the change of the diameter of liver cancer, CR and PR were classified into effective group, and SD and PD were classified into ineffective group. The results are shown in Table 5, it can be seen that ADIPOR1 and EPB42 were differentially expressed in pre-discharge versus before SBRT (P<0.05), indicating that ADIPOR1 and EPB42 had significant changes in the short term after SBRT treatment. Therefore, in the following study, we mainly focused on the two genes ADIPOR1 and EPB42.
Since there was no significant difference in group 3 vs 1, we only evaluated the prognostic value of the change ratio of group 2 vs 1 in the efficacy of 3-month after SBRT for liver cancer. The evaluation results of the prognostic value for ADIPOR1 and EPB42 were listed in Table 6 and the ROC curves were shown in Supplementary Fig.4A-B. The results showed that ADIPOR1 had a sensitivity of 100% and a specificity of 83.33%, at the optimal threshold of 0.5838. And EPB42 had a sensitivity of 75% and a specificity of 100%, at the optimal threshold of 1.3817. Combined Table 5 with Table 6, it can be seen that when the change ratio of ADIPOR1 was lower than 0.5838 in pre-discharge compared with that before SBRT, patients had a better prognosis. Similarly, when the change of EPB42 was lower than 1.3817 in pre-discharge compared with that before SBRT, patients had a better prognosis after SBRT.