Morphological characteristics and genetic analysis of the mutant ebm3
Following EMS treatment, 528 M0 lines were obtained. By continuous identification and further screening for generations, the mutant ebm3 exhibiting obvious early-bolting characteristics in spring and autumn cultivation was selected as the study material. Except for curled leaves, the mutant emb3 showed no other pleiotropic effects when compared with the wild-type line ‘FT’ (Fig. 1a).
Under normal cultivation conditions in autumn, the wild-type line ‘FT’ will not premature bolting without exposure to a prolonged cold period (vernalization); however, but the mutant emb3 exhibited obvious bolting under these conditions. To more intuitively assess the characteristics of the mutant, three indices, squaring period (SP), flowering time (FT), and days to reaching a 10 cm-high elongated floral stalk (DE), were measured in 30 individuals and the average values are presented. SP, FD, and DE of the mutant ebm3 were 40, 43, and 46 days, respectively.
The reciprocal cross F1 generation had the same phenotype as the wild-type line ‘FT’, indicating that the early-bolting phenotype of the mutant ebm3 was recessive and controlled by nuclear gene. In the F2 generation, 1,225 and 401 individuals exhibited the wild-type line ‘FT’ and mutant ebm3 phenotype, respectively. This segregation ratio was consistent with the Mendelian ratio of 3:1 segregation (χ2 = 0.08 < χ20.05 = 3.84). In addition, all 518 BC1 (F1 × ‘FT’) generation individuals exhibited the phenotype of the wild-type line ‘FT’. For the BC1 (F1 × ebm3) generation, 264 and 272 individuals exhibited the wild-type line ‘FT’ and mutant ebm3 phenotype, respectively. This 1:1 segregation ratio was consistent with the expectations (χ2 = 0.09 < χ20.05 = 3.84). These data indicated that the phenotype of the mutant ebm3 was controlled by a single, recessive nuclear gene (Table 1).
Table 1
Genetic analysis of the early-bolting mutant ebm3 of Chinese cabbage
|
Generation
|
‘FT’
|
ebm3
|
Total
|
Segregation Ratio
|
Expected Ratio
|
χ2
|
|
P1 (‘FT’)
|
92
|
0
|
92
|
|
|
|
|
P2 (ebm3)
|
0
|
81
|
81
|
|
|
|
|
F1 (P1 × P2)
|
192
|
0
|
192
|
|
|
|
|
F1 (P2 × P1)
|
184
|
0
|
184
|
|
|
|
|
BC1 (F1בFT’)
|
518
|
0
|
518
|
|
|
|
|
BC1 (F1 × ebm3)
|
264
|
272
|
536
|
0.97: 1
|
1:1
|
0.08
|
|
F2
|
1225
|
401
|
1626
|
3.05: 1
|
3:1
|
0.09
|
Identification of the causal gene of the mutant ebm3
Sequencing produced 48.75 Gb of raw data. After filtering, 18.98 Gb, 9.19 Gb, and 20.55 Gb clean data were obtained for the ‘FT’, ebm3, and F2_ebm3 library, respectively. Sufficient data were produced for each library, the sequencing data were of sufficient quality (Q20 ≥ 93.69%, Q30 ≥ 88.04%), and the GC distribution (37.55–42.77%) was normal (Additional file 2: Table S1). The clean reads were aligned to the B. rapa reference genome (v3.0). The mapping rate was 97.95%, 97.37%, and 97.31% for the ‘FT’, ebm3, and F2_ebm3 library, respectively, corresponding to an average read coverage of 48.00, 22.46, and 21.17 X (Additional file 2: Table S2). The mapped reads were normal and could be used for subsequent SNP detection. In total, 414,354 SNPs were detected in the ‘FT’ and ebm3 library, of which 457 homozygous nonsynonymous loci were gained to calculate SNP index in F2_ebm3 library. And then these loci that the SNP index < 0.3 were filtered out. To evaluate the distribution of the SNP index physically mapped across the B. rapa chromosomes, we used an sliding window method with a 1-Mb window size and 10-kb step size in F2_ebm3 library. Here, we only showed the distribution of the SNP index in offspring pool on Chromosome A04, because it was the chromosome where the candidate loci were located (Fig. 1b). To further confirm the candidate loci, these above SNPs were screened as follows: retain loci with SNP index = 1; filter out not-typical EMS mutant loci; retain loci large-effect. Finally, six SNPs (3,407,432, 6,258,734, 13,129,878, 18,591,168, 21,580,928 and 20,708,402) were identified on chromosome A04, including five nonsynonymous sites in exons and one alternative splice site in an intron (Table 2).
Table 2
List of the candidate SNPs identified by MutMap analysis
|
ID
|
Pos
|
Ref
|
Alt
|
SNP
index
|
Variant
|
Description
|
|
BraA04g005220.3C
|
3,407,432
|
G
|
A
|
1
|
nonsynonymous
|
CDT1-like protein b isoform X3
|
|
BraA04g008870.3C
|
6,258,734
|
G
|
T
|
1
|
nonsynonymous
|
LOW QUALITY PROTEIN: short-chain type dehydrogenase/reductase
|
|
BraA04g017190.3C
|
13,129,878
|
C
|
T
|
1
|
nonsynonymous
|
histone-lysine N-methyltransferase CLF isoform X1
|
|
BraA04g026040.3C
|
18,591,168
|
C
|
T
|
1
|
nonsynonymous
|
LEA protein group 3
|
|
BraA04g031990.3C
|
21,580,928
|
C
|
T
|
1
|
nonsynonymous
|
39S ribosomal protein L46, mitochondrial-like
|
|
BraA04g030150.3C
|
20,708,402
|
G
|
A
|
1
|
splicing
|
signal recognition particle 14 kDa protein-like
|
To verify the reliability of these six candidate SNPs, the sequences surrounding them were amplified from DNA from the mutant ebm3 and wild-type line ‘FT’. Sequence alignment results showed that all SNPs were real (data not shown), and the sequencing peak of the C/T allele of SNP 13,129,878 was displayed in Fig. 1c.
We conducted genotyping analysis of 200 F2 individuals to confirm the causal SNP for the early-bolting mutant phenotype. A KASP assay showed that SNP 13,129,878 of BraA04g017190.3C co-segregated with the mutant phenotype in the F2 individuals. All F2 individuals exhibited a T:T genotype, whereas the wild-type line ‘FT’ was C:C genotype (Fig. 1d). For the other five SNPs, recombinants (C:T genotype) were detected in the F2 individuals, indicating these SNPs did not co-segregate with the mutant phenotype (data not shown). These results confirmed that BraA04g017190.3C, harboring SNP 13,129,878, was the causal gene of the mutant ebm3. Gene annotation confirmed that BraA04g017190.3C encoded an important histone methyltransferase, CLF. Loss-of-function of A. thaliana homologous CLF (At2g23380) causes an early flowering phenotype and upwardly curled leaves [30]. In this study, the causal gene of the mutant ebm3 is referred to as Bremb3.
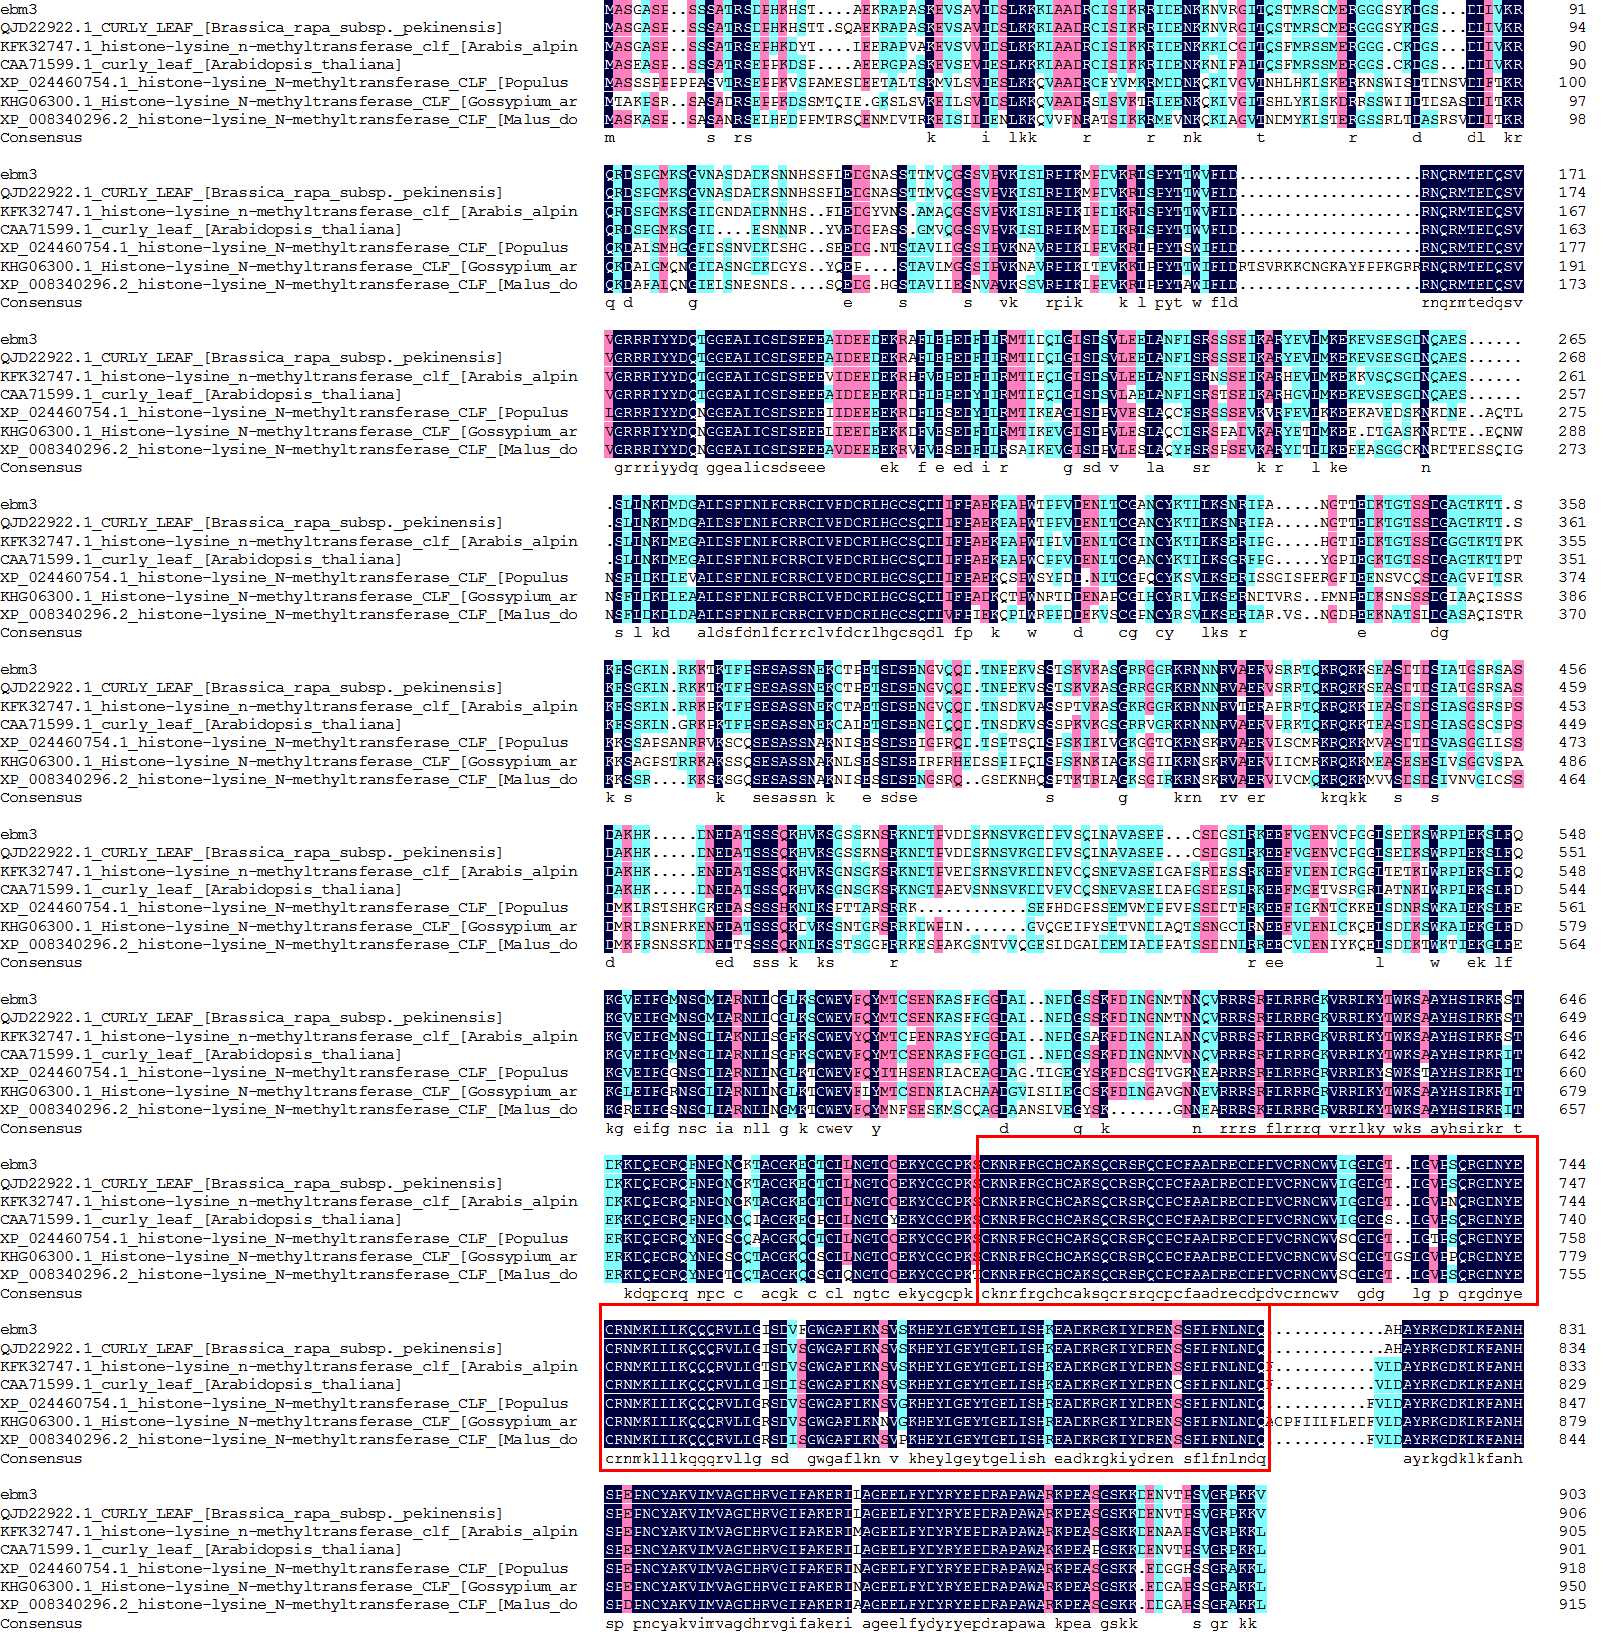
The full-length gene sequence of Bremb3 was found to be 4,406 bp, and Bremb3 consists of 17 exons and 16 introns (Fig. 2a). Sequence alignment of the mutant ebm3 and wild-type line ‘FT’ showed that besides SNP 13,129,878 in the 14th exon, there was no variation. The coding sequence of Bremb3, 2,715 bp in length, encodes a protein of 904 amino acids with a molecular weight of 1000 kDa and a theoretical pI of 90.5. The SNP 13,129,878 (C→T) of Brebm3 causes an amino acid substitution from serine (S) to phenylalanine (F) at residue 766 (Fig. 2b). The amino acid substitution is localized in a typical SET domain that is highly conserved among diverse species (Fig. 2c; The original figure refers to Additional file 1: Figure S1).
Spatiotemporal expression of Brebm3
To study the relative expression levels of Brebm3 in different tissues, RNA from root, stem, leaf, bud, flower, and pod of the wild-type line ‘FT’ was used as a template for qRT-PCR. The data showed that Brebm3 expression was the highest in the flower, followed by the bud, leaf, and pod, with extremely low expression in the stem (Fig. 3a).
Brebm3 promoter activity
We analyzed Brebm3 promoter activity in A. thaliana tissues by using the fusion vector Brebm3 pro:GUS. Following screening based on hygromycin resistance and the GUS reporter gene, 32 transgenic plants were obtained (Fig. 3b, c; The original figure of Fig. 3c refers to Additional file 1: Figure S2). Tissues (root, stem, leaf, inflorescence, and pod) of homozygous T2 generation transgenic plants were stained in a GUS histochemical assay. Analysis of the transformed plants showed that Brebm3 transcriptional activity was the highest in the inflorescence, followed by leaf and pod (Fig. 3d). These results were in line with those of spatiotemporal expression analysis, indicating that ebm3 expression shows a tissue-specific pattern.
Brem3 is located to the nucleus
To detect the subcellular localization of Brebm3, we constructed recombinant 35S:GFP-Brebm3 plasmid for transiently expression. Co-localization analysis of GFP and mKate fluorescent signals in the transformed Arabidopsis mesophyll cell protoplasts indicated that 35S:GFP-Brebm3 vector was exclusively located in the nucleus, suggesting that Brem3 is a nucleoprotein.Whereas the 35S:GFP control vector was detected within both the nucleus and cytoplasm (Fig. 4).
Transcriptome profiling of the mutant ebm3
We further conducted RNA-Seq to analyze the molecular mechanism of Brebm3 in regulating early bolting in Chinese cabbage. After filtering and quality control, 22.32 Gb and 20.94 Gb of clean reads were obtained for the ‘FT’ and ebm3 library, respectively. Sufficient data were produced for each library, the sequencing quality (Q20 ≥ 99.91%, Q30 ≥ 98.41%) was sufficient, and the GC distribution (46.50–47%) was normal (Additional file 2: Table S3). On average, 69.01% and 68.93% of clean reads from ‘FT’ and ebm3 libraries, respectively, were uniquely mapped to the B. rapa reference genome (v3.0) (Additional file 2: Table S4). In total, 1,906 DEGs, including 1,079 up- and 827 downregulated genes, were identified in the mutant ebm3. To determine their biological functions, we used GO term and KEGG pathway enrichment analysis. 1,612 DEGs were mapped to 272 significantly enriched GO terms (p vaule ≤ 0.03) (Additional file 1: Figure S3). The most significantly enriched GO terms were “transcription, DNA-templated” in biological process, “plasma membrane” in cellular component, and “transcription factor activity, sequence-specific DNA binding” in molecular function. 944 DEGs were assigned to 19 significantly enriched KEGG pathways (p vaule ≤ 0.03), including starch and sucrose metabolism, phenylalanine metabolism, and circadian rhythm-plant (Additional file 1: Figure S4).
Flowering is an essential stage in the life cycle of higher plants and is tightly controlled by complex molecular pathways. To further explore the molecular mechanism underlying the early-bolting phenotype of the mutant ebm3, we conducted an in-depth analysis of the transcriptome data. The causal gene Brebm3 (BraA04g017190.3C) was not significantly differentially expressed between the mutant ebm3 and wild-type line‘FT’ (Additional file 2: Table S5; Fig. 5a). The floral integrator genes FT, TSF, TFL1, and SOC1, the vernalization pathway-related genes FLC and FRI, the ambient temperature-related gene SVP, the photoperiod pathway-related gene GI, age pathway-involved genes SPL3, SPL9 and SPL15, gibberellin pathway-involved genes GA20OX1-4, floral homeotic genes AG, AGL19, SEP1/AGL2, SEP2/AGL4 and FUL/AGL8 were detected in our data. The SOC1 genes (BraA04g031640.3C, BraA05g005370.3C, and BraA03g023790.3C), two AG genes (BraA03g048590.3C and BraA01g010430.3C), AGL19 (BraA01g013570.3C), SEP1/AGL2 (BraA10g023780.3C), SEP2/AGL4 (BraA01g044460.3C) were significantly upregulated in the mutant ebm3 as compared to wild-type line ‘FT’ (Additional file 2: Table S5). We assessed Brebm3, SOC1, and FLC gene expression by RT-qPCR to verify the reliability of the RNA-seq data. As shown in Fig. 5, the expression patterns of the eight genes were generally consistent with the transcriptome profile.