Study selection
From the electronic databases (PubMed, Embase, Cochrane and Web of Knowledge), a total of 2208 studies were included (Supplementary Figure 1), and 1961 citations were excluded based on their titles or abstracts. After screening the text of 247 articles, 130 studies were excluded from the systematic review. The reasons for exclusion were that the studies did not include: a large enough COPD sample or there was not association between quantitative CT and PFTs. According to the exclusion criteria of the meta-analysis, 81 studies were excluded. The reasons for exclusion were as follows: (1)selection bias, (2) small sample size, (3) MDCT volume scans were not available, (4) quantitative CT parameters were not included, and (5) PFT parameters were not included. Finally, 117 articles were used for systematic review and 36 articles were included in the meta-analysis.
Systematic review
The systematic review included a total of 19,942 participants. The age of patients range from 40-80, and there were 12,252 (61.4%) men, 5676 (28.5%) women, 2014 (10%) of the participants did not specify their gender (Supplementary Table 2). This study included RCTs and cohort studies. Of these, articles 51.6% (61 articles) were from Europe, 29.9% (35 articles) were from Asia, 14.5% (17 articles) were from North America, 3.4% (4 articles) from Oceania. Further, 106 (90.6 %) were written in English, 5 (4.2 %) in Italian, 4 (3.4 %) in Chinese, 1 (0.9 %) in French, and 1 (0.9 %) in Polish.
The sample sizes of the recent publications were significantly larger than before, and the CT equipment was more advanced (Supplementary Figure 2). Articles included a variety of breath-holding procedures, such as only inspiratory, expiratory, or both inspiratory and expiratory.
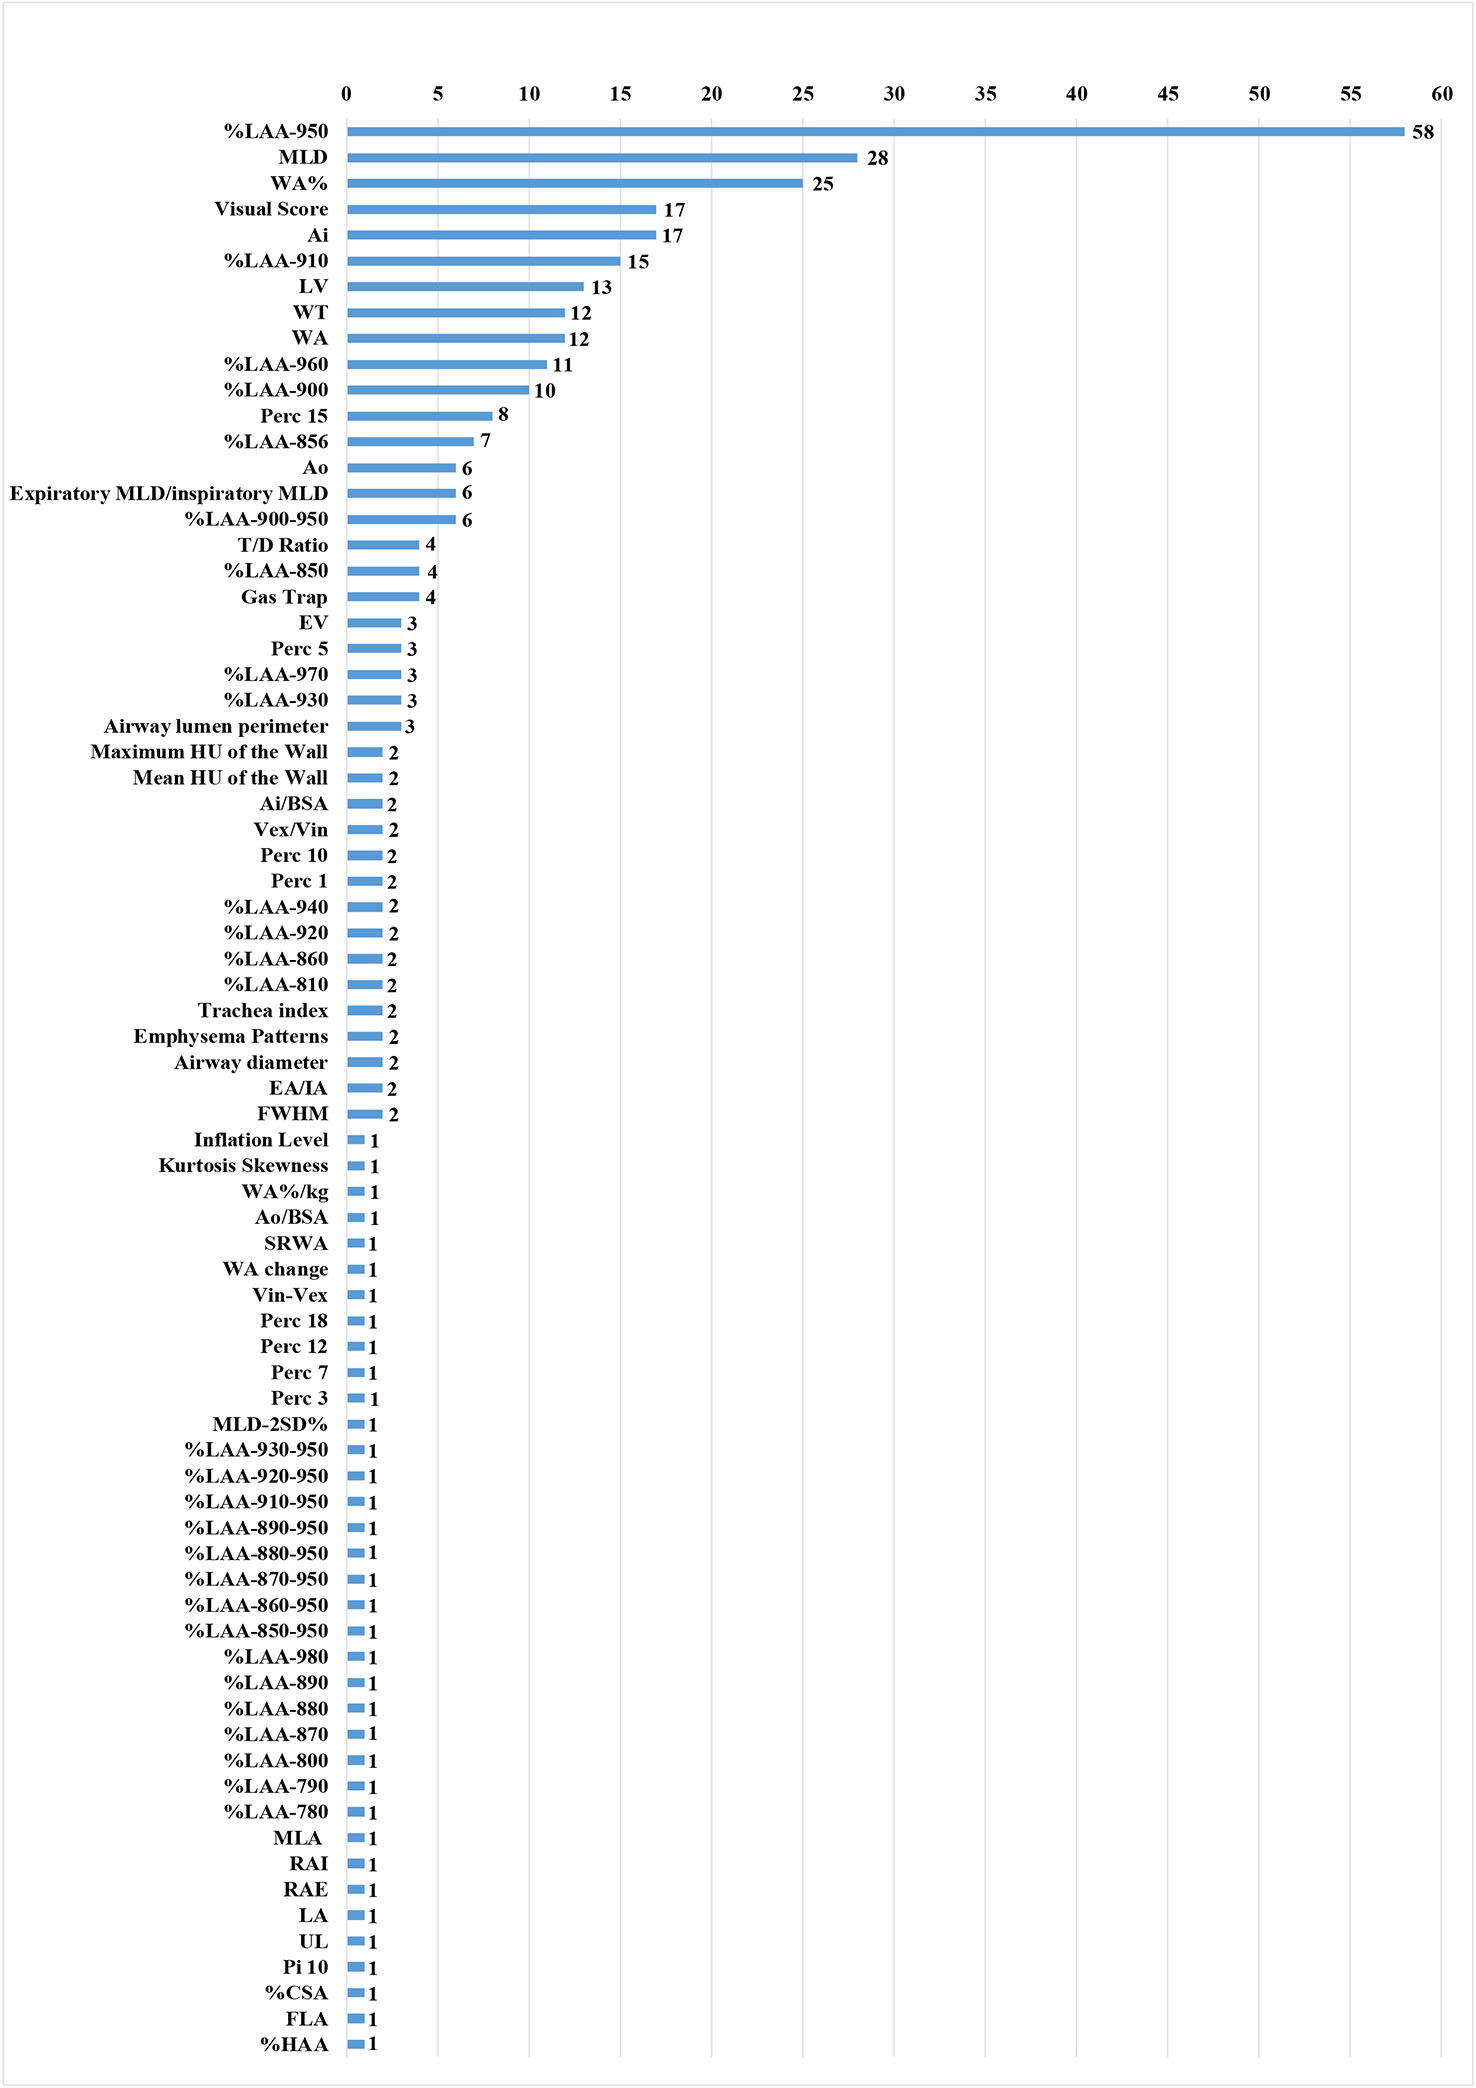
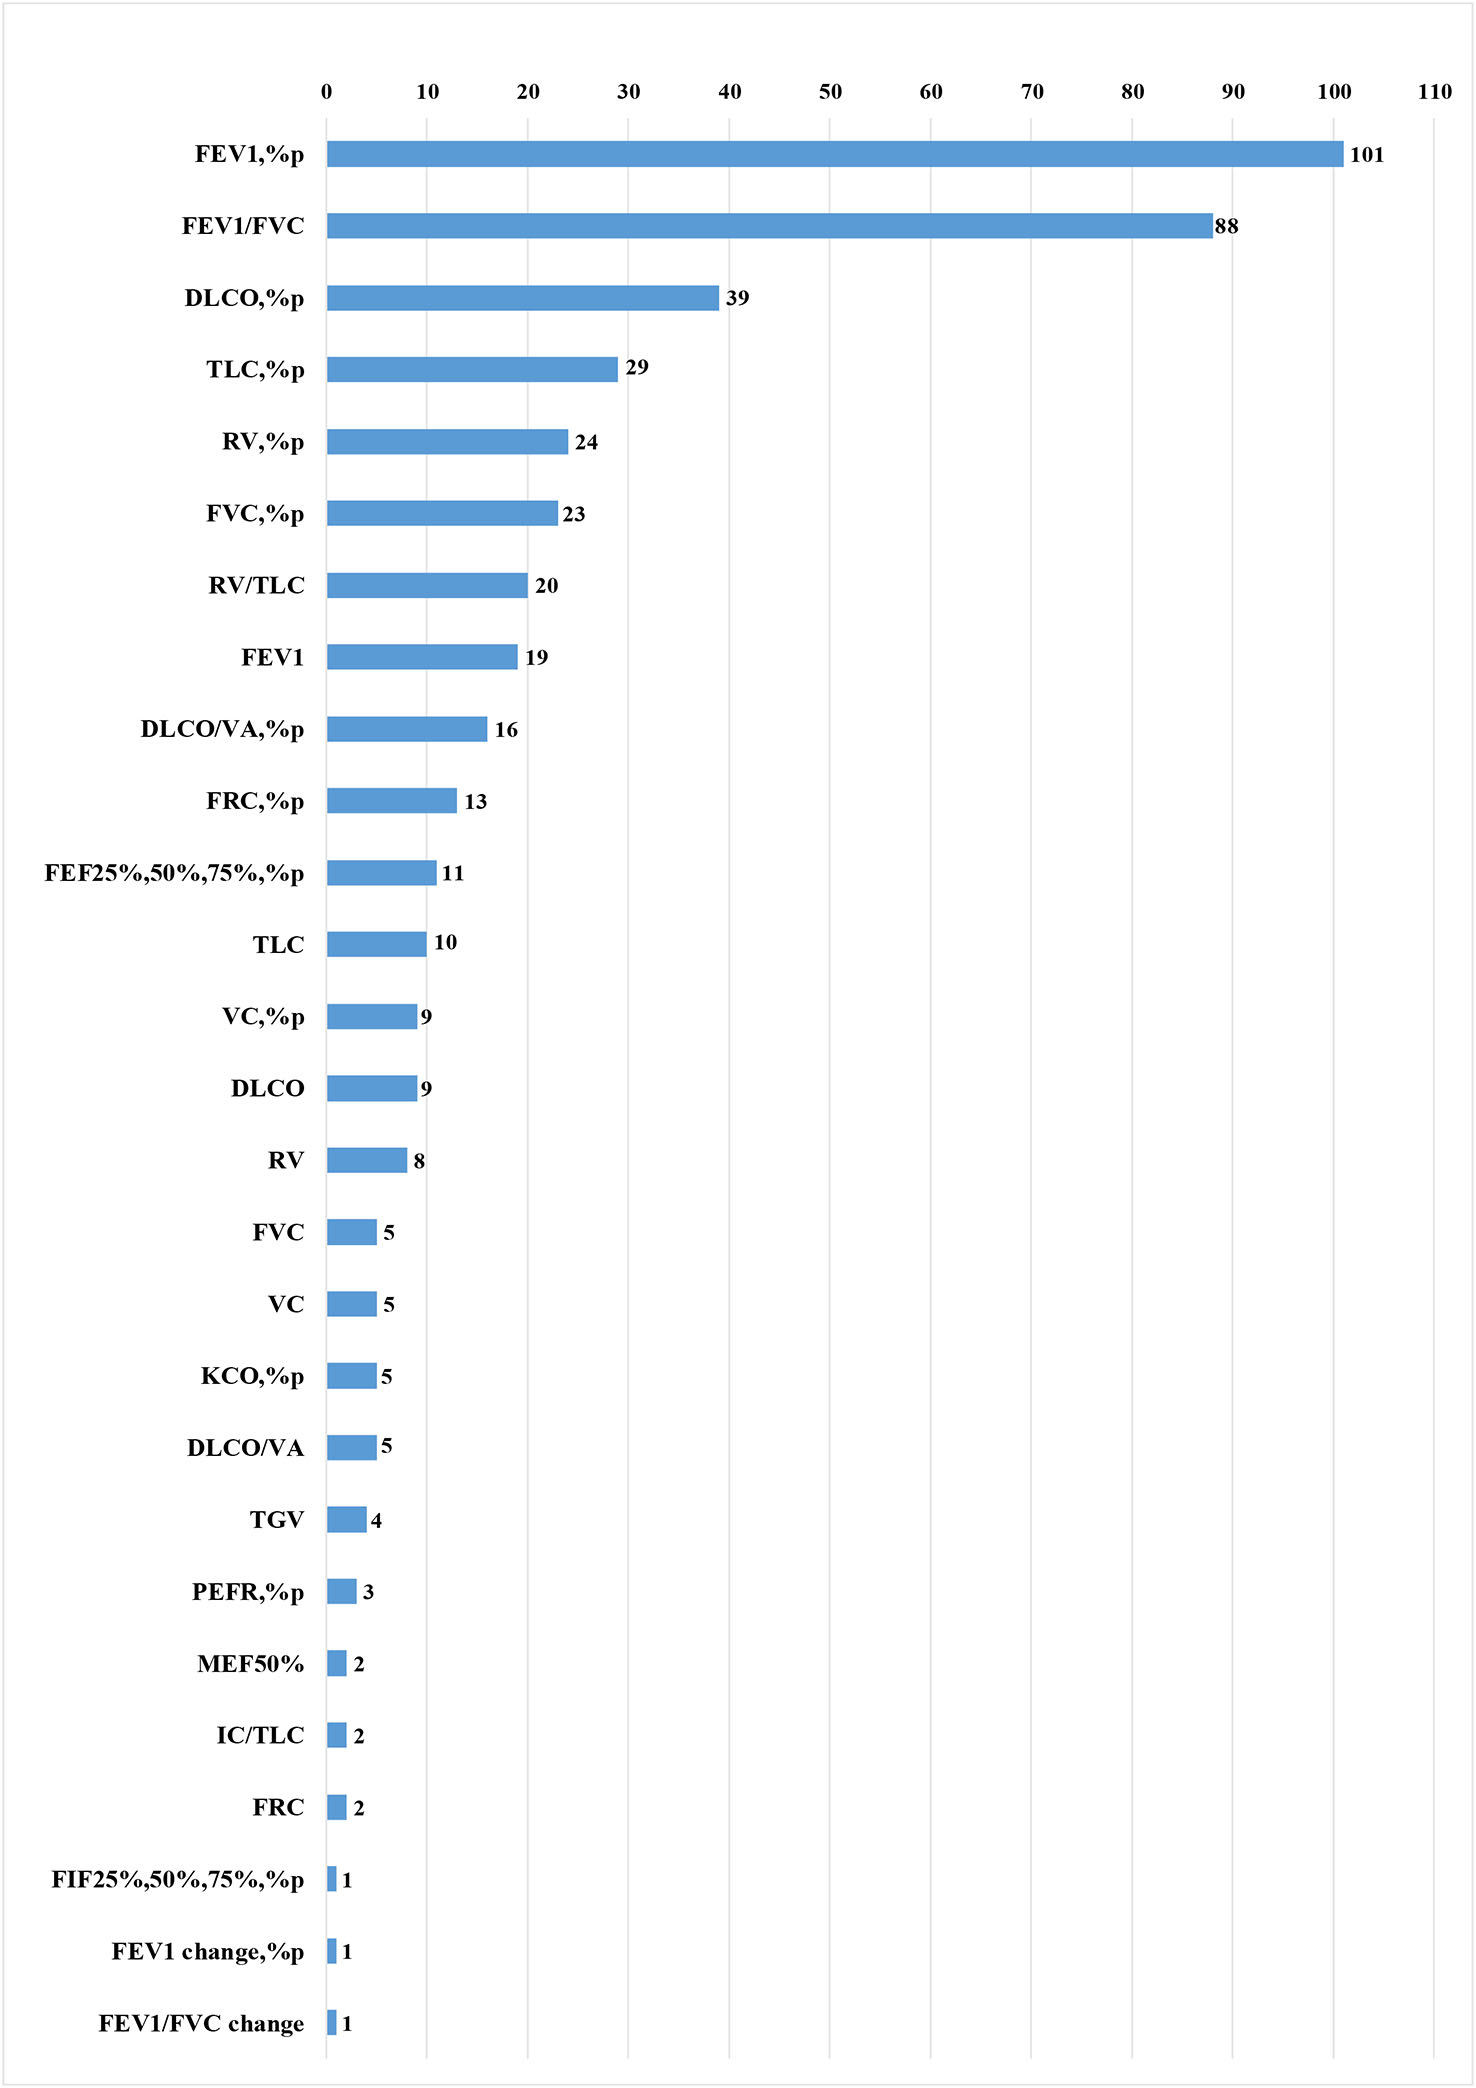
The selected articles included 75 quantitative CT parameters and 27 pulmonary function parameters (Supplementary Figure 4 and Figure 5), and the final parameters for the systemic review included %LAA-950, MLD, WA%, ATI, WT, AI, FEV1%pred, and FEV1/FVC. The common threshold defining the lung parenchyma in emphysema was -900 to -960HU, and the most commonly used threshold was -950 HU[19]. In some study, different thresholds in the same sample had different correlations with airflow obstruction parameters in PFTs[13,15,30,35]. The broad range of published CCs between CT and PFTs parameters were as follow: %LAA-950 and FEV1%pred, -0.66 to -0.09[13,14]; %LAA-950 and FEV1/FVC, -0.75 to -0.09[13,65]; %LAA<950 and FEV1%pred, -0.63 to -0.28[14,55]; %LAA<950 and FEV1/FVC, -0.66 to -0.54[14,30]; WA% and FEV1%pred, -0.713 to -0.044[25,66]; MLD and FEV1%pred, 0.18 to 0.85 [13,64]; MLD and FEV1/FVC, 0.21 to 0.89[13,14]; ATI and FEV1%pred, -0.725 to -0.29[36,43]; WT and FEV1%pred, -0.68 to -0.13[28,30]; WT and FEV1/FVC, -0.62 to -0.05[28,30]; AI and FEV1%pred, 0.73 to 0.14[23,28]; AI and FEV1/FVC, 0.32 to 0.07[28,41]; %LAA-950 and FEV1%pred by GE, -0.67 to -0.43[21,56]; %LAA-950 and FEV1%pred by non-GE (such as Siemens, Toshiba, and Philips), -0.67 to -0.43 [34,42](Supplementary Table 3).
Risk of bias in the meta-analysis
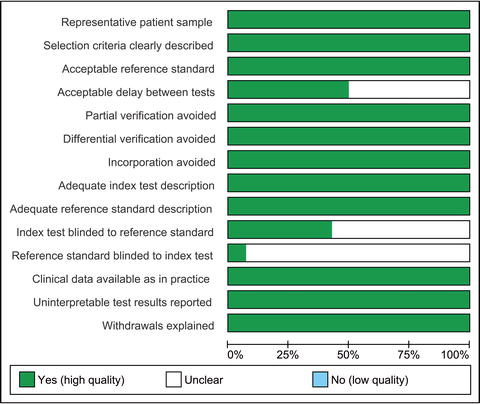
All articles included in the meta-analysis were high quality; QUADAS scores ranged from 12.5 to 13.5(Supplementary Table 4 and Supplementary Figure 6). Generally, the risk of bias was assessed by reviewers using a recognized bias tool. QUADAS 2 where CT density was being considered as a diagnostic tool. Funnel plots and Begg-Mazumdar/Egger tests were selected to assess publication bias and reduce bias by excluding date or language limits during our search. No publication bias was found ( Supplementary Table 5).
Several of the meta-analyses showed slight heterogeneity. The I2 index was > 50 % for correlations between WA% and FEV1 %pred in inspiration (P = 0.017, I2 index = 61.1%), WT and FEV1/FVC in inspiration ( P = 0.000, I2 index =96.1%), AI and FEV1 %pred in inspiration (P = 0.000, I2 index = 90.7%), and AI and FEV1/FVC in inspiration (P = 0.031, I2 index = 71.1%). Because heterogeneity was high, a sensitivity analysis were conducted to explore the sources of the heterogeneity. Finally, we found that Washko’s[28] study was the main source of heterogeneity mainly because subjects with GOLD 3 and 4 diseases were pooled into one group (GOLD 3&4) due to limited numbers of subjects with GOLD stage 4 disease which may cause selection bias.
Synthesis of results in the meta-analysis
A total of 4762 participants were included in the meta-analysis (Supplementary Figure 3). The CC between %LAA-950 and FEV1%pred in inspiration was reported in 24 articles [14,21-23,25-27,29-32,34,36,40-42,46,48-50,53-56]. Two [22,28] National Lung Screening Test (NLST) cohorts and three [25,26,47] Korean Obstruction Lung Disease (KOLD) cohorts were performed. The pooled CC between %LAA-950 and FEV1%pred was -0.51 (-0.56, -0.47), -0.59 (-0.65, -0.53) in inspiration and expiration, respectively. The pooled CC between %LAA<950 and FEV1/FVC was -0.64 (-0.68, -0.59), -0.66 (-0.72, -0.61) in inspiration and expiration, respectively.
Ten articles [21,23-25,28,31,42,51,53,58] reported CCs between WA% and FEV1%pred in inspiration. Two articles [21,25] were excluded because airway measurements only involved airway above the fifth generation. Another article 33 was excluded because it did not report which airway were measured, making data extraction difficult. Therefore, a total of 7 articles were included [23,24,31,42,51,53,58]. In the included literature, the average lumen diameter of the peripheral airway was about 2 - 3 mm. The pooled CC value between WA% and FEV1%pred was -0.46 (95% CI: -0.55, -0.38) in inspiration. Expiratory CT was not used for airway measurements.
No duplicate reports were found when extracting data related to MLD. The CC between MLD and FEV1%pred was reported in five articles [25,30,31,43,63]. Two [43,63] KOLD cohorts were excluded because the article quality scores were not high and the post-CT processing method was different than that used in the other studies. Three articles [25,30,31] were included. The pooled CC between MLD and FEV1%pred was 0.44 (95% CI: 0.36, 0.53) and MLD and FEV1/FVC was 0.54 (95% CI: 0.39, 0.68) in inspiration.
Only three studies [36,43,47] were analyzed according to strict criteria for inclusion. From these studies, we determined that the pooled CC between ATI and FEV1/FVC was -0.71 (95% CI: -0.77, -0.65) in inspiration. This study did not analyze ATI and FEV1%pred because few articles included this information.
Three articles [28,33,52] reported CCs between WT and FEV1%pred in inspiration. The pooled CC between WT and FEV1%pred was -0.15 (95% CI: -0.25, -0.05) in inspiration, and the pooled CC of WT and FEV1/FVC was -0.33 (95% CI: -0.69, 0.02) in inspiration.
Five articles [24,28,31,52,58] reported CCs between AI and FEV1%pred in inspiration. However, AI and FEV1/FVC only had three groups of data, and the heterogeneity of this data was relatively large, it was necessary to study further. The pooled CC between AI and FEV1%pred was 0.40 (95% CI: 0.20, 0.59) in inspiration, and the pooled CC of AI and FEV1/FVC was 0.21 (95% CI: 0.07, 0.35) in inspiration.
Eight articles [21,23-25,28,31,42,51,53,58] reported CCs between LAA-950 and FEV1%pred using GE in inspiration. Five articles [26,34,42,46,50] reported CCs between LAA-950 and FEV1%pred using other brands of CT machines (such as Siemens, Toshiba,and Philips) in inspiration. The pooled CC between LAA-950 and FEV1%pred using GE was -0.50 (95% CI: -0.56, -0.45) and -0.59(95% CI: -0.65, -0.53) between LAA-950 and FEV1%pred using other brands of CT machines.
Subgroup analysis
We performed a subgroup analysis, depending on the radiation dose. At <950 doses (such as -910HU, -900HU), the pooled CC was -0.48 (95% CI: -0.56, -0.39). At doses of 950HU, the pooled CC was -0.51 (95% CI: -0.56,-0.47). There was no significant difference between %LAA-950 and FEV1%pred (P > 0.05). Subgroup analysis was performed for inspiratory and expiratory CT. Compared with inspiratory CT, expiratory CT %LAA-950 showed a stronger negative correlation with FEV1%pred (P < 0.05), MLD and FEV1%pred showed a stronger positive correlation (P < 0.001), but there were no significant correlations between %LAA-950 and FEV1/FVC, or MLD and FEV1/FVC (P > 0.05). Subgroup analyses were also performed based on the brands of CT machines. The pooled CC was -0.50 (95% CI: -0.56, -0.45) in the first group (GE) and -0.59 (95% CI: -0.65,-0.53) in the second group (Siemens, Toshiba, and Philips). That is, there was no significant difference between %LAA-950 and FEV1%pred according to CT machine (P > 0.05) (Supplementary table 5 and 6).