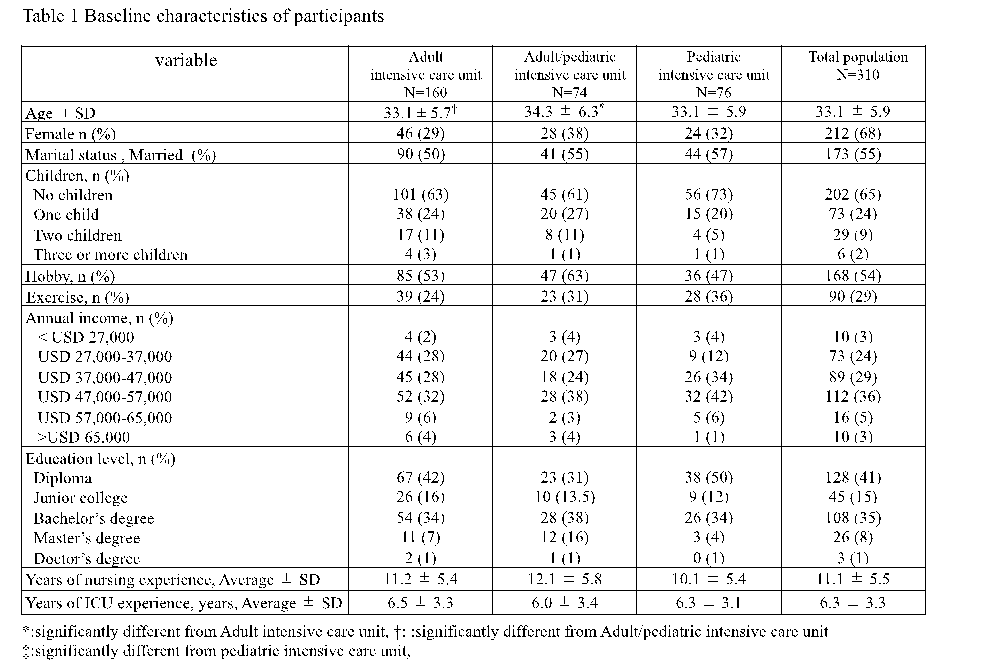
Demographic data
We enrolled 310 participants from September 2019 to February 2020 and
demographic data is shown in Table 1. The mean age of the participants was 33.1 years (± 5.9) and about 70% were female. Approximately 55% of the participants were married and 65% were childless. About half (54%) of the participants had hobbies and 29% had an exercise habit. Approximately 40% of the nurses had diplomas, with 35% of the nurses having a bachelor’s degree and 1% had a doctorate. A majority of the nurses (36%) earned between 47,000-57,000 USD annually and had an average nursing experience duration of 11.1 (± 5.5) years and average ICU experience of 6.3 (± 3.3) years.
Distribution of personality traits
As shown in Figure 1, the distribution of personality traits based on the Big Five theory did not significantly differ between Adult ICU, Adult/pediatric ICU and PICU categories for extraversion (Adult ICU: 3.8 ± 1.2 vs. Adult/pediatric ICU: 3.9 ± 1.2 vs. PICU: 3.6 ± 0.9, p=0.35), agreeableness (Adult ICU: 4.1 ± 1.1 vs. Adult/pediatric ICU: 4.3 ± 1.1 vs. PICU: 3.8 ± 0.9, p=0.05), conscientiousness (Adult ICU: 3.6 ± 1.0 vs. Adult/pediatric ICU: 3.8 ± 1.0 vs. PICU: 3.5 ± 0.9, p=0.28), neuroticism (Adult ICU: 3.6 ± 1.1 vs. Adult/pediatric ICU: 3.7 ± 1.1 vs. PICU: 3.9 ± 0.9, p=0.21), and openness (Adult ICU: 3.7 ± 1.1 vs. Adult/pediatric ICU: 3.9 ± 1.2 vs. PICU: 3.7 ± 1.0, p=0.34). With regard to the distribution of personality traits based on Type-D personality shown in Figure 2, the prevalence of Type-D personality did not significantly differ between Adult ICU, Adult/pediatric ICU and PICU categories (Adult ICU: 37% vs. Adult/pediatric ICU: 44% vs. pediatric ICU: 32%, p=0.67). Differences in the NA (Adult ICU: 9.6 ± 6.5 vs. Adult/pediatric ICU: 9.2 ± 5.6 vs. pediatric ICU: 8.4 ± 5.6, p=0.37) and SI (Adult ICU: 9.6 ± 5.6 vs. Adult/pediatric ICU: 10.3 ± 5.9 vs. pediatric ICU: 9.1 ± 4.8, p=0.37) categories were also not significantly different.
Severity of hospital ethical climate
As shown in Figure 3, The severity of total of ethical climate did not significantly differ between categories (Adult ICU: 67.5 ± 12.1 vs. Adult/pediatric ICU: 67.3 ± 15.8 vs. pediatric ICU: 66.1 ± 10.1, p=0.69) and no significant differences were seen for each component: peers (Adult ICU: 11 ± 2.6 vs. Adult/pediatric ICU: 11.1 ± 3.2 vs. PICU: 10.5 ± 2.5, p=0.38), patients (Adult ICU: 11.5 ± 2.3 vs. Adult/pediatric ICU: 11.2 ± 2.7 vs. PICU: 11.4 ± 2.1, p=0.66), managers (Adult ICU: 14.7 ± 4.8 vs. Adult/pediatric ICU: 14.9 ± 5.0 vs. PICU: 13.8 ± 3.4, p=0.27), hospital (Adult ICU: 14.9 ± 3.8 vs. Adult/pediatric ICU: 14.5 ± 3.9 vs. PICU: 14.8 ± 3.5, p=0.79), and doctor (Adult ICU: 15.3 ± 3.5 vs. Adult/pediatric ICU: 15.4 ± 4.2 vs. PICU: 15.4 ± 3.7, p=0.97).
Average severity of BOS, STS and CS
As shown in Figure 4, the average BOS score in the PICU category was significantly lower compared with Adult ICU (p<0.05) and Adult/pediatric ICU categories (p<0.05) (Adult ICU: 32 ± 5.5 vs. Adult/pediatric ICU: 33.5 ± 5.6 vs. PICU: 28.6 ± 4.3) while the average of severity of STS in the PICU category was also significantly lower compared with Adult ICU (p<0.05) and Adult/pediatric ICU categories (p<0.05) (Adult ICU: 28.5 ± 4.6 vs. Adult/pediatric ICU: 28.8 ± 6.1 vs. PICU: 26.7 ± 3.9). Moreover, the average severity of CS in the PICU category was significantly higher compared with Adult ICU (p<0.05), and Adult/pediatric ICU categories (p<0.05) (Adult ICU: 29.3 ± 5.5 vs. Adult/pediatric ICU: 30.5 ± 6.8 vs. PICU: 32.7 ± 5.4).
Factors associated with BOS, STS and CS by univariate analysis
Exercise habits and improved total HECS scores (p=0.01), plus each component of HECS (p<0.01) were significantly associated with decreased BOS (p<0.01), neuroticism (p=0.01), and Type-D personality(p<0.01) while the components of type D personality (NA [p<0.01] and SI [p=0.01]) were associated with increased BOS. Age(p=0.02), hobby (p=0.04), years of nursing experience (p=0.04), years of ICU experience (p=0.03), extraversion (p<0.01), agreeableness (p<0.01) and improved total HECS score (p<0.01) plus each component of HECS (peers: p<0.01, patients: p=0.01, managers: p<0.01, hospital: p<0.01, doctor: p<0.01) were associated with decreased STS while female (p=0.02), neuroticism(p=0.02), Type-D personality (p<0.01) plus each component of type D personality, NA (p=0.01) and SI (p=0.02) were associated with increased STS. On the other hand, age (p<0.01), number of children(p=0.04), exercise habit (p<0.01), years of nursing experience (p=0.01), years of ICU experience (p<0.01), extraversion (p<0.01), agreeableness (p<0.01), openness (p=0.03) and improved total HECS score (p<0.01) plus each component of HECS were associated with increased CS (p<0.01 of all) but only neuroticism was associated with decreased CS (p=0.03). Complete results of this univariate modeling are available online (Supplementary File 1).
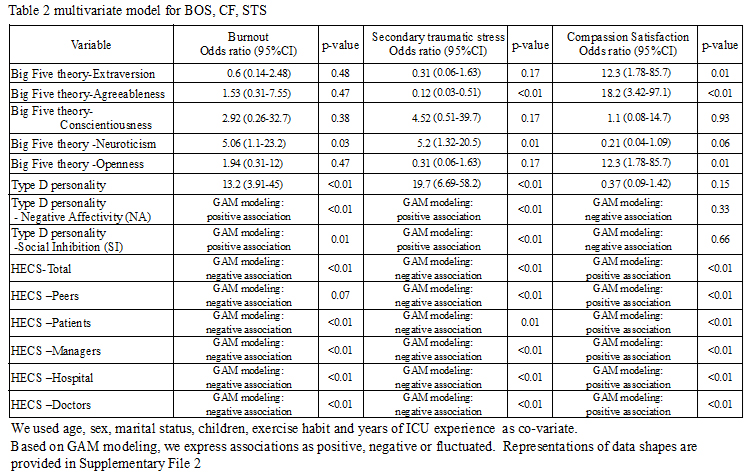
Associations between personality traits and HEC for BOS, STS and CS by multivariate analysis
Table 2 shows the results of the multivariate analysis. Neuroticism (p=0.03), Type-D personality (p<0.01) plus each component of type D personality, NA (p<0.01) and SI (p=0.01), and total HECS score (p<0.01) plus each component of HECS (except Peers) were associated with increased BOS (Patients: p<0.01, Managers: p<0.01, Hospital: p<0.01, Doctor: p<0.01). All the risk factors for increased BOS were also risk factors for increased STS and agreeableness (p<0.01), and peer component of HECS (p<0.01) were an additional associated factor for STS. For CS, extraversion (p=0.01), agreeableness (p<0.01), openness (p=0.01), and total HECS score (p<0.01) plus each component of HECS were associated with increased CS (p<0.01 for all). Of all the multivariate modeling, only exercise habit was independently associated with increased BOS and STS but decreased CS. Detailed results of multivariate modeling, including covariates for each personality trait and HEC (including covariates), are available online. (Supplementary File 2)
Interaction between HEC and personality traits based on Big Five theory for BOS, STS and CS
We show the interaction between ethical climate and personality traits based on the Big Five theory for BOS, STS and CS in Figure 5. We observed an interaction between ethical climate, conscientiousness (p<0.01) and neuroticism (p=0.01) for BOS, an interaction for STS between ethical climate and conscientiousness (p<0.01), and an interaction for CS between ethical climate and neuroticism (p=0.01). This result indicated that worse ethical climates increase the magnitude of BOS, STS and CS for nurses possessing specific personality traits. We also observed that high conscientiousness nurses did not answer more than 88 out of 120 questions for HECS compared with 111 out of 120 questions in the low conscientiousness group. This difference was also seen in agreeableness as high agreeableness nurses did not answer less than 50 out of 120 questions for HECS compared with 22 out of 120 questions in the low agreeableness group. Detailed results of Interaction between HEC and personality traits based on Big Five theory for BOS, STS and CS are available online. (Supplementary File 3)
Interaction between ethical climate and Type D personality for BOS, STS and CS
We also show the interaction between HEC and Type D personality for BOS, STS and CS in Figure 6. An interaction between ethical climate and Type D personality for BOS (p<0.01) and STS (p<0.01) but not CS (p=0.29) was observed, indicating that a substandard ethical climate increases the magnitude of BOS and STS (but not CS) for Type D personality nurses.