Identification of pyroptosis-related cluster
A total of 38 differential pyroptosis-related genes were determined between normal and tumor samples ( normal, N = 113; and tumor, N = 1110) from 51 pyroptosis-related genes, and the expression levels of the 38 genes were shown using the R package “pheatmap” (Figure 2 A). Subsequently, based on the 38 differential pyroptosis-related genes, two pyroptosis-related clusters (cluster C1, N = 439; cluster C2, N = 586) were built by the R package “ConsensusClusterPlus” (Figure 2 B-D), and principal components analysis (PCA) and t-Distributed Stochastic Neighbor Embedding analysis (tSNE) plots were constructed to clarified the two clusters with obvious alterations by R package “Rtsne” (Figure 2 E, F). Violin plots showed the expression levels of the 38 differential pyroptosis-related genes in the two clusters by R package “vioplot” (Figure 2 F).
Identification of DEGs and Bioinformatic Analysis of the two pyroptosis-related clusters
The differential gene expression analysis was run on the two pyroptosis-related clusters by Wilcoxon test, a total of 434 DEGs were identified and shown in the pheatmap (Figure 3 A). Subsequently, the PPI was constructed to visualize the interactions among 434 DEGs (Figure 3 F). GO functional enrichment (Figure 3 B) and KEGG pathway (Figure 3 C) analysis demonstrated that the DEGs were enriched in immune-related pathways, for instance, humoral immune response, adaptive immune response based on somatic recombination of immune, B cell mediated immunity, complement activation, immunoglobulin mediated immune response. To further estimate the level of individual tumor-infiltrating immune cells in the two pyroptosis-related clusters, we performed CIBERSORT and the landscape of tumor-infiltrating immune cells were shown in the barplot (Figure 3 D). Some types of tumor-infiltrating immune cells were variously distributed in different pyroptosis-related clusters, for instance, B cells naive, plasma cells, T cells CD8, T cells CD4 memory resting, T cells CD4 memory activated, T cells follicular helper, T cells gamma delta, NK cells resting, macrophages M0, macrophages M1, macrophages M2, dendritic cells resting, mast cells resting, mast cells activated, and neutrophils (Figure 3 E).
Construction of risk model based on pyroptosis-related DEGs
Univariate Cox proportional hazard analysis identified 256 DEGs with prognostic value, 56 of which were determined by multivariate Cox regression to be the optimum prognostic model for predicting PFI risk in patients with BC (Figure 4 A). Risk scores were calculated using the formula: (-0.987057257203668) × AC092580.4 + (-0.251134164354081) × AC244250.2 + (-0.696889063257661) × ACKR1 + (-0.728197493550041) × CD1E + (-1.28880588659078) × CD38 + (-0.749754473910941) × CD48 + 1.06651917547229 × CD5 + 0.417774917378414 × CD69 + 0.455049416172314 × CD79B + 1.26125159638399 × CLEC10A + (-0.228225002214848) × CXCL13 + 0.570516209242267 × EOMES + (-0.548224326281222) × GBP5 + (-0.808563754149334) × GPR18 + 0.309953007309132 × IGHV1-67 + (-0.382414611465128) × IGHV1OR15-2 + 0.246548177641936 × IGHV2-5 + (-0.217409966870419) × IGHV3-49 + (-0.337868541294558) × IGHV3-64 + 0.481005132311589 × IGHV3OR16-13 + 0.362325938526143 × IGHV4-59 + 0.267679621408054 × IGHV5-51 + (-0.206745388340921) × IGKV1-12 + (-0.308185907992354) × IGKV1-27 + (-0.295832726777701) × IGKV1D-16 + 0.176168233864854 × IGKV2D-29 + (-0.180553560947138) × IGKV6D-21 + (-0.353895265830746) × IGLC6 + (-0.13468212251366) × IGLC7 + (-0.223445262734337) × IGLV1-44 + 0.43234569593985 × IGLV2-18 + (-0.261424690345591) × IGLV2-23 + 0.316233011111683 × IGLV3-1 + (-0.198351090291727) × IGLV7-46 + 1.54706517805225 × IL18RAP + (-1.12171432642784) × JAML + (-0.815093088434387) × LTA + 0.529889539295384 × PLAC8 + 0.222843634703247 × PTGDS + 1.03697032621277 × RP11-1094M14.8 + 0.919914395439576 × RP5-887A10.1 + 1.47556877488067 × SIRPG + 2.23000355091989 × SNX20 + 0.306047643348901 × SPIB + (-0.906891717453051) × STAT4 + (-0.734422756261579) × TBC1D10C + -1.66310277162408 × TESPA1 + 2.21446216265984 × THEMIS + (-1.22937862865569) × TIFAB + 0.884293123405389 × TNFRSF17 + (-0.857408288132703) × TRAV12-3 + 0.719532867205727 × TRAV4 + (-0.62530870110772) × TRBV4-2 + (-0.810480270943384) × TRBV6-6 + (-0.970070159582118) × TRDV1 + (-0.501566873333783) × VPREB3. Based on the risk score, –0.956728925, calculated as the cut-off point, the patients were grouped into high (N = 308) and low (N = 717) risk groups. Patients with high-risk scores tended to present poorer clinical outcomes compared with patients with low-risk (Figure 4 B). Expression levels of the 56 pyroptosis-related genes were shown in a violin plots (Figure 4 C).
Clinicopathological features
A total of 1025 female cases with BC recorded in TCGA were extracted for analyses in this study. The median patient age was 58 years (range, 26 to 90 years), while the median PFI was 767 days, and DSS were 825 days. The 10-year PFI rate for all cases analyzed was 87.6%, and 10-year DSS was 92.9%. BC tumor size, lymph node, and metastasis status (TNM) stage was defined as outlined by the Eighth Edition American Joint Committee on Cancer (AJCC) Staging Manual[4], and molecular subtype (PAM50) was derived from a previous report by Thorsson et al[24]. In the age subgroup, the proportion of ≥ 61y subgroup patients in the high risk group was significantly higher than that in the ≤40y and 41-60y subgroup in the training dataset, χ2 = 6.492, P = 0.040, but not in the validation dataset, χ2 = 5.661, P = 0.059. In the molecular subgroup, the proportion of luminal A subgroup patients in the high risk group was significantly lower than that in the other subgroup in the training dataset, χ2 = 10.957, P = 0.027, but not in the validation dataset, χ2 = 6.174, P = 0.187). Further, metastasis status was associated with a higher proportion of patients in the high risk group for the both total dataset (χ2 = 11.582, P = 0.001), and validation dataset (χ2 = 7.243, P = 0.011). The demographic and clinical, pathologic characteristics of the patient with breast cancer were shown in Table 1.
|
Table 1 Demographic and Clinical, Pathologic Characteristics of The Patient with Breast Cancer
|
|
Variable
|
Training dataset
|
|
|
Validation dataset
|
|
|
Total
|
Risk group
|
c2
|
P value
|
Total
|
Risk group
|
c2
|
P value
|
|
Low
|
High
|
Low
|
High
|
|
|
n=1025
|
n=717
|
n=308
|
n=512
|
355
|
157
|
|
Age, y
|
|
|
|
|
|
|
|
|
|
|
|
≤40
|
94
|
70
|
24
|
6.429
|
0.040
|
45
|
33
|
12
|
5.661
|
0.059
|
|
41-60
|
473
|
345
|
128
|
|
|
243
|
179
|
64
|
|
|
|
≥61
|
458
|
302
|
156
|
|
|
224
|
143
|
81
|
|
|
|
Subtype(PAM50)
|
|
|
|
|
|
|
|
|
|
|
|
LumA
|
480
|
357
|
123
|
10.957
|
0.027
|
54
|
35
|
19
|
6.174
|
0.187
|
|
LumB
|
176
|
110
|
66
|
|
|
253
|
186
|
67
|
|
|
|
HER2
|
70
|
48
|
22
|
|
|
86
|
53
|
33
|
|
|
|
Basal
|
170
|
111
|
59
|
|
|
39
|
29
|
10
|
|
|
|
Normal
|
129
|
91
|
38
|
|
|
80
|
52
|
28
|
|
|
|
Tumor size
|
|
|
|
|
|
|
|
|
|
|
|
T1
|
261
|
194
|
67
|
5.926
|
0.052
|
119
|
90
|
29
|
3.515
|
0.172
|
|
T2
|
601
|
420
|
181
|
|
|
307
|
210
|
97
|
|
|
|
T3-T4
|
163
|
103
|
60
|
|
|
86
|
55
|
31
|
|
|
|
Lymph node status
|
|
|
|
|
|
|
|
|
|
|
N0
|
498
|
351
|
147
|
5.650
|
0.059
|
246
|
170
|
76
|
2.033
|
0.362
|
|
N1
|
343
|
250
|
93
|
|
|
168
|
122
|
46
|
|
|
|
N2-N3
|
184
|
116
|
68
|
|
|
98
|
63
|
35
|
|
|
|
Metastasis status
|
|
|
|
|
|
|
|
|
|
|
M0
|
1009
|
712
|
297
|
11.582
|
0.001
|
502
|
352
|
150
|
7.243
|
0.011a
|
|
M1
|
16
|
5
|
11
|
|
|
10
|
3
|
7
|
|
|
|
a, Fisher's Exact Test.
|
A 56 pyroptosis-related genes signature associated with prognosis of patients with BC
Univariate and multivariate Cox proportional hazard regression analyses for 10-year PFI indicated that higher 56 pyroptosis-related genes risk score was correlated with higher incidences of clinical events (univariate analysis, HR = 6.257, 95% CI: 4.331–9.039, P < 0.001; multivariate analysis, HR = 5.643, 95% CI 3.894–8.175, P < 0.001). Furthermore, univariate and multivariate Cox proportional hazard regression analyses for 10-year DSS also indicated that higher 56 pyroptosis-related genes risk score was correlated with higher incidences of clinical events (univariate analysis, HR = 5.520, 95% CI: 3.407–8.944, P < 0.001; multivariate analysis, HR = 4.578, 95% CI 2.797–7.494, P < 0.001). The results of univariate and multivariate Cox proportional hazard regression analyses for 10-year PFI and DSS were shown in Table 2.
|
Table 2 Univariate and Multivariate Cox proportional hazard models of PFI and DSS in Breast Cancer
|
|
Variables
|
Progression Free Interval
|
Disease Specific Survival
|
|
Univariate
|
Multivariate
|
Univariate
|
Multivariate
|
|
HR
|
95%CI
|
P value
|
HR
|
95%CI
|
P value
|
HR
|
95%CI
|
P value
|
HR
|
95%CI
|
P value
|
|
Age
|
|
|
|
|
|
|
|
|
|
|
|
|
|
41-60y
|
0.468
|
0.285-0.769
|
0.003
|
0.5014
|
0.299-0.841
|
0.009
|
0.446
|
0.228-0.439
|
0.018
|
0.445
|
0.217-0.912
|
0.027
|
|
≥61y
|
0.686
|
0.421-1.119
|
0.131
|
0.716
|
0.431-1.191
|
0.198
|
0.834
|
0.439-1.585
|
0.580
|
0.972
|
0.494-1.912
|
0.935
|
|
Subtype(PAM50)
|
|
|
|
|
|
|
|
|
|
|
|
|
Luminal-A
|
0.675
|
0.416-1.095
|
0.112
|
|
|
|
0.417
|
0.222-0.783
|
0.006
|
0.414
|
0.218-0.787
|
0.007
|
|
Luminal-B
|
0.694
|
0.370-1.301
|
0.255
|
|
|
|
0.589
|
0.269-1.289
|
0.185
|
0.378
|
0.168-0.851
|
0.019
|
|
HER2
|
1.040
|
0.485-2.230
|
0.920
|
|
|
|
0.757
|
0.279-2.054
|
0.584
|
0.810
|
0.291-2.258
|
0.687
|
|
Basal like
|
1.217
|
0.712-2.081
|
0.473
|
|
|
|
0.910
|
0.464-1.787
|
0.785
|
0.841
|
0.415-1.706
|
0.632
|
|
Tumor size
|
|
|
|
|
|
|
|
|
|
|
|
|
|
T2
|
1.865
|
1.144-3.042
|
0.013
|
1.476
|
0.891-2.447
|
0.131
|
1.656
|
0.881-3.110
|
0.117
|
0.994
|
0.508-1.947
|
0.986
|
|
T3-T4
|
3.643
|
2.131-6.228
|
<0.001
|
2.073
|
1.145-3.751
|
0.016
|
3.126
|
1.561-6.257
|
0.001
|
1.483
|
0.682-3.228
|
0.320
|
|
Lymph node status
|
|
|
|
|
|
|
|
|
|
|
|
|
N1
|
1.670
|
1.106-2.522
|
0.015
|
1.367
|
0.893-2.094
|
0.150
|
2.723
|
1.538-4.822
|
0.001
|
2.592
|
1.421-4.730
|
0.002
|
|
N2-N3
|
3.151
|
2.015-4.929
|
<0.001
|
1.597
|
0.953-2.677
|
0.075
|
4.137
|
2.186-7.830
|
<0.001
|
2.767
|
1.327-5.773
|
0.007
|
|
Metastasis status
|
|
|
|
|
|
|
|
|
|
|
|
|
|
M1
|
7.804
|
4.386-13.900
|
<0.001
|
4.305
|
2.261-8.194
|
<0.001
|
7.053
|
3.489-14.260
|
<0.001
|
3.553
|
1.617-7.807
|
0.002
|
|
Risk group
|
|
|
|
|
|
|
|
|
|
|
|
|
|
High risk
|
6.257
|
4.331-9.039
|
<0.001
|
5.643
|
3.894-8.175
|
<0.001
|
5.520
|
3.407-8.944
|
<0.001
|
4.578
|
2.797-7.494
|
<0.001
|
|
PFI, Progression Free Interval; CI, Confidence Interval; HR, Hazard Ratio.
|
Moreover, KM survival curves for 10-year PFI, DSS, and OS showed that the high risk group had a worse prognosis in both training (PFI, P < 0.0001, DSS, P < 0.0001, OS, P < 0.0001) and validation (PFI, P < 0.0001, DSS, P < 0.0001, OS, P < 0.0001) datasets (Figure 4 D-F, J-L). To determine the sensitivity and specificity of the 56 pyroptosis-related genes signature for predicting survival, we conducted ROC analyses of the training and validation datasets. ROC curves showed that the 56 pyroptosis-related genes signature had good sensitivity and specificity for predicting survival for 10-year PFI, DSS, and OS in both training (PFI, AUC = 0.768, 95% CI 0.727–0.810, P < 0.001; DSS, AUC = 0.744, 95% CI 0.689–0.800, P < 0.001; OS, AUC = 0.634, 95% CI 0.582–0.686, P < 0.001) and validation (PFI, AUC = 0.793, 95% CI 0.737–0.849, P < 0.001; DSS, AUC = 0.751, 95% CI 0.667–0.836, P < 0.001; OS, AUC = 0.666, 95% CI 0.588–0.744, P < 0.001) datasets (Figure 4 G-I, M-O).
Evaluation of the predictive power of the 56 pyroptosis-related genes signature
According to the AJCC cancer staging manual (8th edition), the TNM stage is correlated with cancer prognosis[4; 12; 26]. Further, age and intrinsic molecular subtype (PAM50) are also closely linked to prognosis in patients with BC[27; 28; 29; 30]. Furthermore, to validate the potential of the 56 pyroptosis-related genes signature as a predictor of PFI, DSS, and OS of patients with BC, the entire TCGA BC dataset was stratified by TNM stage, age, and molecular subtype. Patients were split into three age subgroups (≤ 40, 41–60, and ≥ 61 years old), three lymph node status subgroups (N0, N1, and N2-N3), three tumor size subgroups (T1, T2, and T3-T4), and five molecular subtype subgroups (PAM50, luminal A, luminal B, HER2, basal like, and normal like).
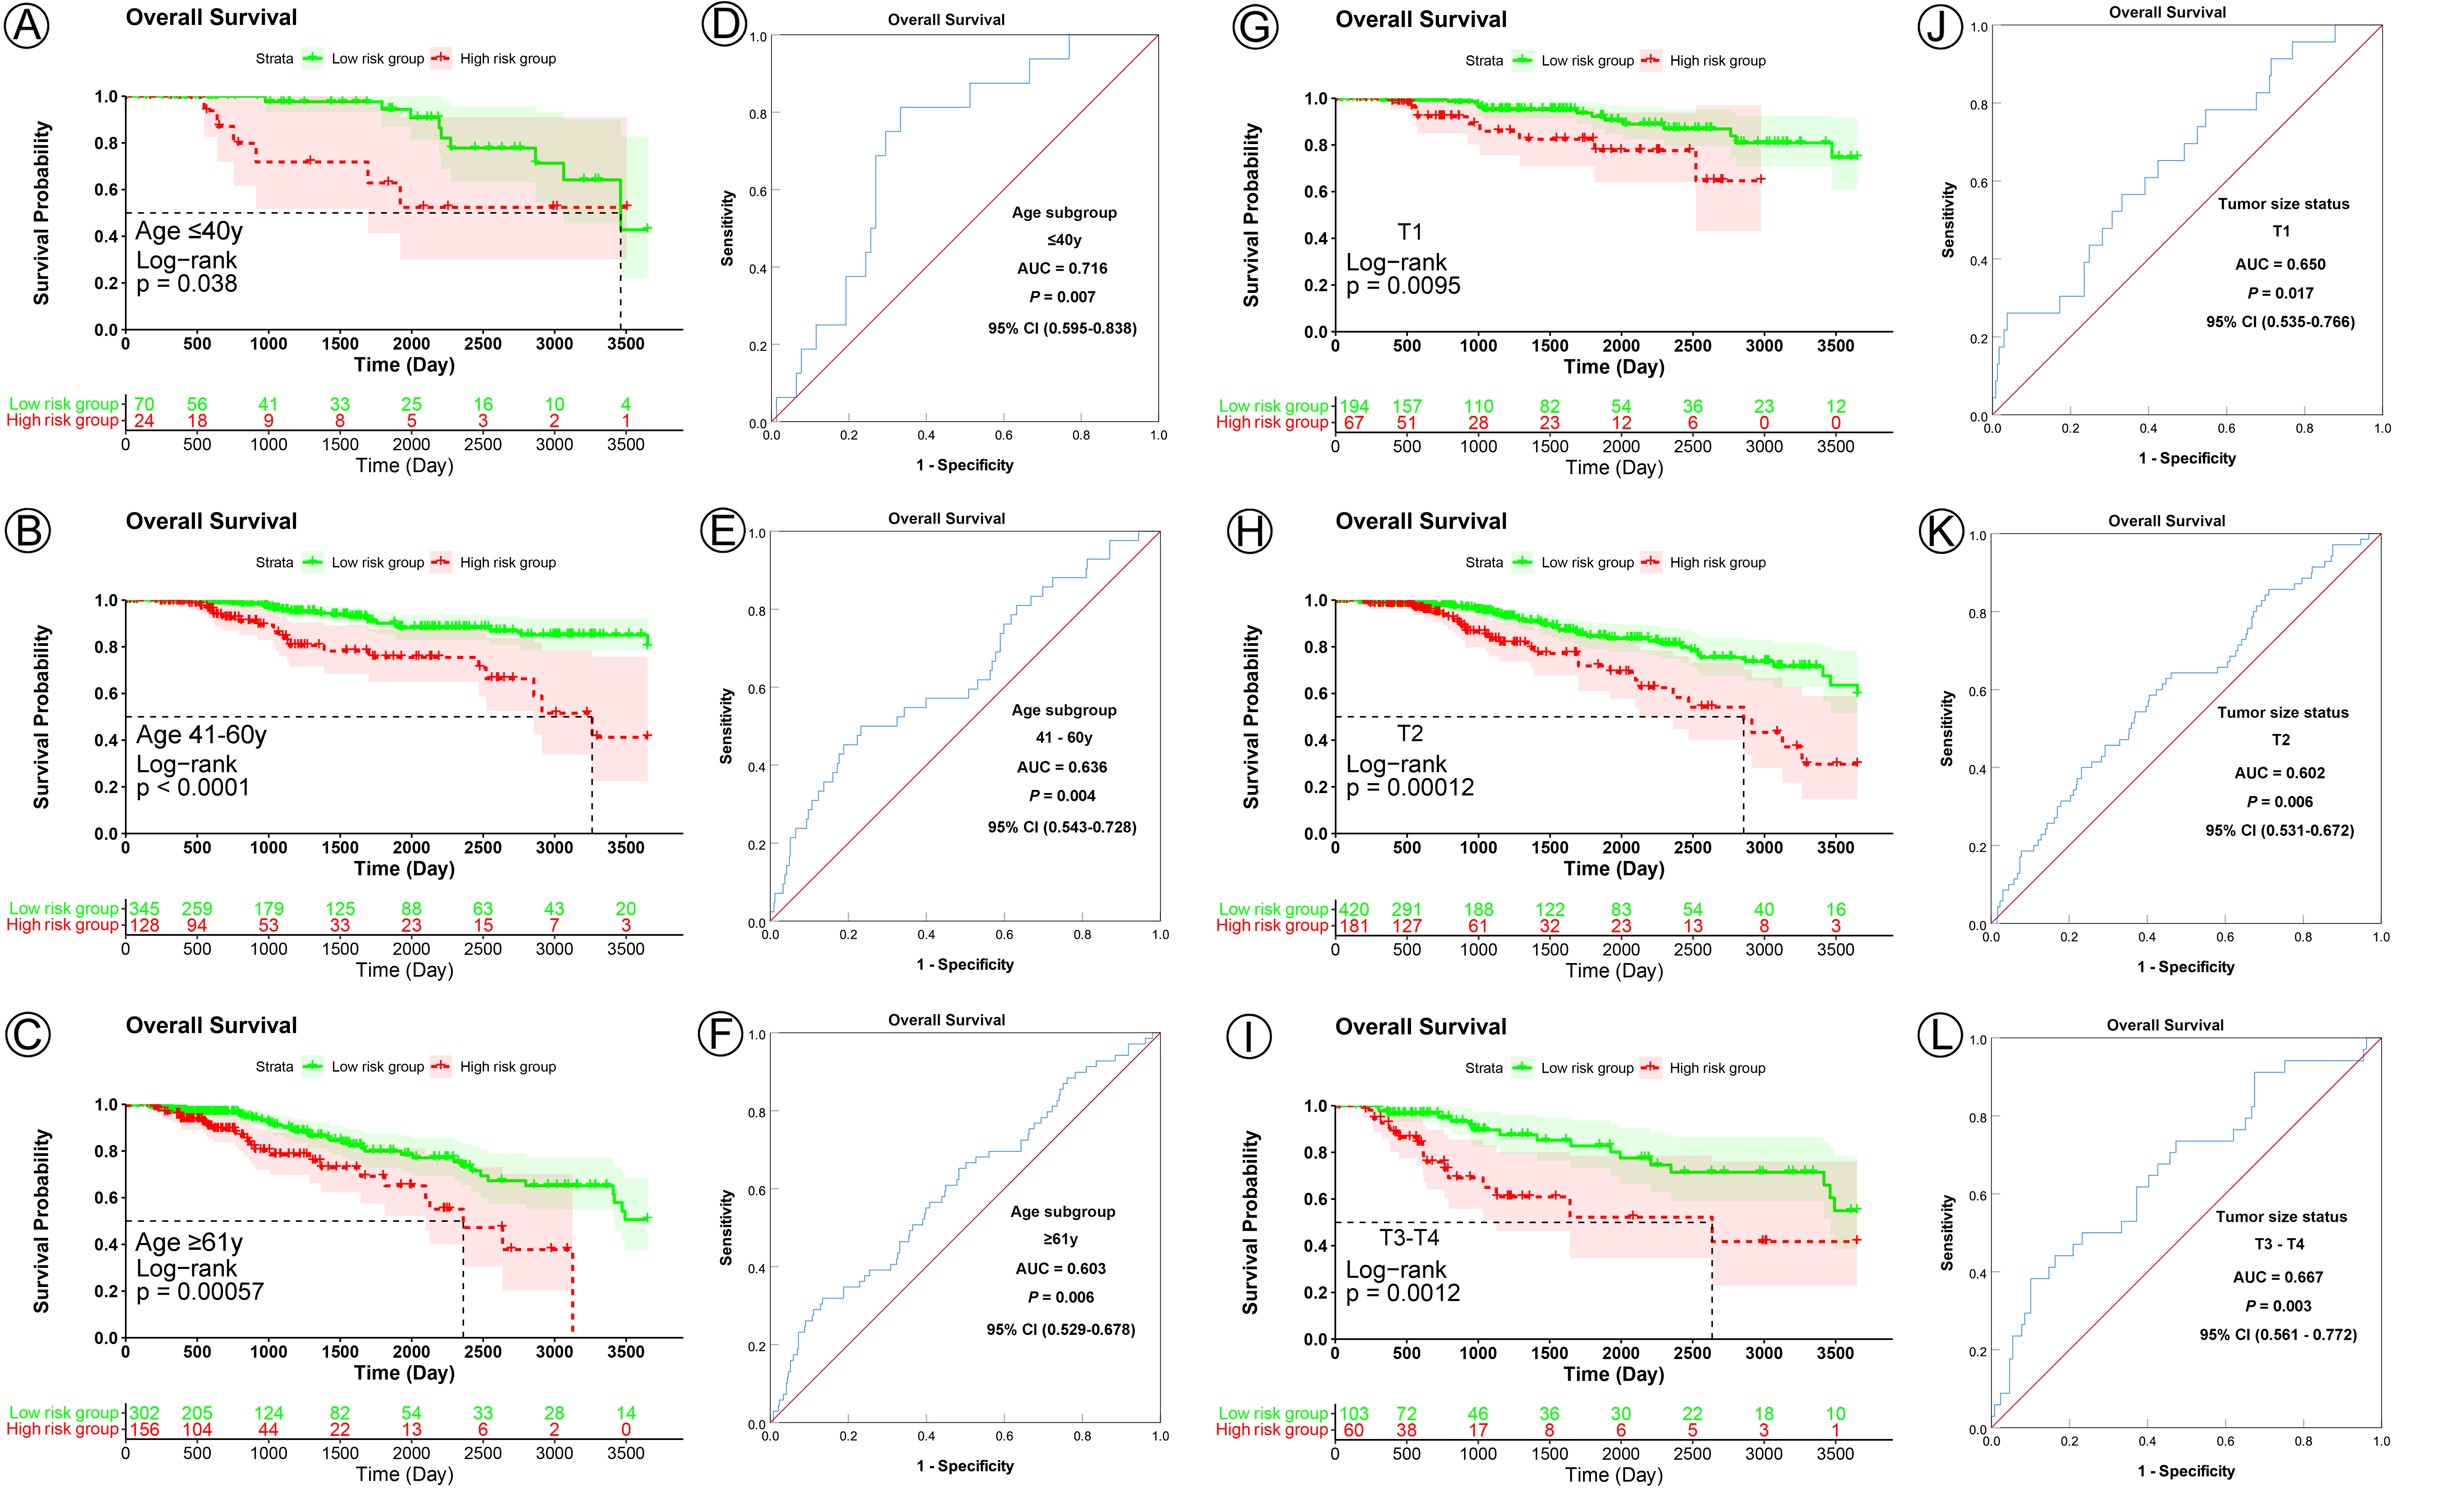
KM analysis indicated that patients in the low risk group had significantly longer PFI, DSS, and OS in all three age subgroups (PFI, ≤ 40y subgroup, P < 0.0001, 41–61y subgroup, P < 0.0001, ≥ 61y subgroup, P < 0.0001; DSS, ≤ 40y subgroup, P = 0.0082, 41–61y subgroup, P < 0.0001, ≥ 61y subgroup, P < 0.0001; OS, ≤ 40y subgroup, P = 0.0038, 41–61y subgroup, P < 0.0001, ≥ 61y subgroup, P = 0.00057) (Figure 5 A-C, G-I; Figure S1 A-C). ROC curve analysis shown that the 56 pyroptosis-related genes signature had good sensitivity and specificity for predicting PFI, DSS, and OS in all three age subgroups (PFI, ≤ 40y subgroup, AUC = 0.796, 95% CI 0.693–0.899, P < 0.001; 41–61y subgroup, AUC = 0.765, 95% CI 0.703–0.808, P < 0.001; ≥ 61y subgroup, AUC = 0.781, 95% CI 0.715–0.847, P < 0.001; DSS, ≤ 40y subgroup, AUC = 0.771, 95% CI 0.661–0.881, P = 0.002; 41–61y subgroup, AUC = 0.718, 95% CI 0.619–0.817, P < 0.001; ≥ 61y subgroup, AUC = 0.762, 95% CI 0.680–0.844, P < 0.001; OS, ≤ 40y subgroup, AUC = 0.716, 95% CI 0.595–0.838, P = 0.007; 41–61y subgroup, AUC = 0.636, 95% CI 0.543–0.728, P < 0.004; ≥ 61y subgroup, AUC = 0.603, 95% CI 0.529–0.678, P < 0.006) (Figure 5 D-F, J-L; Figure S1 D-F).
In analyses of tumor size subgroups, KM curves also showed that patients in the low risk group had a significantly better prognosis for PFI, DSS, and OS than those in the high risk group (PFI, T1 subgroup, P < 0.0001, T2 subgroup, P < 0.0001, T3-T4 subgroup, P < 0.0001; DSS, T1 subgroup, P = 0.0026, T2 subgroup, P < 0.0001, T3-T4 subgroup, P < 0.0001; OS, T1 subgroup, P = 0.0095, T2 subgroup, P < 0.00012, T3-T4 subgroup, P < 0.0012) (Figure 6 A-C, G-I; Figure S1 G-I). ROC analysis demonstrated that the signature had good sensitivity and specificity for predicting PFI, DSS, and OS in all three tumor size status subgroups (PFI, T1 subgroup, AUC = 0.756, 95% CI 0.661–0.850, P < 0.001, T2 subgroup, AUC = 0.758, 95% CI 0.700–0.816, P < 0.001, T3-T4 subgroup, AUC = 0.785, 95% CI 0.702–0.867, P < 0.001; DSS, T1 subgroup, AUC = 0.731, 95% CI 0.589–0.873, P = 0.005, T2 subgroup, AUC = 0.715, 95% CI 0.641–0.789, P < 0.001, T3-T4 subgroup, AUC = 0.789, 95% CI 0.684–0.894, P < 0.001; OS, T1 subgroup, AUC = 0.650, 95% CI 0.535–0.766, P = 0.017, T2 subgroup, AUC = 0.602, 95% CI 0.531–0.672, P < 0.006, T3-T4 subgroup, AUC = 0.667, 95% CI 0.561–0.772, P < 0.003) (Figure 6 D-F, J-L; Figure S1 J-L).
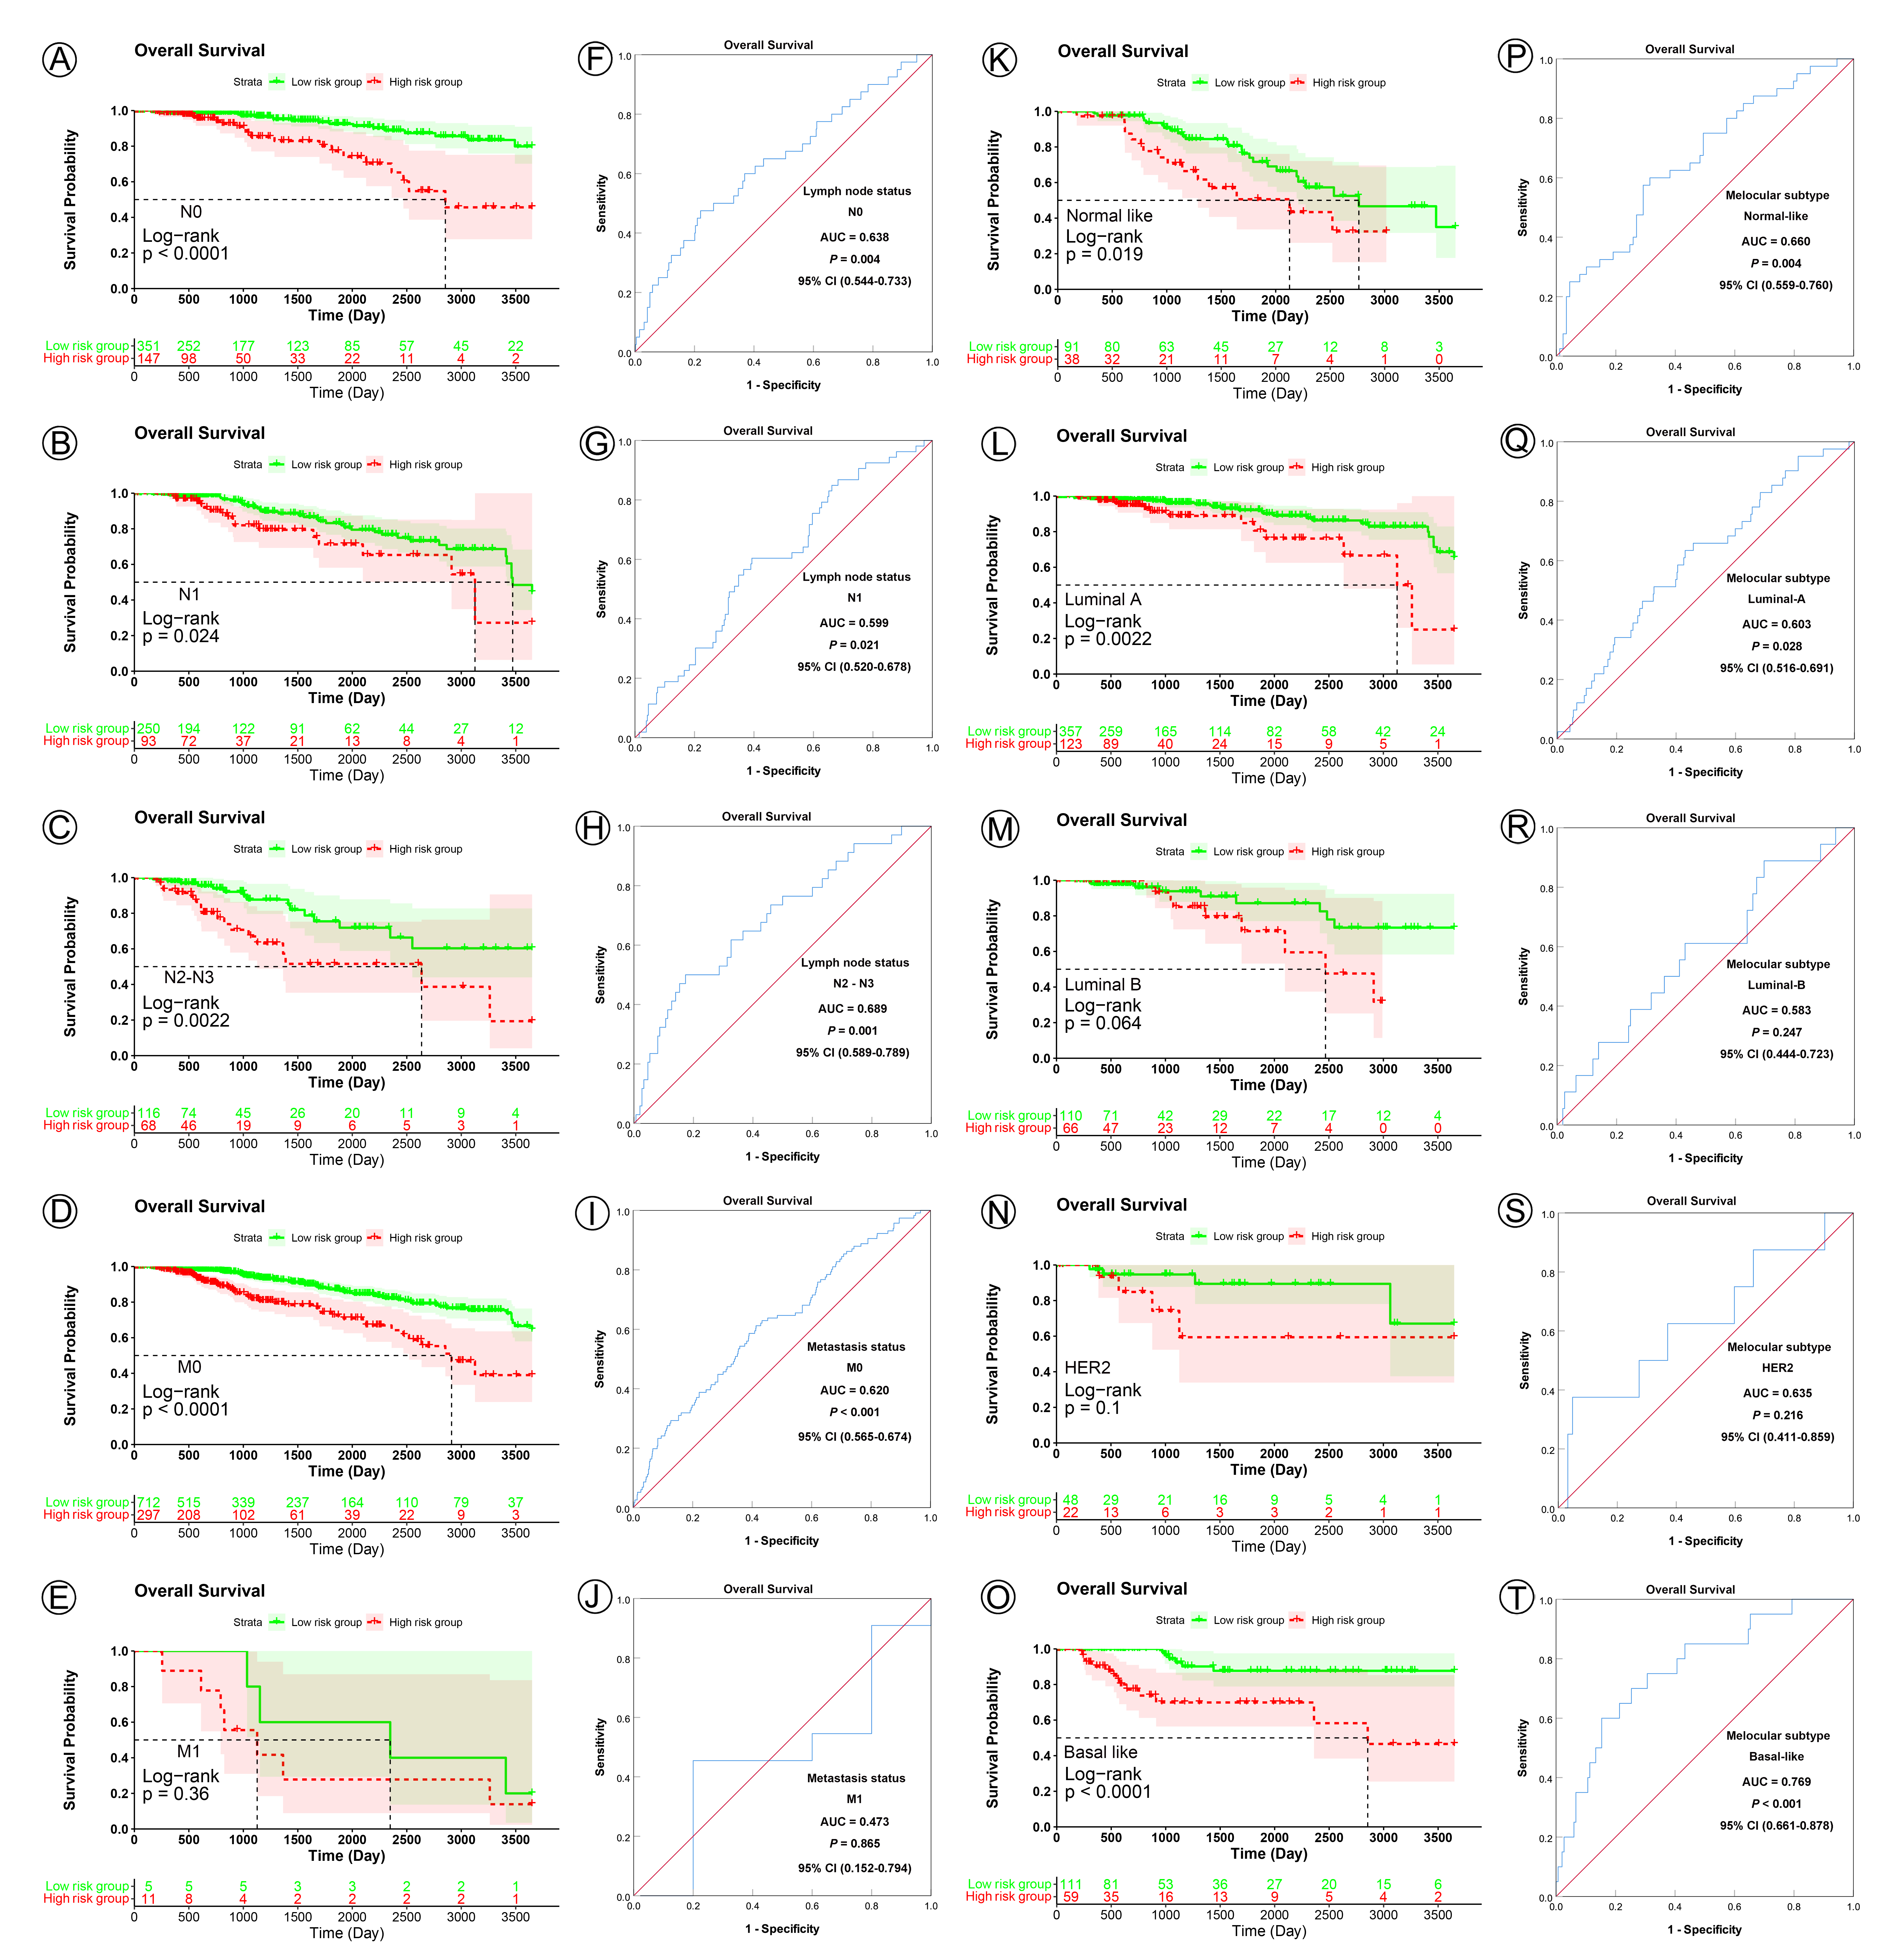
In KM analyses, the curves showed that patients in the low risk group had a significantly better prognosis for PFI, DSS, and OS than those in the high risk group all the lymph node subgroups (PFI, all the N0, N1 and N2-N3 subgroup, P < 0.0001; DSS, N0 subgroup, P < 0.0001, N1 subgroup, P = 0.0027, N2-N3 subgroup, P < 0.0001; OS, N0 subgroup, P < 0.0001, N1 subgroup, P = 0.024, N2-N3 subgroup, P = 0.0022) (Figure 7 A-C, K-M; Figure S2 A-C). ROC analysis demonstrated that the signature had good sensitivity and specificity for predicting PFI, DSS, and OS in all three lymph node status subgroups (PFI, N0 subgroup, AUC = 0.819, 95% CI 0.762–0.875, P < 0.001, N1 subgroup, AUC = 0.733, 95% CI 0.665–0.801, P < 0.001, N2-N3 subgroup, AUC = 0.764, 95% CI 0.676–0.853, P < 0.001; DSS, N0 subgroup, AUC = 0.805, 95% CI 0.717–0.894, P < 0.001, N1 subgroup, AUC = 0.694, 95% CI 0.613–0.775, P < 0.001, N2-N3 subgroup, AUC = 0.797, 95% CI 0.691–0.904, P < 0.001; OS, N0 subgroup, AUC = 0.638, 95% CI 0.544–0.733, P = 0.019, N1 subgroup, AUC = 0.599, 95% CI 0.520–0.678, P = 0.021, N2-N3 subgroup, AUC = 0.689, 95% CI 0.589–0.789, P = 0.001) (Figure 7 F-H, J-L; Figure S2 F-H).
In analyses of metastasis status subgroups, KM curves also showed that patients in the low risk group had a significantly better prognosis for PFI than those in the high risk group (M0 subgroup, P < 0.0001, M1 subgroup, P = 0.012) (Figure 7 D, E), but not for DSS and OS (DSS, M0 subgroup, P < 0.0001, M1 subgroup, P = 0.2; OS, M0 subgroup, P < 0.0001, M1 subgroup, P = 0.36) (Figure 7 N, O; Figure S2 D, E). ROC analysis demonstrated that the signature had good sensitivity and specificity for predicting PFI, DSS, and OS in M0 subgroups (PFI, AUC = 0.764, 95% CI 0.721–0.808, P < 0.001; DSS, AUC = 0.737, 95% CI 0.677–0.796, P < 0.001; OS, AUC = 0.620, 95% CI 0.565–0.674, P < 0.001), but not in M1 subgroup (PFI, AUC = 0.385, 95% CI 0.014–0.755, P = 0.545; DSS, AUC = 0.573, 95% CI 0.221–0.853, P = 0.814; OS, AUC = 0.473, 95% CI 0.152–0.794, P = 0.865) (Figure 7 I, J, S, T; Figure S2 I, J).
In analyses of the five molecular subtype subgroups, KM curves also showed that patients in the low risk group had significantly better prognosis for PFI and DSS than those in the high risk group (PFI, Normal like subgroup, P < 0.0001, Luminal A subgroup, P < 0.001, Luminal B subgroup, P = 0.0006, HER2 subgroup, P = 0.0003, Basal like subgroup, P < 0.0001; DSS, Normal like subgroup, P = 0.025, Luminal A subgroup, P < 0.0001, Luminal B subgroup, P = 0.0007, HER2 subgroup, P = 0.0057, Basal like subgroup, P < 0.0001) (Figure 8 A-E, K-O), but not all for OS (Normal like subgroup, P = 0.019, Luminal A subgroup, P = 0.0022, Luminal B subgroup, P = 0.064, HER2 subgroup, P = 0.1, Basal like subgroup, P < 0.0001) (Figure S2 K-O). ROC analysis demonstrated that the signature had good sensitivity and specificity for predicting PFI and DSS in all the five molecular subtype subgroups (PFI, Normal like subgroup, AUC = 0.783, 95% CI 0.689–0.876, P < 0.001, Luminal A subgroup, AUC = 0.744, 95% CI 0.673–0.815, P < 0.001, Luminal B subgroup, AUC = 0.692, 95% CI 0.561–0.824, P = 0.011, HER2 subgroup, AUC = 0.854, 95% CI 0.753–0.955, P = 0.001, Basal like subgroup, AUC = 0.813, 95% CI 0.738–0.888, P < 0.001; DSS, Normal like subgroup, AUC = 0.735, 95% CI 0.618–0.853, P = 0.002, Luminal A subgroup, AUC = 0.698, 95% CI 0.594–0.802, P = 0.001, Luminal B subgroup, AUC = 0.751, 95% CI 0.611–0.891, P = 0.008, HER2 subgroup, AUC = 0.851, 95% CI 0.712–0.989, P = 0.009, Basal like subgroup, AUC = 0.789, 95% CI 0.684–0.894, P < 0.001) (Figure 8 F-J, P-T), but not all for OS (Normal like subgroup, AUC = 0.660, 95% CI 0.559–0.760, P = 0.004, Luminal A subgroup, AUC = 0.603, 95% CI 0.516–0.691, P = 0.028, Luminal B subgroup, AUC = 0.583, 95% CI 0.444–0.723, P = 0.247, HER2 subgroup, AUC = 0.635, 95% CI 0.411–0.859, P = 0.216, Basal like subgroup, AUC = 0.769, 95% CI 0.661–0.878, P < 0.001) (Figure S2 P-T). Those KM and ROC curves are presented in Figure 5–8, Figure S1, and Figure S2, and the results are summarized in Table 3. Overall, these analyses indicate that the 56 pyroptosis-related genes signature has a good predictive value.
|
Table 3 Result of Kaplan-Meier and ROC analysis based on different regrouping methods
|
| |
|
|
Progression Free Interval
|
Disease Specific Survival
|
|
Regrouping factors
|
Subgroup
|
Sample size
|
Kaplan-Meier
|
ROC
|
Kaplan-Meier
|
ROC
|
|
P value
|
AUC
|
95%CI
|
P value
|
P value
|
AUC
|
95%CI
|
P value
|
|
Age, y
|
|
|
|
|
|
|
|
|
|
| |
≤40
|
94
|
<0.001
|
0.796
|
0.693-0.899
|
<0.001
|
0.001
|
0.771
|
0.661-0.881
|
0.002
|
| |
41-60
|
473
|
<0.001
|
0.765
|
0.703-0.808
|
<0.001
|
<0.001
|
0.718
|
0.619-0.817
|
<0.001
|
| |
≥61
|
458
|
<0.001
|
0.781
|
0.715-0.847
|
<0.001
|
<0.001
|
0.762
|
0.680-0.844
|
<0.001
|
|
Tumor size status
|
|
|
|
|
|
|
|
|
|
| |
T1
|
261
|
<0.001
|
0.756
|
0.661-0.850
|
<0.001
|
0.003
|
0.731
|
0.589-0.873
|
0.005
|
| |
T2
|
601
|
<0.001
|
0.758
|
0.700-0.816
|
<0.001
|
<0.001
|
0.715
|
0.641-0.789
|
<0.001
|
| |
T3-T4
|
163
|
<0.001
|
0.785
|
0.702-0.867
|
<0.001
|
<0.001
|
0.789
|
0.648-0.894
|
<0.001
|
|
Lymph node status
|
|
|
|
|
|
|
|
|
|
| |
N0
|
498
|
<0.001
|
0.819
|
0.762-0.875
|
<0.001
|
<0.001
|
0.805
|
0.717-0.894
|
<0.001
|
| |
N1
|
343
|
<0.001
|
0.733
|
0.665-0.801
|
<0.001
|
<0.001
|
0.694
|
0.613-0.775
|
<0.001
|
| |
N2-N3
|
184
|
<0.001
|
0.764
|
0.676-0.853
|
<0.001
|
<0.001
|
0.797
|
0.691-0.904
|
<0.001
|
|
Metastasis status
|
|
|
|
|
|
|
|
|
|
| |
M0
|
1009
|
<0.001
|
0.764
|
0.721-0.808
|
<0.001
|
<0.001
|
0.737
|
0.677-0.796
|
<0.001
|
| |
M1
|
16
|
0.012
|
0.385
|
0.014-0.755
|
0.545
|
0.200
|
0.537
|
0.221-0.853
|
0.814
|
|
Subtype(PAM50)
|
|
|
|
|
|
|
|
|
|
| |
Normal like
|
129
|
<0.001
|
0.783
|
0.689-0.876
|
<0.001
|
0.025
|
0.735
|
0.618-0.853
|
0.002
|
| |
Luminal-A
|
480
|
<0.001
|
0.744
|
0.673-0.815
|
<0.001
|
<0.001
|
0.698
|
0.594-0.802
|
0.001
|
| |
Luminal-B
|
176
|
<0.001
|
0.692
|
0.561-0.824
|
0.011
|
<0.001
|
0.751
|
0.611-0.891
|
0.008
|
| |
HER2
|
70
|
<0.001
|
0.854
|
0.753-0.955
|
0.001
|
0.006
|
0.851
|
0.712-0.989
|
0.009
|
| |
Basal like
|
170
|
<0.001
|
0.813
|
0.738-0.888
|
<0.001
|
<0.001
|
0.789
|
0.684-0.894
|
<0.001
|
|
ROC, Receiver operating characteristic; AUC, Area under the curve; CI, Confidence Interval.
|
Nomogram development
To apply the 56 pyroptosis-related genes signature in clinical settings, based on the results of univariate and multivariate Cox proportional hazard regression analyses, nomograms were constructed to predict the PFI and DSS of BC patients at 5 and 10 years. Each risk factor corresponds to a designated point determined by drawing a line perpendicular to the point’s axis. The sum of the corresponding risk factor points located on the total points represents the probability of 5- and 10-year PFI or DSS, directly reading straight down to the 5- and 10-year PFI or DSS axis (Figure 9 A, B). And the calibration curves demonstrated that the signature possessed high consistencies in nomogram-predicted and actual in predicting the 5- and 10-year PFI (Figure 9 C, D) or DSS (Figure 9 E, F) rate of BC patients. Our data suggested that the nomograms for PFI and DSS exhibited a well predictive efficacy in 5-, 10-year PFI and DSS probabilities.
Relevance of the 56 pyroptosis-related genes signature in clinical decision-making
Patients were stratified into two groups for the evaluation of AJCC stage by combining AJCC stage I and II ( N =772) into low clinical risk group (marked as C-), and AJCC stage III and IV ( N =253) into high clinical group (marked as C+) for statistical analysis. Combining clinical risk group and gene risk group (low risk group was marked as G-, and high risk group was marked as G+), the total patients were classified into the following four subgroups, G-C- (N =557), G-C+ (N =160), G+C- (N =215), G+C+ (N =93). As expected, KM curves showed that patients in the G-C- subgroup had significantly best prognosis for PFI, DSS, and OS than those in the other subgroups, and worst was G+C+ subgroup (PFI, P < 0.0001; DSS, P < 0.0001; OS, P < 0.0001) (Figure 10 A-C).
To further evaluate the potential of the 56 pyroptosis-related genes signature as a predictor for the response to chemotherapy, the KM analysis was performed in the four subgroups. In the G-C- subgroup, the patients who underwent adjuvant chemotherapy had a significantly better prognosis than those who did not (PFI, P = 0.073; DSS, P = 0.0024; OS, P < 0.0001) (Figure 10 D-F). In the G-C+ and G+C- subgroup, the patients who underwent adjuvant chemotherapy had a significantly better prognosis for OS than those who did not, but not for PFI and DSS (G-C+, PFI, P = 0.34, DSS, P = 0.0089, OS, P = 0.00019; G+C-, PFI, P = 0.17, DSS, P = 0.23, OS, P = 0.02) (Figure 10 G-I, J-L). However, in the G+C+ subgroup, the patients who underwent adjuvant chemotherapy had no statistically better prognosis than those who did not (PFI, P = 0.2, DSS, P = 0.2, OS, P = 0.19) (Figure 10 M-O). These results suggest that the patients in the G-C- subgroup could benefit from adjuvant chemotherapy for PFI, DSS, and OS, while those in the G+C+ subgroup may not, and the patients in the G+C- and G-C+ subgroups could benefit from adjuvant chemotherapy only for OS, but not for PFI and DSS.