3.1. ED visit records selected for analysis
Out of 120,209 ED visits records extracted, 1029 visit records outside of our study period were excluded. Further exclusion of 4072 duplicate records and 12 distorted records left us with 115,096 ED visit records for analysis; pre-COVID-19 period had 61,576 visit records; COVID-19 period had 53,520 visit records (Figure 1). This section may be divided by subheadings. It should provide a concise and precise description of the experimental results, their interpretation, as well as the experimental conclusions that can be drawn.
3.2. Patient demographics and visit characteristics
Table 1 shows the gross reduction in the number of ED visits at SGH across gender, ethnicity, age groups and Singapore citizens during COVID-19 period. Overall, the mean number of daily ED visits (SD) during the COVID-19 period was 297 (31.8), lower than that during the pre-COVID-19 period (342, 44.9). The decline in ED admissions was evident across all ward types except for the infectious disease or isolation wards during the COVID-19 period.
|
Table 1. SGH ED patient characteristics during the pre-COVID-19 period in 2019 and COVID-19 period in 2020.
|
|
Time periods studied
|
Pre-COVID-19 period
|
COVID-19 period
|
% change in ED attendances as compared to Pre-COVID-19 period
|
|
2 Jan – 30 Jun 2019
|
1 Jan – 28 Jun 2020
|
|
Total No. of ED visits
|
61576
|
53520
|
- 8056 (-13.1%)
|
|
Mean ED attendance (SD, range)
|
342 (44.9, 277-427)
|
297 (31.8, 207-445)
|
|
|
Demographics
|
N (%)
|
N (%)
|
|
|
Gender
|
|
|
|
|
Male
|
31707 (51.5%)
|
28942 (54.1%)
|
-2765 (-8.7%)
|
|
Female
|
29869 (48.5%)
|
24578 (45.9%)
|
-5291 (-17.7%)
|
|
Age (year)
|
|
|
|
|
Median (Q1-Q32, range)
|
56 (36-70, 0-106)
|
55 (35-70, 0-105)
|
|
|
0-10
|
386 (0.6%)
|
216 (0.4%)
|
-170 (-44.0%)
|
|
11-14
|
213 (0.3%)
|
108 (0.2%)
|
-105 (-49.3%)
|
|
15-24
|
5172 (8.4%)
|
3970 (7.4%)
|
-1202 (-23.2%)
|
|
25-34
|
8448 (13.7%)
|
8407 (15.7%)
|
-41 (-0.5%)
|
|
35-44
|
7008 (11.4%)
|
6916 (12.9%)
|
-92 (-1.3%)
|
|
45-54
|
7856 (12.8%)
|
6757 (12.6%)
|
-1099 (-14.0%)
|
|
55-64
|
10736 (17.4%)
|
8884 (16.6%)
|
-1852 (-17.3%)
|
|
≥65
|
21757 (35.3%)
|
18261 (34.1%)
|
-3496 (-16.1%)
|
|
Missing
|
0
|
1
|
|
|
Citizenship status
|
|
|
|
|
Singapore Citizen
|
49592 (80.5%)
|
41099 (76.8%)
|
-8493 (-17.1%)
|
|
Non-Citizen
|
11984 (19.5%)
|
12421 (23.2%)
|
+437 (+3.6%)
|
|
Ethnicity
|
|
|
|
|
Chinese
|
39663 (64.4%)
|
33137 (61.9%)
|
-6525 (-16.5%)
|
|
Indian
|
8034 (13.0%)
|
7605 (14.2%)
|
-429 (-5.3%)
|
|
Malay
|
6603 (10.7%)
|
5811 (10.9%)
|
-792 (-12.0%)
|
|
Others
|
7276 (11.8%)
|
6967 (13.0%)
|
-309 (-4.2%)
|
|
Visit Characteristics
|
N (%)
|
N (%)
|
|
|
Mode of arrival
|
|
|
|
|
Non-ambulance
|
52585 (85.4%)
|
43239 (80.8%)
|
-9346 (-17.8%)
|
|
SCDF ambulance
|
6432 (10.4%)
|
7384 (13.8%)
|
+952 (+14.8%)
|
|
Private ambulance
|
2559 (4.2%)
|
2897 (5.4%)
|
+338 (+13.2%)
|
|
Patient acuity category status2
|
|
|
|
|
P1
|
9049 (14.7%)
|
5336 (10.0%)
|
-3713 (-41.0%)
|
|
P2
|
33550 (54.5%)
|
28608 (53.5%)
|
-4942 (-14.7%)
|
|
P3
|
16874 (27.4%)
|
10486 (19.6%)
|
-6388 (-37.9%)
|
|
P4
|
345 (0.6%)
|
138 (0.3%)
|
-207 (-60.0%)
|
|
P1F
|
144 (0.2%)
|
178 (0.3%)
|
+34 (+23.6%)
|
|
P2F
|
714 (1.2%)
|
1138 (2.1%)
|
+424 (+59.4%)
|
|
P3F
|
900 (1.5%)
|
7636 (14.3%)
|
+6736 (+748.4%)
|
|
Disposition
|
|
|
|
|
Admitted from ED
|
25422 (41.3%)
|
23422 (43.8%)
|
-2000 (-7.9%)
|
|
General ward (GW)
|
21958 (86.4%)
|
20000 (85.4%)
|
-1958 (-8.9%)
|
|
High dependency (HD) ward
|
1190 (4.7%)
|
872 (3.7%)
|
-318 (-26.7%)
|
|
Intermediate care area (ICA)
|
387 (1.5%)
|
231 (1.0%)
|
-156 (-40.3%)
|
|
Intensive care unit (ICU)
|
372 (1.5%)
|
302 (1.3%)
|
-70 (-18.8%)
|
|
Infectious Disease (ID)/ Isolation ward
|
857 (3.4%)
|
1891 (8.1%)
|
+1034 (+120.7%)
|
|
Unknown
|
658 (2.6%)
|
126 (0.5%)
|
-532 (-80.9%)
|
|
Not admitted
|
36126 (58.7%)
|
30054 (56.2%)
|
-6072 (-16.8%)
|
|
Missing
|
28
|
44
|
|
1Abbreviations: Q1: First quartile which represents 25th percentile value; Q3: Third quartile which represents 75th percentile value; P1: Priority 1; P1F: Priority 1 Fever; P2: Priority 2; P2F: Priority 2 Fever; P3: Priority 3; P3F: Priority 3 Fever; P4: Priority 4.
3.3. Two-phase ED attendance trend
Within the COVID-19 period, the national tally of daily infected cases started relatively small during the pre-Circuit Breaker period (Figure 2). Thereafter, the tally rocketed to its highest during the Circuit Breaker period. Figure 3 illustrates a two-phase ED attendance trend experienced at SGH ED during the pre-Circuit Breaker period and Circuit Breaker period, respectively.
3.3.1 First phase of ED attendance trend
Approximately one week before DORSCON Orange initiation (2 February – 8 February 2020, Week 6), there was a noticeable drop of 6.4% in weekly ED attendance (2144 vs 2291 baseline) as compared to the same week in 2019 (Figure 3). The initial downward trend in ED attendance was largely driven by the decrease in ‘Non-Fever’ visits. The subsequent sharp returning of ED attendance corresponded with the rising numbers of ‘Fever’ visits, even though the national tally of daily infected cases was relatively low below a hundred (Figure 2). Weekly ED attendance peaked during the last week of March, almost reaching pre-COVID-19 numbers in the same week.
3.3.2 Second phase of ED attendance trend
SGH ED experienced its second fall in attendance where both number of ‘Fever’ and ‘Non-Fever’ visits were declining (Figure 3). The steepest drop occurred during 3 May - 9 May 2020 (Week 19), where a 27.4% dip in ED visits was observed relative to the same week in the pre-COVID-19 period. Unlike the surge in ED attendance and number of ‘Fever’ visits that we observed during pre-Circuit Breaker period (First phase), ED attendance declined even as daily infected cases hit record-breaking numbers during the Circuit Breaker (Second phase) (Figure 2). Nevertheless, as the nation was halfway through Circuit Breaker, we observed a slow and steady climb in SGH ED attendance that was visually distinct from the surge in the first phase (Figure 3). This gradual recovery coincided with the rise in total ‘Non-Fever’ visits and a relatively constant number of ‘Fever’ visits. Following the end of Circuit Breaker and the gradual easing of restrictions for safe resumption of activities, ED attendances continued to show signs of gradual recovery to baseline numbers (Figure 3).
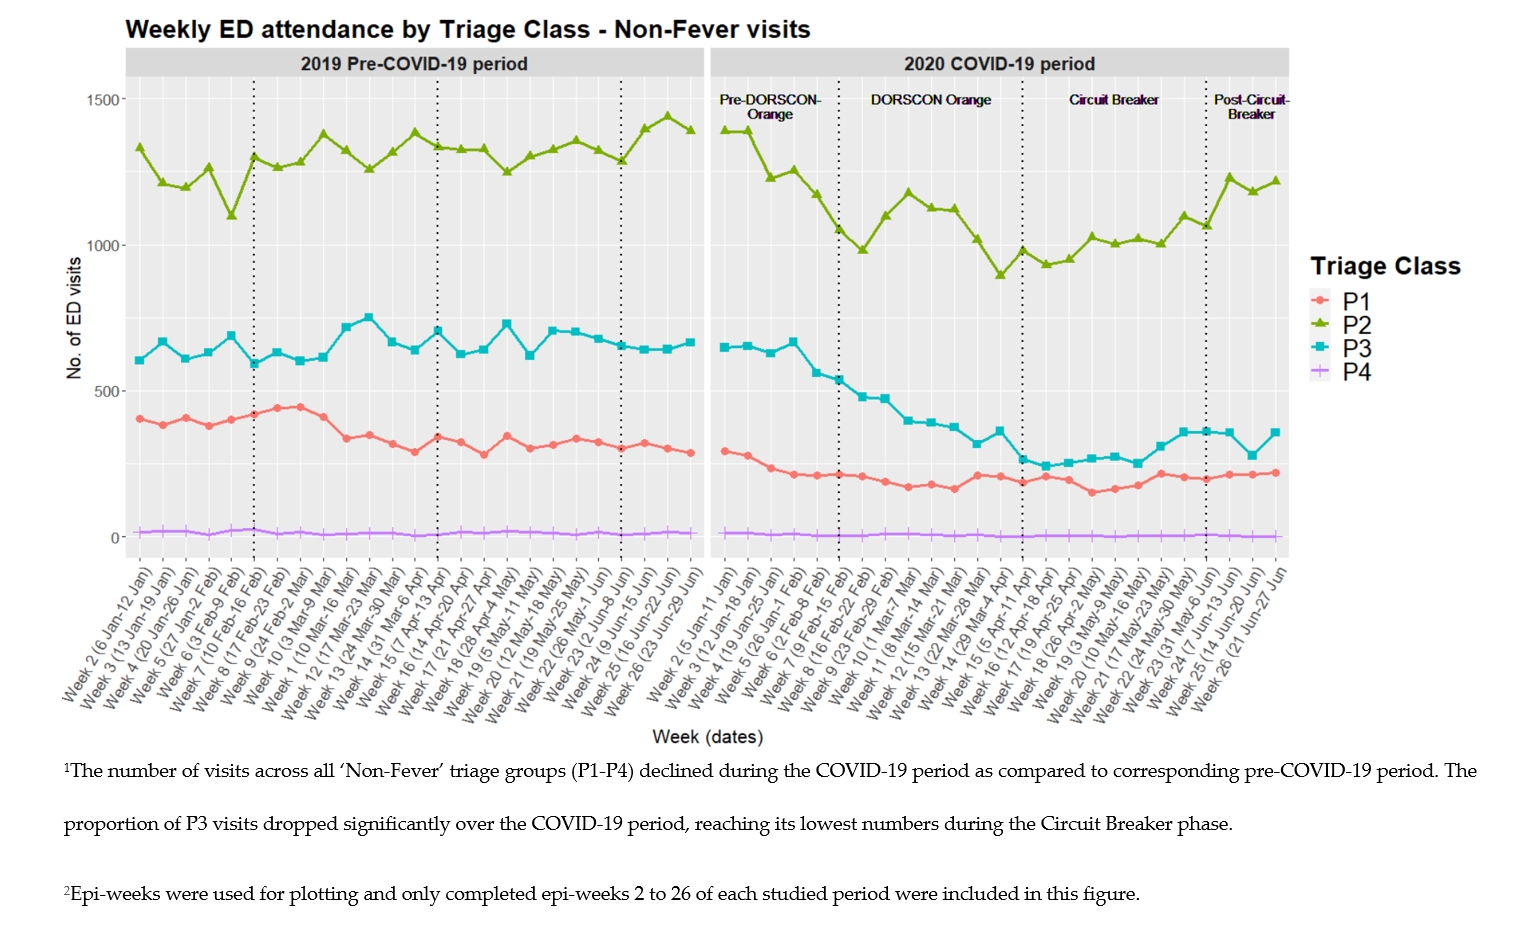
3.4. Sub-group analysis of ED attendance by ‘Non-Fever’ and ‘Fever’ triage categories
There was a decline in ED attendances across all ‘Non-Fever’ triage groups (P1-P4), including the sickest patient group (P1). There were 4.7% and 7.8% reductions in the proportion of P1 visits (10.0% vs 14.7% baseline) and P3 visits (19.6% vs 27.4% baseline), respectively (Table 1, Figure S1, Supplementary Materials). In contrast, there was an increase in ED attendees across all ‘Fever’ triage groups. Of note, there was 8.5 times more (7636 vs 900 baseline) P3F ED visits during the COVID-19 period as compared to the Pre-COVID-19 period.
3.5. Clinical reason for ED attendance
Among 115,096 visit records, we excluded 2545 records (2.2%) with no documentation of diagnosis code in our analysis of diagnoses. The remaining 112,551 visit records had a total of 143,995 documented SNOMED CT diagnosis codes. Out of these, approximately 3000 documented diagnosis codes (2%) were not mapped to ICD-10 categories and these were excluded from our analysis.
The decline in ED attendance was accompanied by decreases in nearly every diagnosis category except for diseases of the respiratory system. The greatest reduction in proportion was seen in the diagnostic category that covers injury, poisoning and certain other consequences of external causes (Table 2). Notably, the decline in P1 visits was accompanied by a drop in presentations of severe diseases such as stroke, acute myocardial infarction, heart failure, appendicitis and paralytic ileus and intestinal obstruction without hernia.
|
Table 2. SGH ED patient characteristics during the pre-COVID-19 period in 2019 and COVID-19 period in 2020.
|
|
Time periods studied
|
Pre-COVID-19 period
|
COVID-19 period
|
% change in frequency as compared to Pre-COVID-19 period
|
|
2 Jan – 30 Jun 2019
|
1 Jan – 28 Jun 2020
|
|
Total No. of ED visits
|
61576
|
53520
|
|
|
No. of ED visits with ≥1 recorded diagnosis
|
60166
|
52385
|
|
|
Total No. of documented diagnoses
|
73545 (100%)
|
67444 (100%)
|
|
|
ICD-10-CM Diagnosis categories
|
N (% total documented diagnoses)
|
N (% total documented diagnoses)
|
|
|
Symptoms, signs and abnormal clinical and laboratory findings, not elsewhere classified
|
19196 (25.5%)
|
16883 (24.5%)
|
-2313 (-12.0%)
|
|
Injury, poisoning and certain other consequences of external causes
|
9358 (12.5%)
|
6779 (9.9%)
|
-2579 (-27.6%)
|
|
Diseases of the musculoskeletal system and connective tissue
|
5932 (7.9%)
|
3995 (5.8%)
|
-1937 (-32.7%)
|
|
Diseases of the circulatory system
|
5810 (7.7%)
|
4723 (6.9%)
|
-1087 (-18.7%)
|
|
Diseases of the respiratory system
|
5594 (7.4%)
|
11842 (17.2%)
|
+6248 (+111.7%)
|
|
Diseases of the digestive system
|
4971 (6.6%)
|
4367 (6.4%)
|
-604 (-12.2%)
|
|
Diseases of the genitourinary system
|
3821 (5.1%)
|
3141 (4.6%)
|
-680 (-17.8%)
|
|
Certain infectious and parasitic diseases
|
3799 (5.1%)
|
3095 (4.5%)
|
-704 (-18.5%)
|
|
Endocrine, nutritional and metabolic diseases
|
2976 (4.0%)
|
2735 (4.0%)
|
-241 (-8.1%)
|
|
Diseases of the skin and subcutaneous tissue
|
2937 (3.9%)
|
2360 (3.4%)
|
-577 (-19.6%)
|
|
Diseases of the eye and adnexa
|
2493 (3.3%)
|
1805 (2.6%)
|
-688 (-27.6%)
|
|
Diseases of the nervous system
|
1265 (1.7%)
|
1074 (1.6%)
|
-191 (-15.1%)
|
|
Neoplasms
|
1227 (1.6%)
|
1069 (1.6%)
|
-158 (-12.9%)
|
|
Mental, Behavioral and Neurodevelopmental disorders
|
1012 (1.3%)
|
899 (1.3%)
|
-113 (-11.2%)
|
|
Diseases of the blood and blood-forming organs and certain disorders involving the immune mechanism
|
943 (1.3%)
|
860 (1.2%)
|
-83 (-8.8%)
|
|
External causes of morbidity
|
699 (0.9%)
|
636 (0.9%)
|
-63 (-9.0%)
|
|
Diseases of the ear and mastoid process
|
640 (0.9%)
|
537 (0.8%)
|
-103 (-16.1%)
|
|
Factors influencing health status and contact with health services
|
557 (0.7%)
|
405 (0.6%)
|
-152 (-27.3%)
|
|
Pregnancy, childbirth and the puerperium
|
220 (0.3%)
|
174 (0.3%)
|
-46 (-20.9%)
|
|
Congenital malformations, deformations and chromosomal abnormalities
|
62 (0.1%)
|
36 (0.1%)
|
-26 (-41.9%)
|
|
Certain conditions originating in the perinatal period
|
33 (0.0%)
|
29 (0.0%)
|
-4 (-12.1%)
|
|
|
|
|
|
|
Total No. of P1 visits
|
9049
|
5336
|
|
|
No. of P1 visits with ≥1 recorded diagnosis
|
9012
|
5313
|
|
|
Total No. of recorded diagnoses
|
11510 (100%)
|
7519 (100%)
|
|
|
ICD-10-CM Diagnosis categories
|
N (% total documented diagnoses)
|
N (% total documented diagnoses)
|
|
|
Severe diseases
|
|
|
|
|
Stroke
|
704 (6.1%)
|
516 (6.9%)
|
-188 (-26.7%)
|
|
Acute myocardial infarction
|
508 (4.4%)
|
440 (5.9%)
|
-68 (-13.4%)
|
|
ST elevation (STEMI) myocardial infarction
|
226 (2.0%)
|
187 (2.5%)
|
-39 (-17.3%)
|
|
Non-STEMI (NSTEMI)
|
282 (2.5%)
|
253 (3.4%)
|
-29 (-10.3%)
|
|
Other acute ischemic heart diseases
|
109 (0.9%)
|
95 (1.3%)
|
-14 (-12.8%)
|
|
Heart failure
|
337 (2.9%)
|
231 (3.1%)
|
-106 (-31.5%)
|
|
Cardiac arrest
|
92 (0.8%)
|
102 (1.4%)
|
+10 +(10.9%)
|
|
Paralytic ileus and intestinal obstruction without hernia
|
337 (2.9%)
|
277 (3.7%)
|
-60 (-17.8%)
|
|
Appendicitis
|
173 (1.5%)
|
157 (2.1%)
|
-16 (-9.2%)
|
1Abbreviations: ICD-10-CM: International Classification of Diseases, Tenth Revision, Clinical Modification