This study is a hospital-based cross-sectional case-controlled study. A total of 157 RA patients had attended the Rheumatology outpatient Clinic of Sohag University Hospitals. In addition to 49 age-, sex-matched healthy subjects served as normal controls. The study protocol was approved by the ethical committee of Medical Research Ethics Committee of Sohag Faculty of Medicine IRB: Soh-Med-21-11-31. In adherence to the Helsinki Principles, informed consent was obtained from all participants.
Diagnosis of RA was based on the criteria established in 2010 by the American College of Rheumatology/European League Against Rheumatism Collaborative Initiative [2]. RA patients with different degrees of disease activity were included. Patients suffering from associated other inflammatory or autoimmune diseases were excluded from the study.
Cases with RA were defined based on the physician's decision, the type and side of articular involvement, rheumatoid factor (RF) and anti-CCP positivity, symptom duration, radiologic findings, and acute phase reactants.
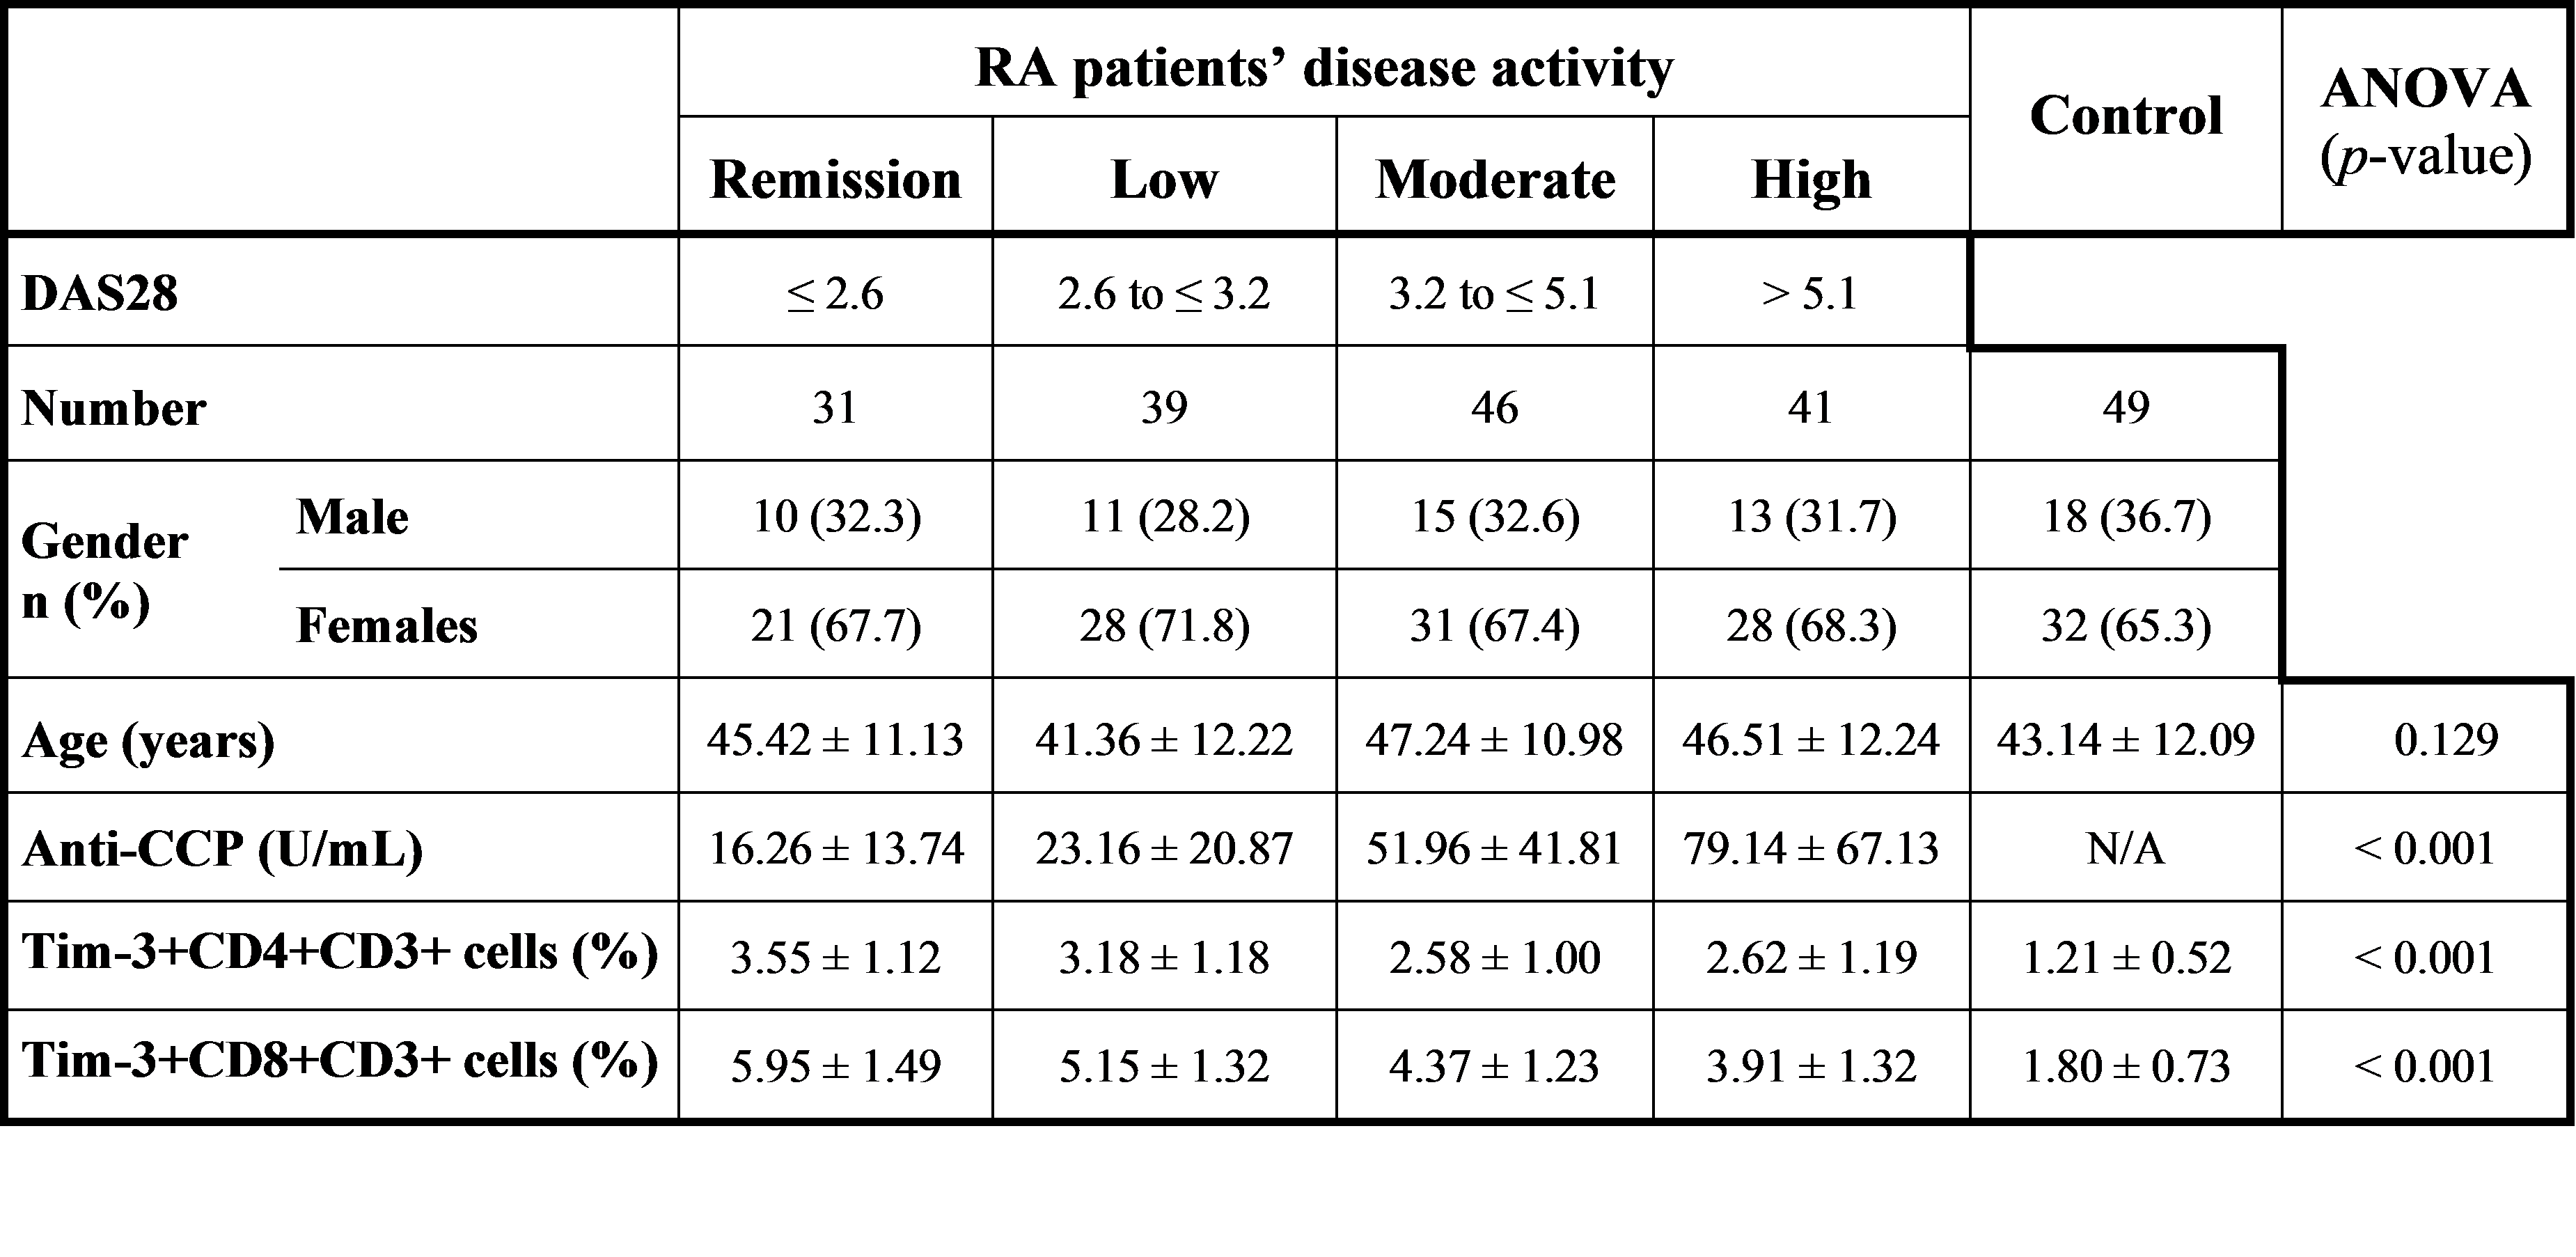
At the time of venipuncture, assessment of RA disease activity was done using the disease activity score (DAS28) based on joint tenderness counts (0–28), joint swelling counts (0–28), and erythrocyte sedimentation rate (ESR) and calculated from the website (www.das-score.nl) [13]. According to DAS28, patients were divided into 4 groups: remission (DAS28 ≤ 2.6), low (DAS28 > 2.6 and ≤ 3.2), moderate (DAS28 > 3.2 and ≤ 5.1), and high RA disease activity (DAS28 > 5.1) groups [14].
Sample Collection
For each subject, a 10 ml venous blood sample was collected and divided into 3 tubes. The first tube contains EDTA (Ethylenediaminetetraacetic acid) for complete blood count and ESR testing using the conventional Westergren method. The second tube also contains EDTA for flow cytometric assay. A third plain tube was used where blood was allowed to clot and centrifuged at 3000 RPM for 10 min to obtain serum for determination and anti-CCP antibody test.
Flow Cytometry
Specimen processing
the collected EDTA blood was layered in a 20 ml sterile tube on the top of an equal volume of density gradient LymphoprepTM (Ficoll-Hypaque) (Biosera, Nile, France) for isolation of peripheral blood mononuclear cells (PBMCs) by centrifugation at 400×g for 30 minutes at 20 ºC without brake, to ensure separation of the PBMCs from the denser Ficoll/erythrocyte layer below, and the less dense dilute plasma layer above. After centrifugation, the isolated PBMCs were washed 2 times and resuspended in phosphate-buffered saline (PBS) containing 2% fetal bovine serum.
Labeled monoclonal antibodies
antihuman monoclonal antibodies (mAbs) labeled with fluorochrome were used, including phycoerythrin/Cyanine 5 (PE/Cy5) anti-CD3 (BD), fluorescein isothiocyanate (FITC)-labeled anti-CD4 (BD), peridinin-chlorophyll-protein (PerCP)-labeled anti-CD8 (BD), and phycoerythrin (PE)-labeled anti-Tim-3 (Abcam-Cambridge, MA-USA). Isotype-matched control antibodies included Cy5-, FITC-, PerCP-, and PE-conjugated rat antibodies were used to subtract the background staining control.
Procedure
Briefly, 100 µL PBMC suspension to Eppendorf tubes was placed on ice, and 5 µL of each monoclonal antibody was added to each tube, placed at 4°C, kept away from light for 30 minutes. After 2 times of PBS washing, 0.4 ml PBS containing 1% serum was added to re-suspend cells and transferred to the flow tube. Data acquisition and analysis were performed by Becton Dickinson FACScalibur™ flow cytometry with (BD Biosciences, San Jose, CA, USA). The labeled cells were analyzed, a maximum of 30,000 events was acquired, and CellQuest software (v5.2) was used for data acquisition and analysis (BD Biosciences, San Diego, CA, USA). For compensation analysis, the spillover amount of each fluorochrome into other channels was determined and subtracted.
Flow cytometric analysis (Fig. 1)
after the acquisition, cells were first gated on forward (FSC) and side scatter (SSC) properties, i.e., size and granularity; to select lymphocyte population, then the expression of CD4 and CD8 on the gated cells was tested to characterize CD4 + CD3 + and CD8 + CD3 + cell populations. Then for each cell population, the percentage of Tim-3 + expression was assessed.
Statistical analysis
Statistical analysis was performed using SPSS (version 24.0, IBM, New York, USA). After testing the normality of the data by the Kolmogorov-Smirnov test, data were statistically described in terms of mean and SD for quantitative data. One-way ANOVA test was appropriately used for comparison between the studied groups. The Pearson correlation was used to determine the correlations between Tim-3 + CD4 + CD3 + and Tim-3 + CD8 + CD3 + cells, Tim-3 + CD4 + CD3 + cells and DAS28, Tim-3 + CD8 + CD3 + cells and DAS28, Tim-3 + CD4 + CD3 + cells and serum-anti-CCP levels, and finally, Tim-3 + CD8 + CD3 + cells and serum-anti-CCP levels. A p-value of < 0.05 was considered significant.