Identification of cotton GAUT genes
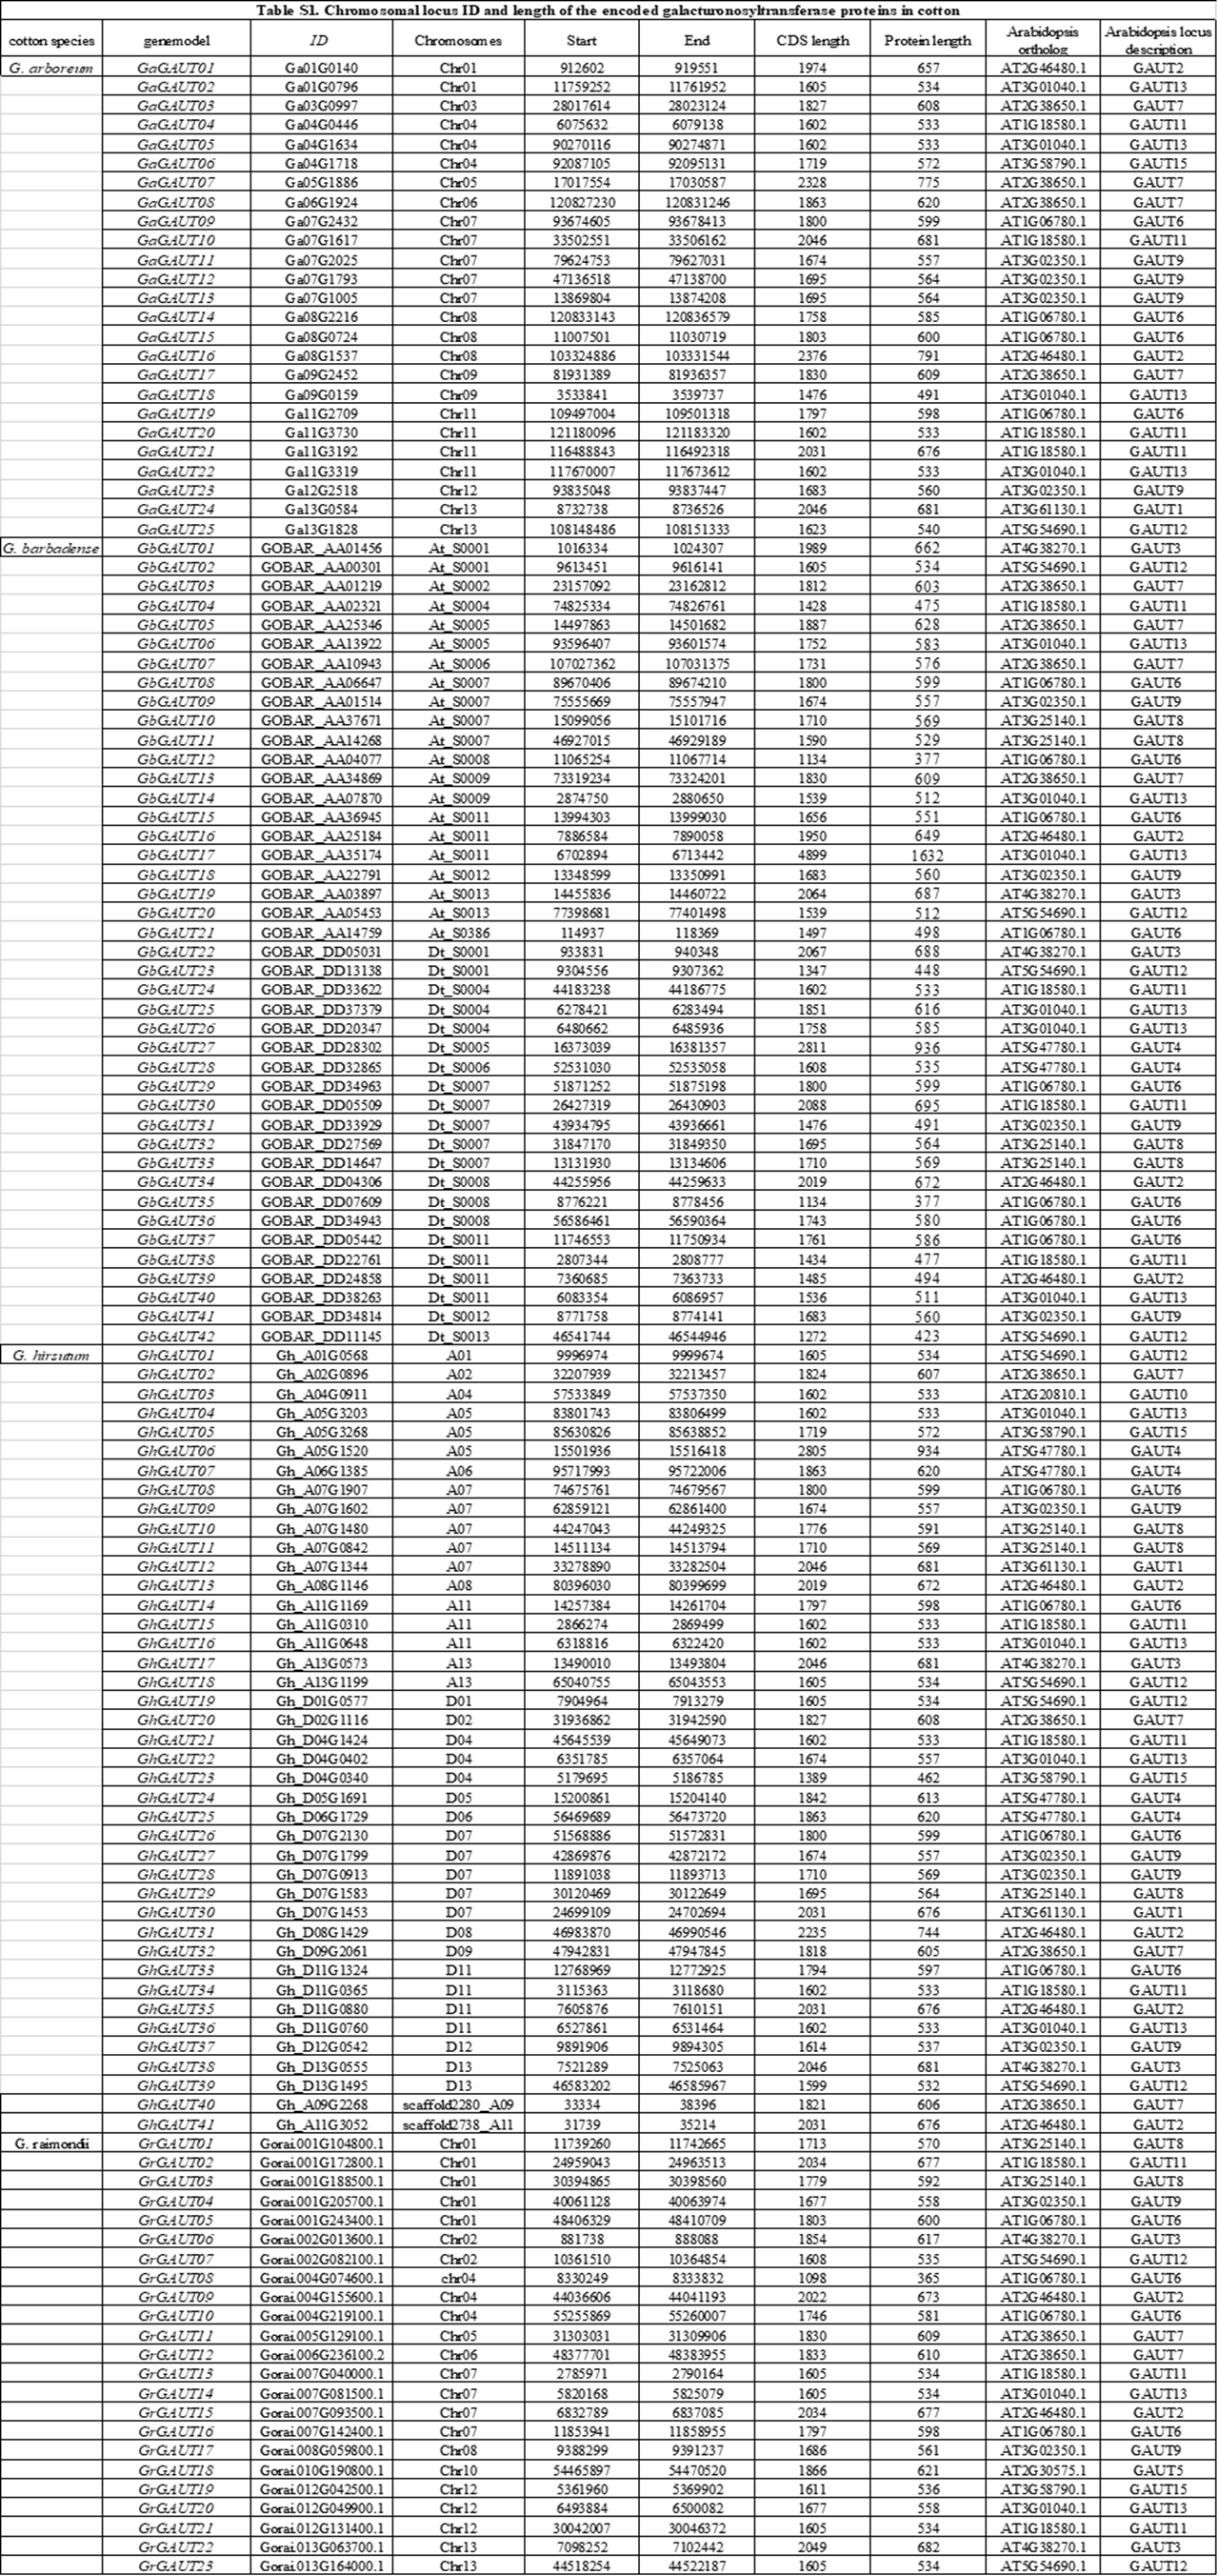
Detailed phylogenetic analyses have devided GT8 proteins into two distantly related clades: 1) the GAUT1 (galacturonosyltransferase1)-related family, including the GAUT and GATL proteins, known as galacturonosyltransferase proteins, 2) a group including plant glycogen protein-like starch starters (PGSIPs) and galactitol synthases (GolSs) (Yin et al. 2018). According to the Pfam database and a bioinformatics analysis, all inferred proteins have a Glyco_transf_8-like domain (PF01501), which indicates that the corresponding genes belong to the GAUT gene family (Kikuchi et al. 2003). To identify the GAUT gene in Gossypium species, we identified 187 GAUT genes from eight Gossypium species (Fig S1), including 131 genes from the following cotton species: G. hirsutum (41 genes), G. barbadense (42 genes), G. arboreum (25 genes) and G. raimondii (23 genes) (Additional file 3). The length range of coding regions in the GAUT gene family ranged from 1,098 to 4,899 bp, and the encoded proteins comprised of 365 to 1,632 amino acids. The length of 32 GAUT genes was less than 3,000 bp; 88 had lengths of 3,000 to 7,000 bp, while the remaining 11 were longer than 7,000 bp (Fig S2: Table S1).
Phylogenetic analysis and classification of the cotton GAUT gene family in cotton
Using published genome sequencing data for eight species, we determined the phylogenetic relationships of GAUT gene family members from multiple species. In a previous study (Sterling et al. 2006), three types of gene sequences, GAUT-A, GAUT-B, and GAUT-C, were found by multiple sequence alignment of the 187 GAUT genes of these eight species to Arabidopsis homologs (Fig 1a). In the present study, we analyzed the GAUT genes of four cotton species, thereby classifying 62 genes into GAUT-A, 38 into GAUT-B, and 31 into GAUT-C (Fig 1b). In addition, GAUT6 had the largest number of homologs, 20, in Gossypium species, and GhA07G1907, identified in a previous transcriptome analysis (Zou et al. 2019), was assigned to GAUT6. We found 16 GAUT13 homologs, 14 homologs each of GAUT7, GAUT9, and GAUT11, and 11 homologs each of GAUT2 and GAUT12. The remaining genes had fewer than 10 homologs. No genes homologous to GAUT14 were detected in any of the four cotton species, and no GAUT5 homologs were identified in G. hirsutum. Only one homolog each of GAUT5 and GAUT10 were detected, namely, GrGAUT18 and GhGAUT03, respectively. Four homologs each of GAUT2, 4, 6, 7, 9, 12, and 13, three homologs each of GAUT8 and GAUT 11, and two homologs each of GAUT-A genes GAUT1 and GAUT3 were discovered in G. hirsutum.
Analysis of conserved motif and GAUT gene structures
The following motif is conserved in 15 Arabidopsis GAUT genes and their orthologues in cotton: H-DN-A-SVV-S-V-H-T-F (H-x(2)-[ILV]-x-[ST]-D-N-[IV]-[IL]-A-[ASTV]-S-V-V-[AIV]-x-S-x-[AIV]-x(2)-[AS]-x(2)-[PS]-x(3)-V-[FL]-H-[ILV]-[ILV]-T-[DN]-x (2)-[NST]-x (2)-[AGP]-[IM]-x (3)-F) (Sterling et al. 2006). The GAUT gene family encodes a protein with a molecular mass between 61 and 78 kDa (Sterling et al. 2006; Godoy et al. 2013). Consistent with topological predictions, most GAUT genes can encode a type II membrane protein containing a putative transmemberance domain in its hypervariable N-terminal region (Reithmeier et al. 1992). Among the GAUT proteins analyzed in our study, three GAUT proteins (GAUT 3, 4, and 5) which belonging to GAUT-A contained an N-terminal signal peptide rather than a transmemberance domain. The only GAUT gene family members predicted to have no N-terminal transmemberance domain or signal peptide in cotton were GAUT2 genes (Fig 2b). We also found some GAUT1, GAUT3 and GAUT11 genes with the above characteristics. Among 14 GAUT7 genes belonging to group GAUT-A in eight Gossypium species (Fig S2: Table S1), 10 contained the same conserved as PLN02769 domain (Fig 2b), which was assigned to the the category of “Probable Galacturonosyltransferase” (https://www.ncbi.nlm.nih.gov/proteinclusters/?term=PLN02769). The remaining GAUT family members contained a conserved Glyco_transf_8 domain. The prediction motifs of each member are shown in Fig 2C, and specific structural information is given in Fig S3.
Analysis of collinearity and repeating elements in the GAUT gene
According to the results of MCScan analysis, there were no tandem repeat elements were present in the GAUT gene family in Gossypium. In G. hirsutum, GhGAUT01 and GhGAUT19, GhGAUT15 and GhGAUT34, GhGAUT16 and GhGAUT36, GhGAUT17 and GhGAUT38, and GhGAUT18 and GhGAUT39 were homologous to the GAUT 3, GAUT 11, GAUT 12, and GAUT 13 respectively, and were also segment repeats. Genes in diploid Gossypium species corresponding to the above repeated genes are shown in Fig 3. According to their relative order in Gossypium, GAUT genes were categorized into five groups (1 to 5). With the exception of group 4, which belonged to GAUT-A, all groups were members of GAUT-C.
Analysis of GAUT expression patterns
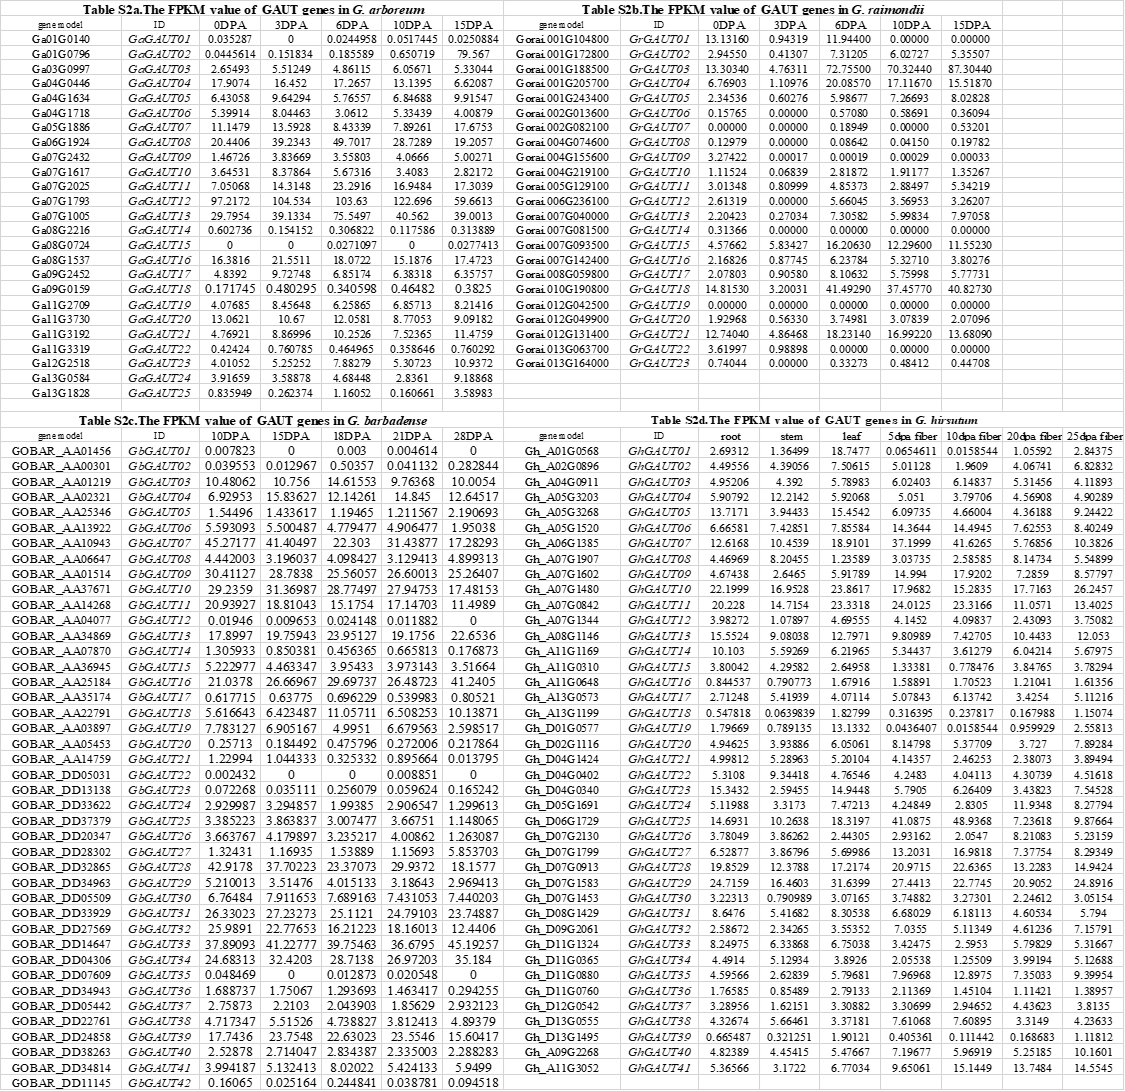
As determined by collinearity and repetitive element analyses of the above homologous genes in combination with transcriptome data from different fiber developmental stages of diploid species, GaGAUT02 had the highest expression at 15DPA but almost no expression during other periods. The other members of group 1 (Fig 3) were also barely expressed in G. raimondii and tetraploid cotton, with fragments per kilobase of transcript per million fragments mapped (FPKM) values of less than 2.0. In group 2, GhGAUT15 and GhGAUT34 had the highest expressions during the late stage (20 to 25DPA) of fiber development (Fig 4). Group 3 members GhGAUT16, GhGAUT36, GrGAUT14, and GaGAUT22 were not expressed at all during the fiber developmental period. Among group 4 genes, GhGAUT17 and GhGAUT38 had their highest expression during fiber developmental from 5 to 10 DPA, and GrGAUT22 and GaGAUT24 had the expression peaks at 0 and 15 DPA, respectively. All members of group 5 except for GaGAUT25 were expressed at 15 DPA, and the remaining genes had almost no expression during fiber development. In four cotton specie, six genes had peak FPKM values greater than 40, namely GaGAUT08, GaGAUT12, GaGAUT13, GrGAUT03, GrGAUT18, and GhGAUT25. The expressions peaks of these six genes all occurred before 15 DPA, which suggests that the GAUT gene family play a role in early cotton fiber development.
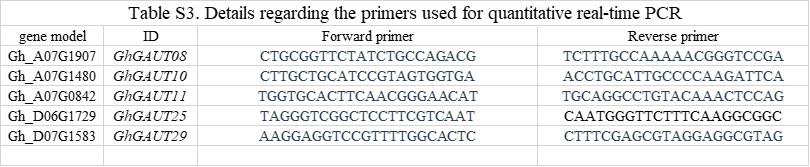
We selected a RIL population containing high-strength fiber and low-strength fiber lines for quantitative real time polymerase chain reaction (qRT-PCR) analysis (Wang et al. 2014). For this analysis, we selected GhGAUT08 (Gh_A07G1907) (Zou et al. 2019) and GhGAUT25, both belonging to GAUT-A and GhGAUT10, GhGAUT11, and GhGAUT29 belonging to GAUT-B and having FPKM values greater than 10 (Fig S4: Table S2). The qRT-PCR analysis revealed that the GAUT gene family has an important influence on fiber development before 15 DPA. From 5 to 30 DPA, the overall expressions of GhGAUT08 and GhGAUT10 were higher in high-strength materials than in low-strength materials. At 5 DPA, the expressions of GhGAUT11 and GhGAUT29 were higher in low-strength materials than in high-strength materials, with the opposite true from 10 to 30 DPA. GhGAUT25 expression was higher in low-strength materials than high-strength materials from 5 to 10 DPA, with the reverse pattern observed after 15DPA. In six high-strength materials, peak GAUT expression was from 10 to 15 DPA (Fig 5), whereas the period of highest expression in six low-strength materials was 5 to 10 DPA (Fig 5).
The GAUT gene family affect the synthesis of pectin, we measured the pectin content of different materials. The results showed that the peak pectin content of high-strength fiber materials appeared at 15DPA, while the low-strength materials appeared at 10DPA (Fig 6). This result was similar to the description of gene expressions.
Prediction of cis-elements in GAUT genes promoter regions
To investigate the potential reasons for different expression patterns among GAUT genes, we analyzed the promoter elements of the GAUT gene family in upland cotton. This analysis was performed because cis-elements (Fig 7) can affect gene expression regulation (Higo et al. 1999). We analyzed 32 cis-elements in upland cotton genes, namely, elements responsive to anaerobic conditions, different hormones (Me-JA, GA, SA, ABA and IAA), and abiotic stress conditions, including drought, low temperature and other stress conditions. CGTCA and TGACG motifs are associated with responsiveness to methyl jasmonate (Me-JA) (Basyuni et al. 2018), while the GARE-motif (TCTGTTG) and P-box (CCTTTTG) are related to gibberellin (GA) (Porto et al. 2014). The TCA-element (CCATCTTTTT) is a salicylic acid (SA) responsive element (Herrera et al. 2015). AuxRR-core (GGTCCAT) and the TGA-element (AACGAC) are related to the responsiveness to auxin (Herrera et al. 2015), and the ABRE-motif (ACGTG) is associated with the abscisic acid (ABA) response (Mishra et al. 2014). The ARE-motif (AAACCA) is related to the anaerobic environment, while the LTR-motif (CCGAAA) participates in response to low temperature (Chen et al. 2018). Finally, the TC-rich repeats (ATTCTCTAAC) is the response element associated with stress (Wei et al. 2009). In future work, we plan to further verify the regulation of the above hormones on the GAUT gene family in upland cotton.
Expression analysis of prominent fiber-expressed genes under abiotic stress and phytohormone treatments
For a more in-depth study of GhGAUTs expression levels induced by abiotic stress, the expression patterns of four GhGAUT genes after NaCl, PEG, abscisic acid (ABA), naphthylacetic acid (NAA), salicylic acid (SA), and methyl jasmonate (MeJA) treatment were analyzed by qRT-PCR (Fig 8). We examined the effects of various hormones on the expression of the five GhGAUT genes. We observed that within 1 hour after all treatments, the relative expression levels of these five genes were rapidly increased and decreased after 24 hours. The peak of the up-regulation response were between 3 hours and 12 hours, except for GhGAUT11. GhGAUT11 did not respond to the treatment of the three hormones for ABA, SA, and MeJA. GhGAUT29 responds to all stress and hormone treatments, and the detected expression level was higher; GhGAUT08 responded to ABA and SA treatment with the higher expression levels. GhGAUT25 also responded to two stresses and four hormone treatments, but the expression levels were the highest under the treatment of PEG and ABA, and the response peaks were at 6h and 12h, respectively. GhGAUT10 also responded to the treatment of ABA, SA, and MeJA, with the peak expression level at 6h, 12h, and 12h; the response level to NACl, PEG and NAA treatment was low, with slight response at 3h and 6h, respectively. The level was low. These results indicated that after different hormone treatments, different genes had different response times and response patterns, which were closely related to their hormone response elements and expression patterns.