3.1 Morphological characterization
Under the fluorescence microscope, the particle size distribution of the microspheres was randomly selected to observe and calculate the size distribution of the microspheres, as shownin Fig. 1a. The particle size distribution is 20–145µm with average particle size 74µm. It shows a positive skew distribution, indicating that the magnetic microspheres have a wide particle size distribution. After photopolymerization, magnetic microspheres of different sizes can be further separated by classification and screening, which can occlude blood vessels of different calibers and flows to meet the needs of vascular embolization in different parts.
3.2 Spectral and thermal analysis
The TG curves of nano-Fe3O4, PDAIP microspheres and Fe3O4@PDAIP magnetic microspheres were measured. Figure 1b shows that nano-ferric oxide can remain stable without mass loss from 50 to 800oC. The microspheres loaded with or without nano-ferric oxide began to decompose at about 400oC, but the final residual mass of the magnetic microspheres indicated that the samples was loaded with 10wt% of ferric oxide higher the reactant ratio 4wt%. The fluctuation in loading might be attributed to the inevitable aggregation of magnetic nano-Fe3O4, or unreactive monomers lost.
The IR spectra of nano-Fe3O4, PDAIP and Fe3O4@PDAIP magnetic microspheres are shown in Fig. 1c. It shows that the peak of Fe3O4 at 586cm− 1 and the increase in absorbance of Fe3O4@PDAIP magnetic microsphere around 580cm− 1 is attributed to the Fe-O bond[35], which indicates that Fe3O4 was successfully doped in Fe3O4@PDAIP magnetic microspheres. Peak 1729cm− 1 is related to the C = O stretching vibration of the ester bond. It can be seen that the magnetic microspheres were successfully synthesized from DAIP monomer.
3.3 SEM-EDS analysis
The SEM images of the microsphere are shown in Fig. 1d. Spectral scan in a randomly selected area of microspheres in the Fig. 1e was used for elemental analysis. The results shown in Fig. 1f indicated the presence of three elements, carbon, oxygen, iron, in the microspheres, in line with the expected composition.
3.4 Magnetic test
The magnetic microspheres in the water are randomly dispersed in the water without or with a magnetic field (Fig. 2a), and under the action of magnetic field, they obviously accumulated in the direction of the magnetic field. VSM magnetic strength curve (Fig. 2b) showed that Fe3O4 did not lose magnetism after photopolymerization, which suggested that the Fe3O4@PDAIP had favorable magnetic response.
3.5 Thermal effect of Fe3O4@PDAIP magnetic microspheres and MRI/CT/DSA imaging
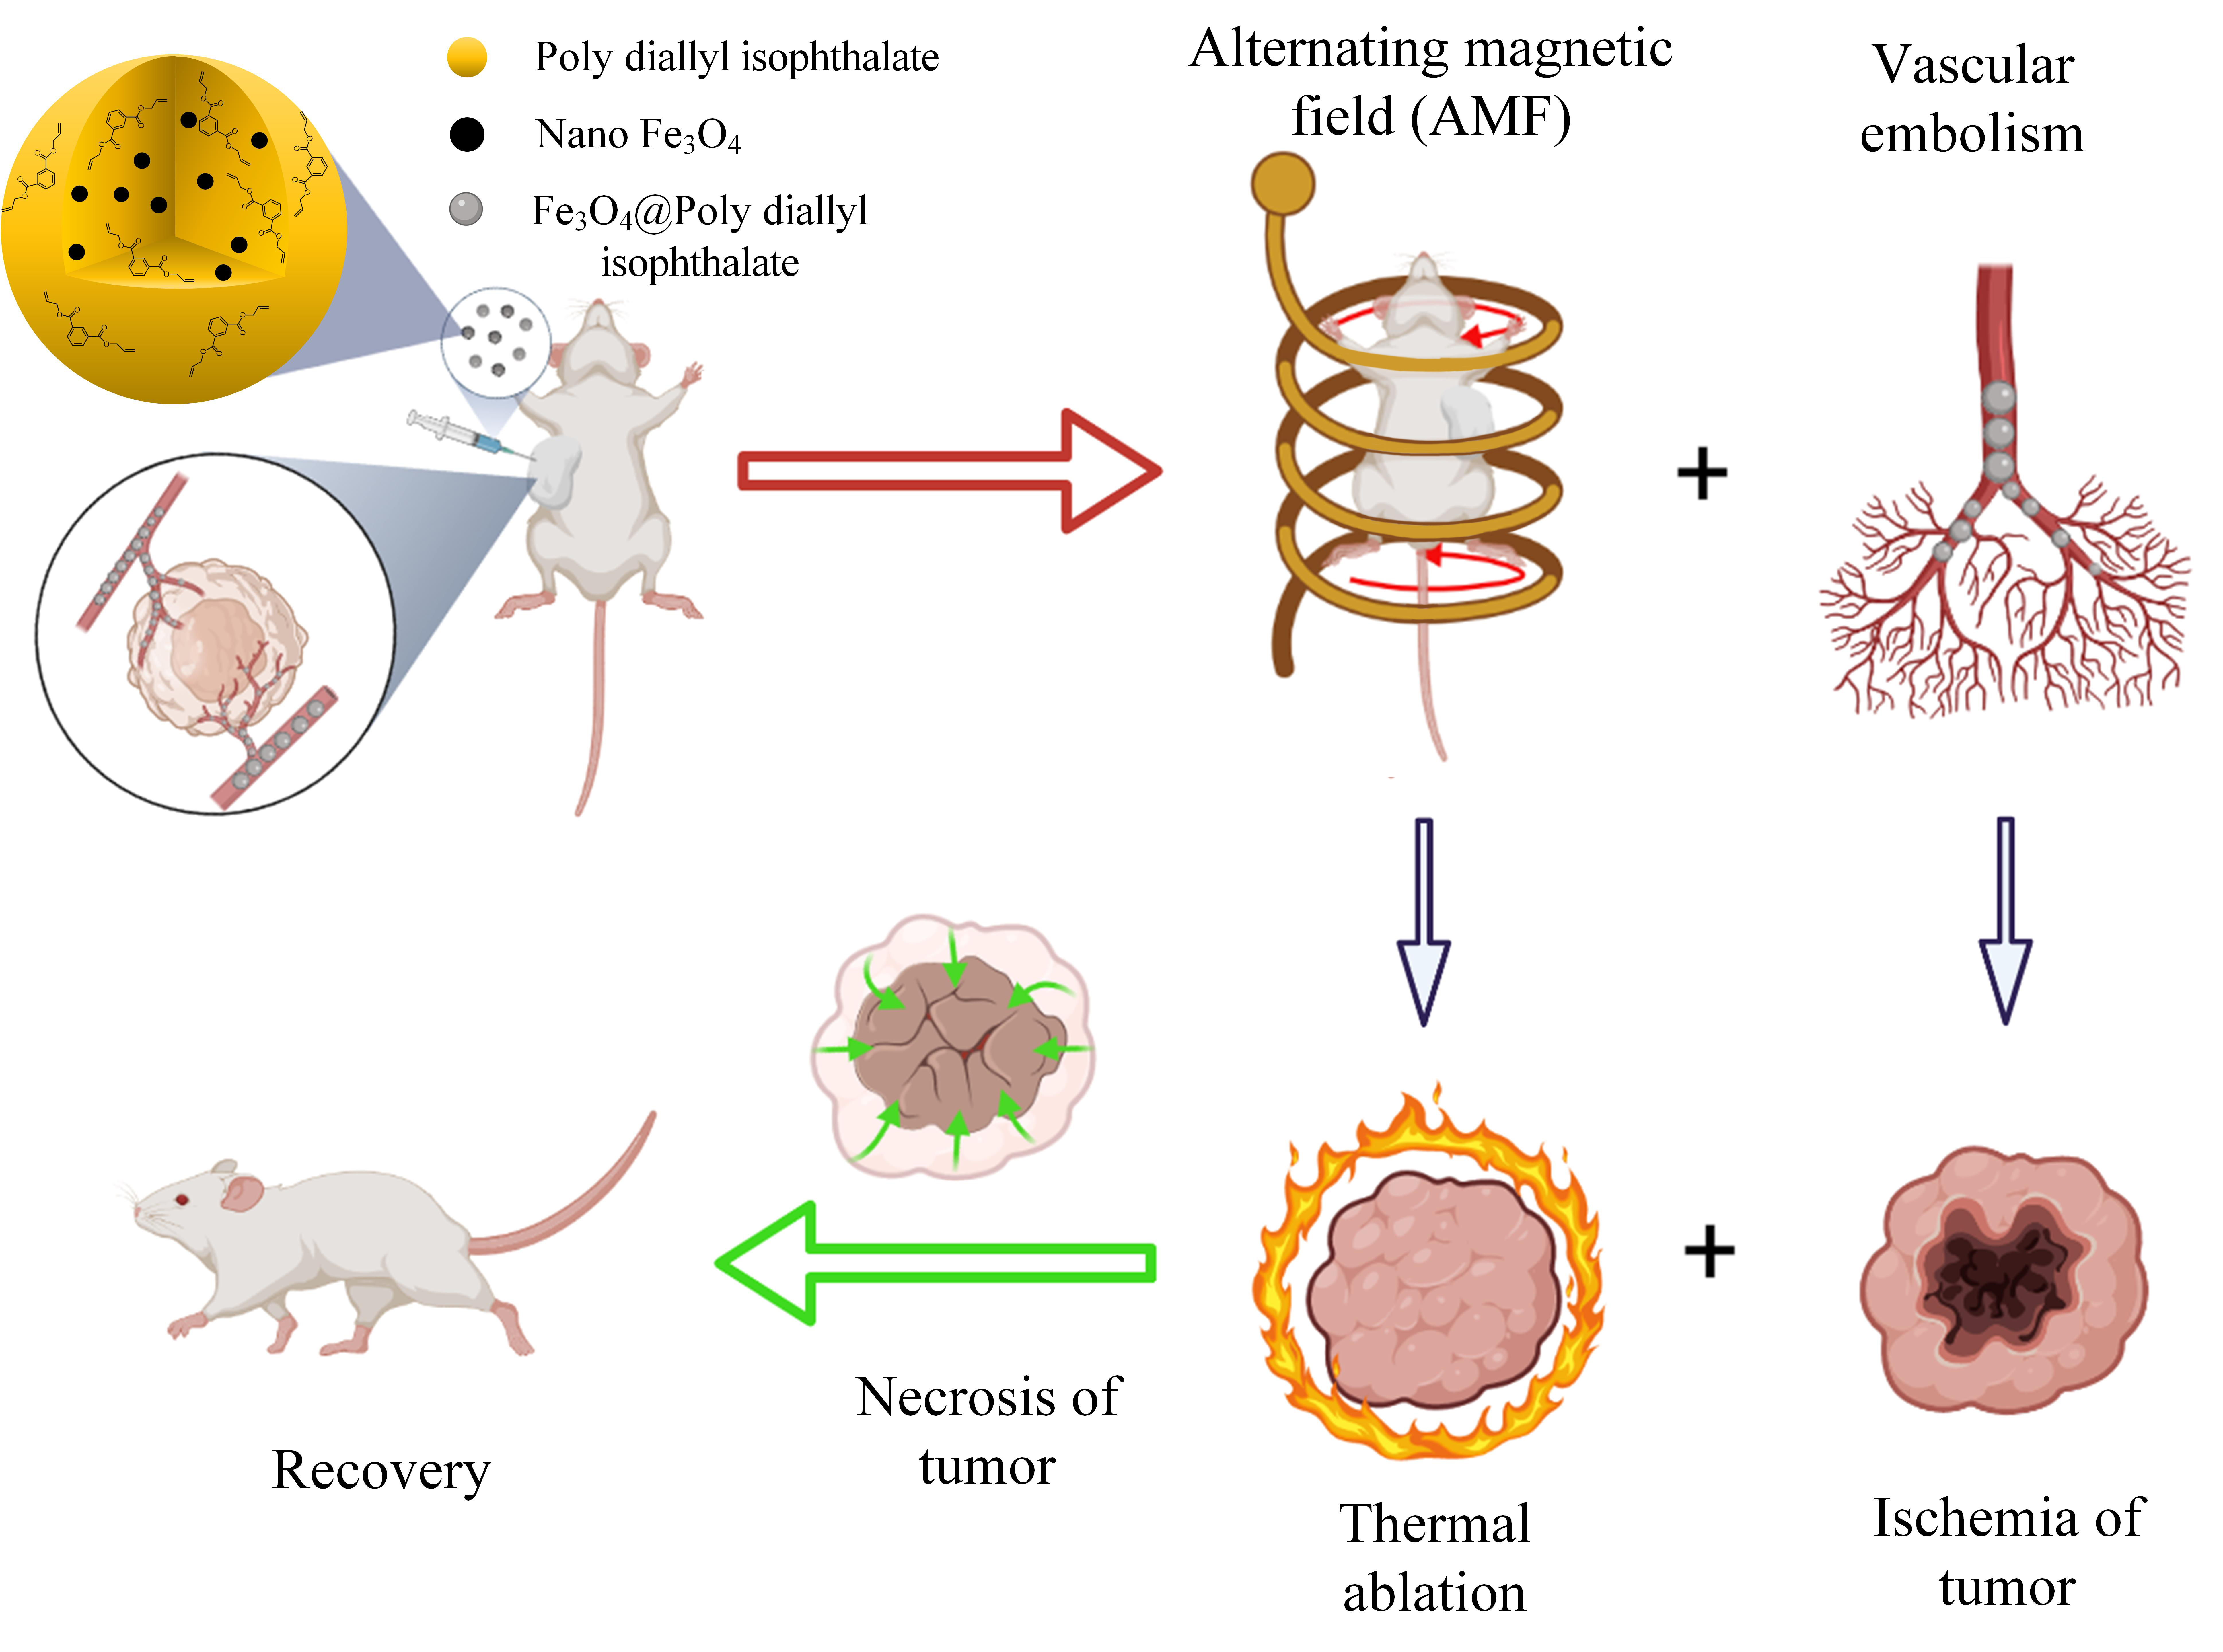
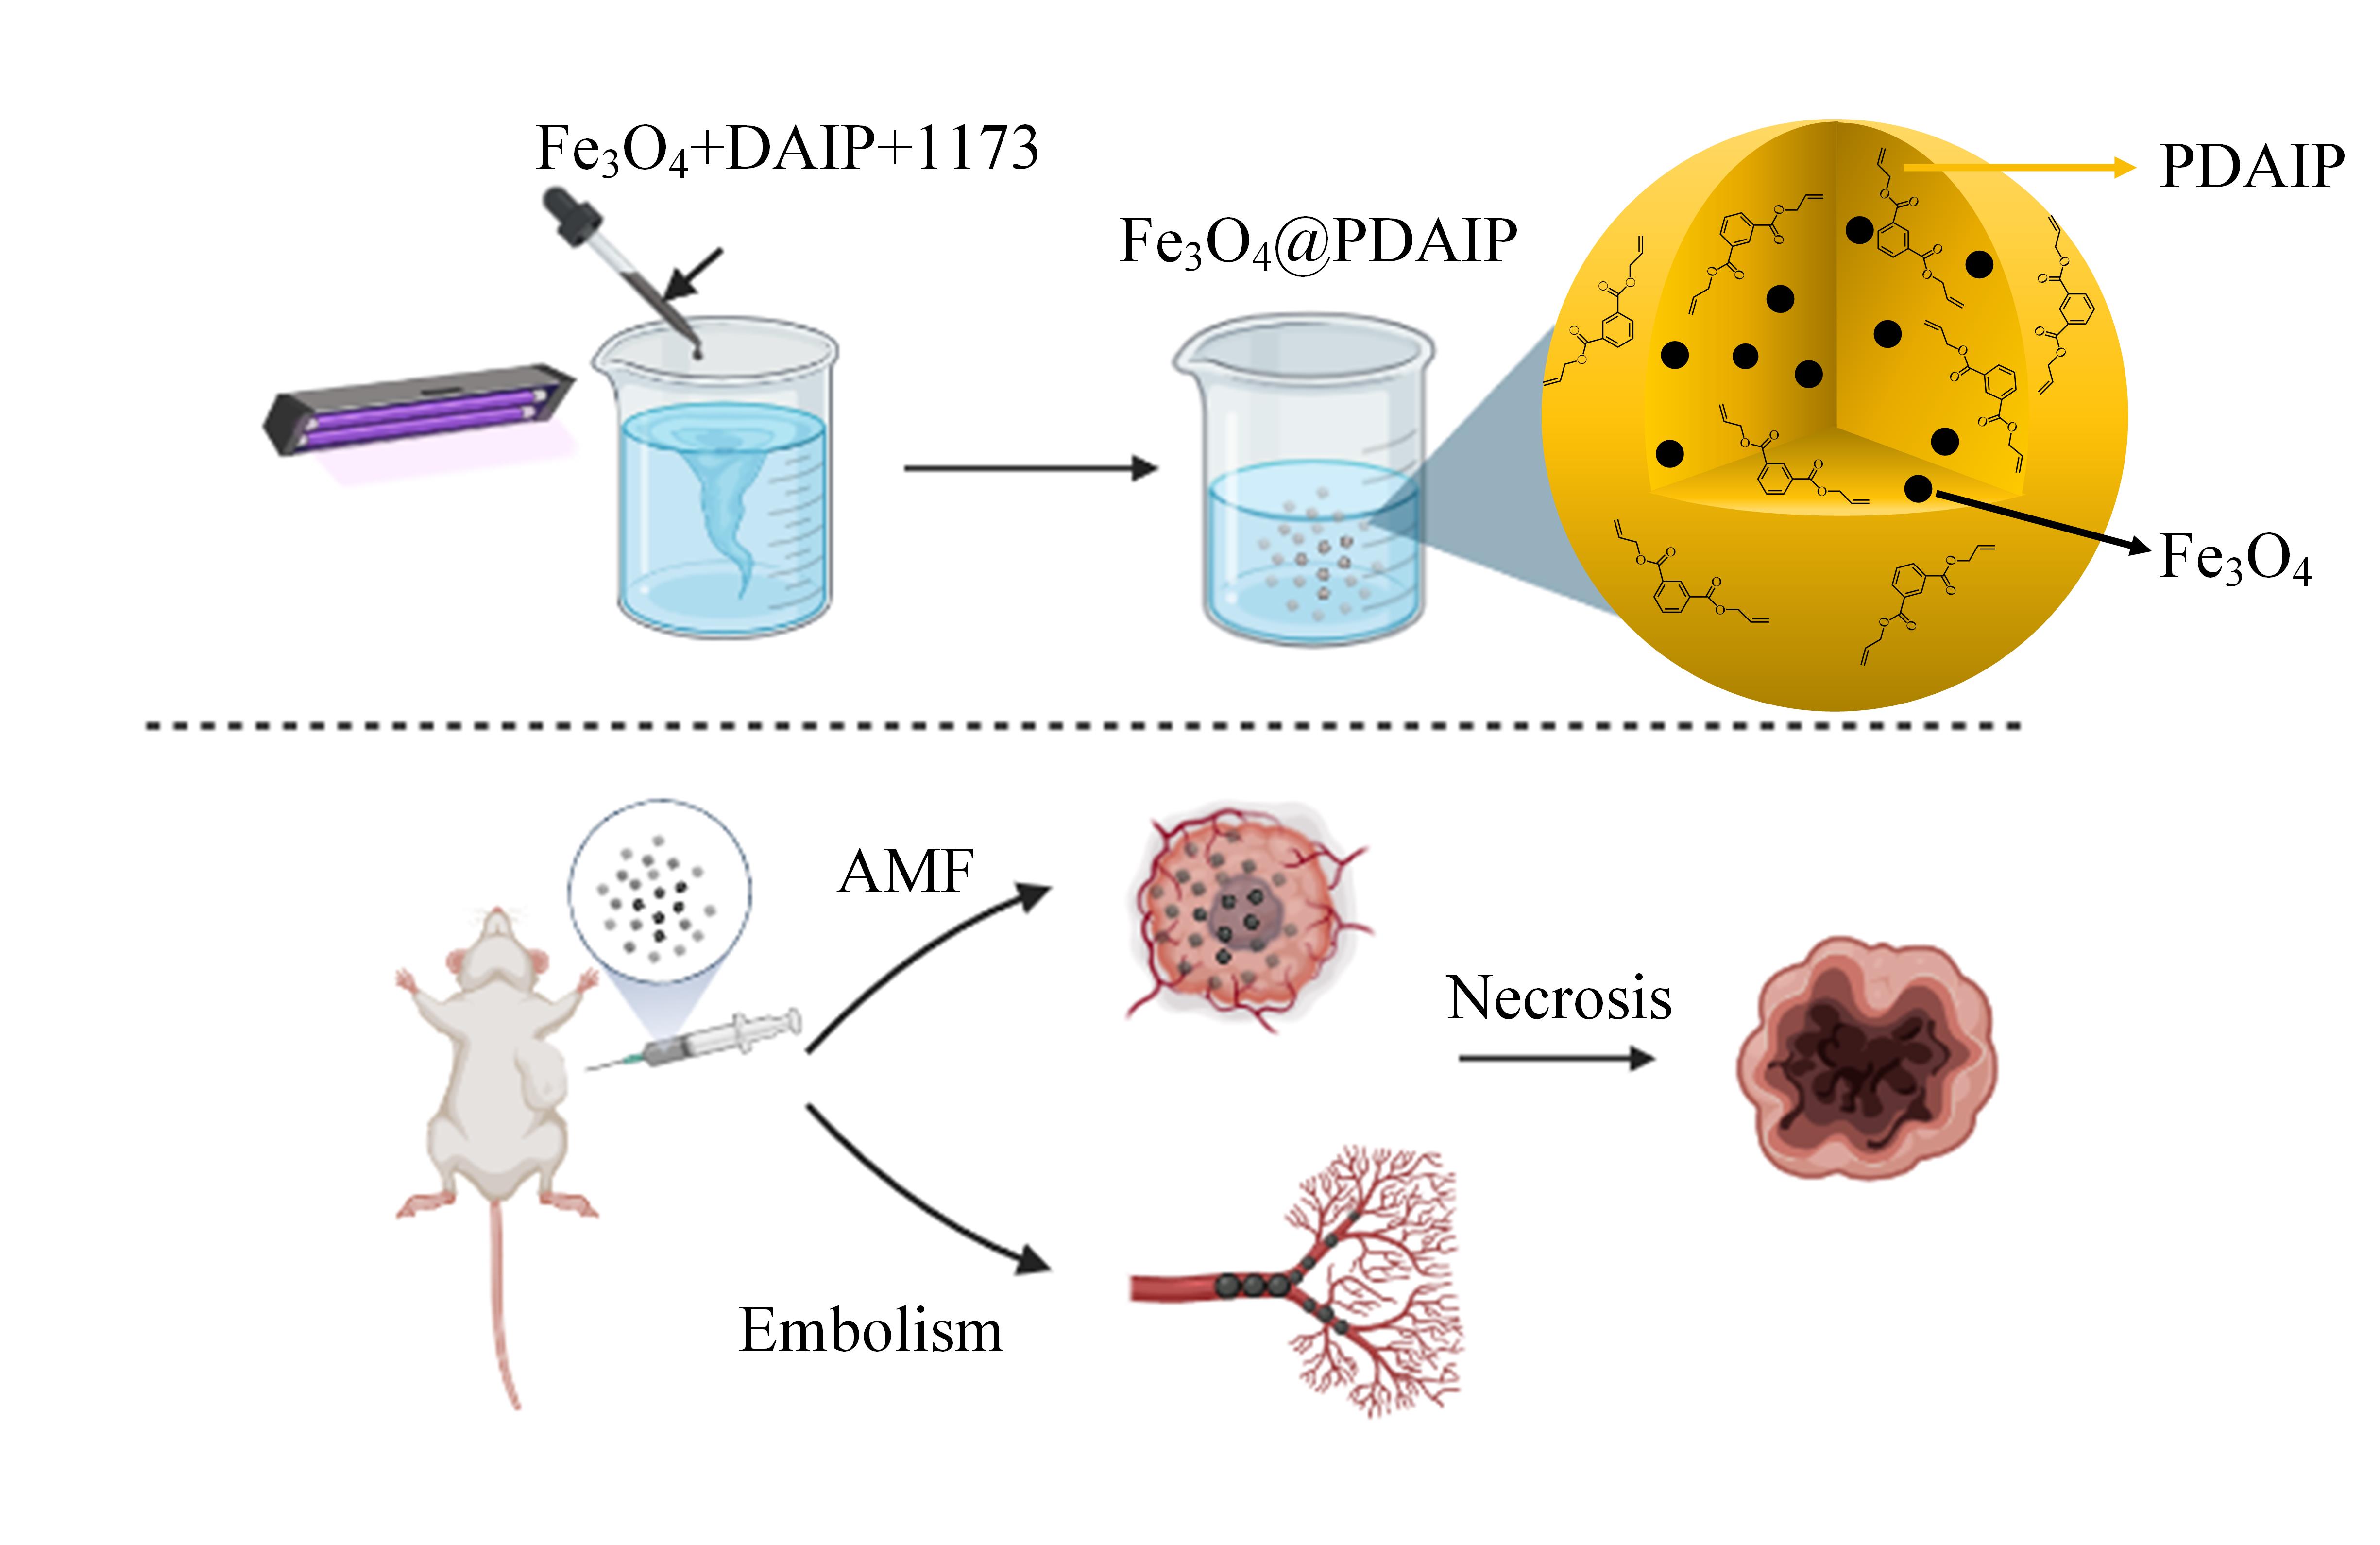
The temperature records of microsphere under AMF are shown in Fig. 3a (without cells) and 3b (with cells). The thermal effect caused by coil is excluded by the control group (gray line). The temperature can reach about 45 ~ 52oC and 44 ~ 48oC, respectively as the dose of microspheres increases from 10 to 30mg. In clinic, when tissues are heated to 41oC, heat shock proteins can be upregulated as the defensive mechanisms for cells against thermal damage; whereas the irreversible cell necrosis occurs when the tissue temperature exceeds 42oC. Moreover, cells death can occur rapidly owing to the vessel thrombosis and ischaemia at 46 ~ 52oC [16]. Figure 3c show typical thermal infrared images of the temperature rise of Fe3O4@PDAIP in vitro and in vivo. It can be seen that the microspheres in the coil were obviously warmed up due to the magnetocaloric effect, and the tumor site in mice showed the similar result.
The MRI capabilities of magnetic microspheres in vitro and in vivo were presented in Fig. 3d. Compared with the MRI image of pure agar, the signal of microspheres in agar has changed obviously, and the distribution of the microsphere could be seen clearly. Similarly, the MRI images of the injected microspheres in mice also changed significantly compared with the control group, and the shadow area increased with the increase of microsphere dose. The DSA (left) and CT (right) images were showed in Fig. 4. It can be seen that the microspheres and deionized water cannot be clearly distinguished at 0wt% Fe3O4 content, but when the Fe3O4 content increased to 2wt% or 4wt%, the obvious boundary between the microspheres and water was found. Compared with the image of iron without microspheres embedded, the capability imaging of DSA is only related to the iron concentration. CT images indicate that the visualization ability of Fe3O4@PDAIP microspheres in CT scanning is parity with Fe3O4. These results suggest that the Fe3O4@PDAIP magnetic microspheres have good capabilities on heating and MRI/CT enhanced imaging, and simultaneously have enormous potential in DSA imaging.
3.6 Fe3O4@PDAIP magnetic microspheres stability experiment
The stability of the microspheres immersed in different media (H2O, PBS, DMEM) for 1, 2 and 7 days was investigated. As shown in Fig. 5a, the microspheres still had similar heating performance as Fig. 3a and 3b, they can even reach more than 40oC at a low concentration. A significant correlation of the temperature and concentration was found. In Fig. 5b, the particle size distribution was measured by the previous method. The particle size distribution was 25 ~ 180µm (1 day), 40 ~ 200 µm (2 days), 35 ~ 180 µm (7 days) respectively. The average particle size was respectively 95.19µm (1 days), 101.95µm (2 days), 91.89 µm (7 days). Slight differences in particle size distribution and average were due to random sampling. These data indicate that the microspheres can still maintain their performance and morphology for a long time in different media without decomposition. This seems to be beneficial to a long-term embolization, and can greatly reduce the frequency of medication used by patients.
3.7 Cytotoxicity of Fe3O4@PDAIP magnetic microspheres
The CCK-8 assay (Fig. 6a) quantitatively showed that there was a slight negative influence on cell growth compared to the control group when the cells were co-cultured with Fe3O4@PDAIP extract of different concentrations for 1, 2 days, respectively. However, cell viabilities in these experimental groups were still above 80%. According to the toxicity grading guide, the Fe3O4@PDAIP cell toxicity was included in Grade I, representing relative growth rate between 75% and 99% during the culture process [36].
3.8 Inhibitory effect on tumor cells in vitro and in vivo.
After the cells containing different concentrations of microspheres were placed in AMF for 180s, the relative cell viabilities were determined by the CCK-8 assay. The results are shown in Fig. 6b. At a low concentration (10mg/mL), the tumor cells still maintained about 70% relative cell viability after experiencing the thermal effect of microspheres. When the concentration increased to a medium concentration (20mg/mL) and a high concentration (30mg/mL), the cell viability decreased significantly, only 50% compared with the control group. In addition, these cells were continuously observed. In the absence of microspheres or in a low concentration, the cell sap turned yellow within 24 hours, while cell sap of the middle and high concentration remained purplish red like the culture medium for 14 days or more. It implies that the metabolism of tumor cells has been affected by the thermal effect of middle and high concentration microspheres. Tumor size and body weight within 14 days are recorded in Fig. 6c and 6d. Similar results were obtained with the in vitro experiments. Tumor size was maintained or decreased over 14 days, in stark contrast to the control and low-concentration groups. The result of fluorescent staining of live & dead cell is shown in Fig. 6e. The higher the concentration of microspheres, the greater the proportion of cancer cells apoptosis. The results of H&E staining (Fig. 6f) also showed that in the high concentration group, a large part of the H22 cells (blue-purple) were replaced by connective tissue (pink), confirming the obvious necrosis of tumor cells. Subcutaneous solid tumors in mice were collected after 14 days, as shown in Fig. 6g. The three parallel experiments show that microspheres of medium and high concentrations can significantly inhibit tumor growth in vivo. Besides, there is no noticeable change on the body weight of the mice (Fig. 6d). It is suggested that the Fe3O4@PDAIP magnetic microspheres have no visible damage to the body.
3.9 Histopathological examination and serum detection.
After 14 days, the heart, liver, spleen, lung and kidney of the experimental mice were collected and stained with H&E to make histopathological sections. These pictures are listed in Fig. 7a. The shape of cardiomyocytes is normal; the distribution of cells around the central hepatic vein was radial, and there was no obvious inflammatory cell infiltration; in spleen, there was no significant expansion of white pulp and no lymphocyte filling; in lung, with many cavity areas, there is no obvious congestion in the pulmonary vessels; and no obvious pathological changes in renal corpuscles and renal tubules. This means that all tumor-bearing mice showed no significant inflammation or lesions and their various organs functions are basically normal. Figure 7b showed the serum test results of liver and kidney function after 14 days. The normal ranges of the liver function indexes ALT and AST are 10.06 ~ 96.47U/L and 36.31 ~ 235.48U/L respectively. The normal indexes BUN and CREA of kidney are 10.81 ~ 34.74mg/dL and 10.91 ~ 85.09µmol/L[37, 38]. The results showed that the liver and kidney functions were within the normal range, indicating Fe3O4@PDAIP magnetic microspheres have good biocompatibility. Combining with the result of histological observation, it shows Fe3O4@PDAIP magnetic microspheres have equivalence or non-inferiority tumor ablation effect.