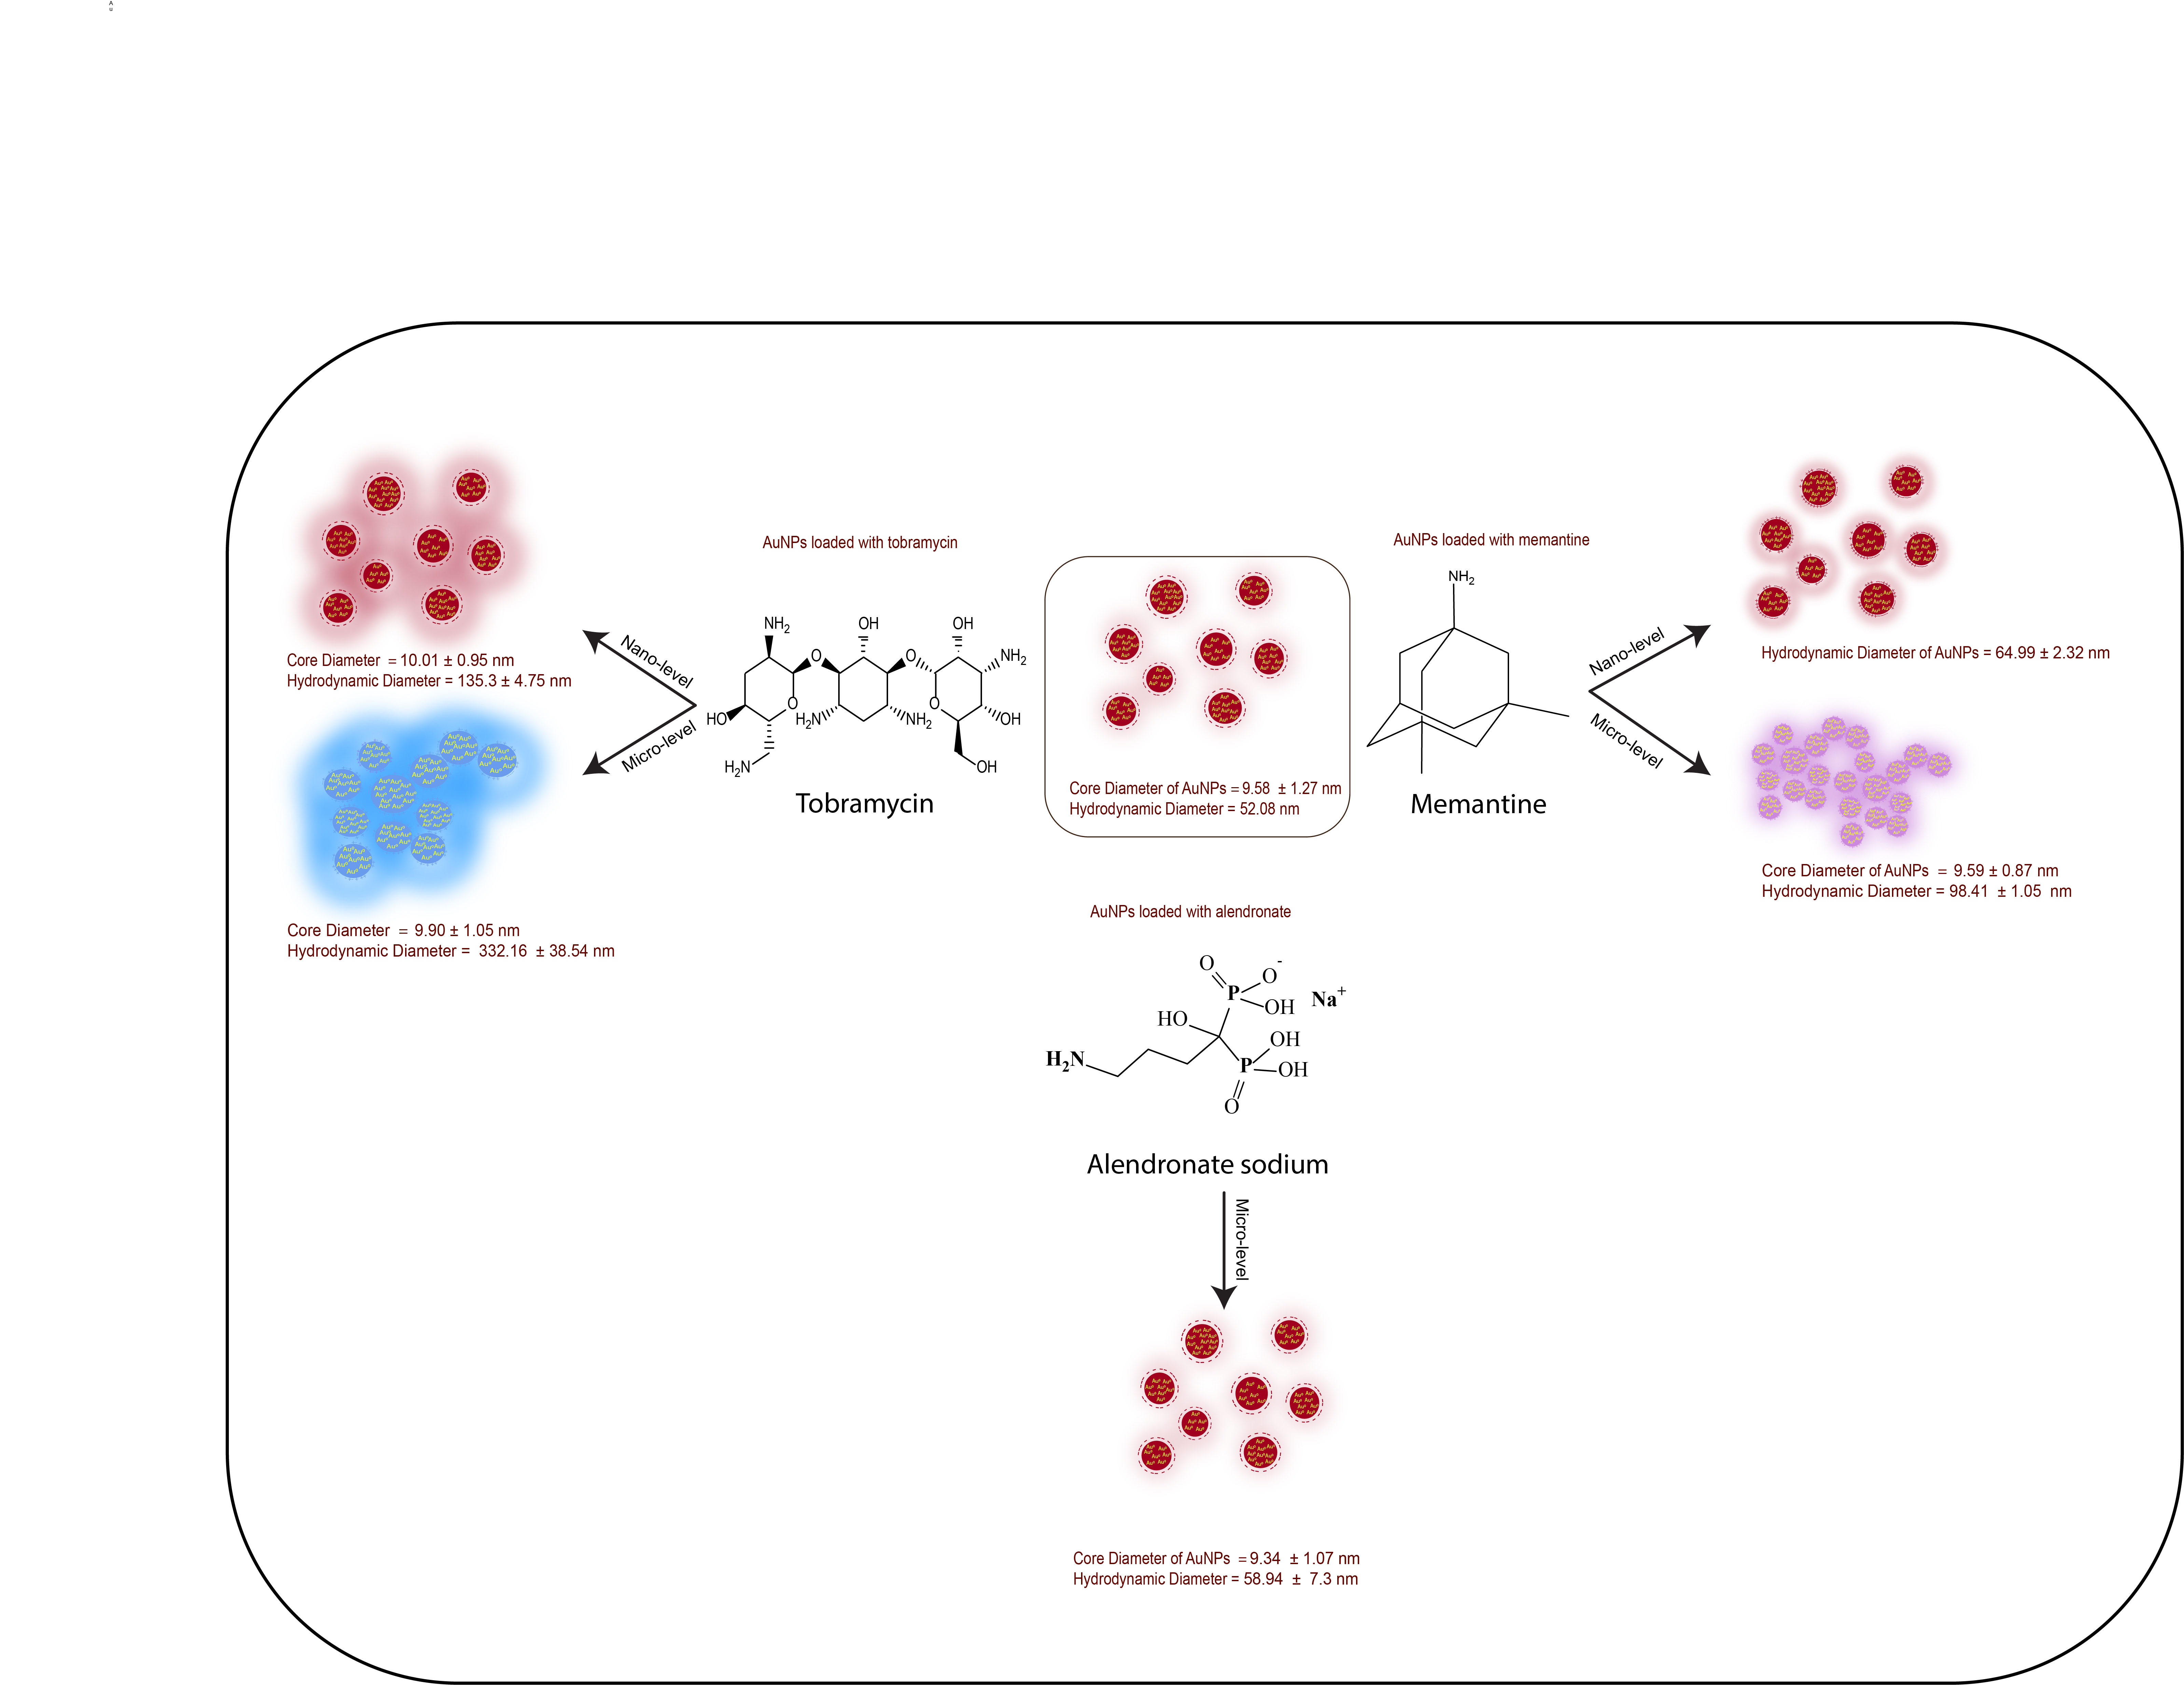
Turkevich Gold nanoparticles are the original nanoparticles that have been modified over time. Combining nanoparticles with targeting medications such as alendronate, memantine, and tobramycin will provide additional benefits in targeting specific areas in the bone, brain, and microorganisms, respectively. The reactivity and stability of nanoparticles in the presence of various drug concentrations (micro-, nano-, and milli-levels) have been studied. The absorbance spectra of nanoparticles at λmax 520 nm were always stable with alendronate, whereas with memantine and tobramycin, the spectra were unchanged (no color change) in the nano- level over twenty minutes and red shifts (color change) occurred in the micro-level. High Resolution Transmission Electron Microscopy (HRTEM) and • Dynamic light scattering (DLS) revealed that the core diameter was relatively stable in all cases, whereas the hydrodynamic diameter and zeta potential varied with drug concentration. Increasing concentration increased hydrodynamic diameter slightly with memantine (from 64.99 to 98.41 nm), dramatically with tobramycin (from 135.3 to 332.16 nm), and almost negligibly with alendronate (from 52.08 to 58.94 nm). Zeta potential, conversely, is reduced as concentration increases. Memantine had the greatest reduction in negativity, followed by tobramycin, but alendronate had a slight increase in negativity. This research would be useful for the application of gold nanoparticles in targeted drug delivery, where the stability and reactivity of gold nanoparticles are critical.
Research Article
Gold nanoparticles’ concentration dependent reactivity to alendronate, memantine, and tobramycin
https://doi.org/10.21203/rs.3.rs-1540817/v1
This work is licensed under a CC BY 4.0 License
Version 1
posted
You are reading this older preprint version
Gold nanoparticles
Alendronate
Tobramycin
Memantine
Stability
Drug Targeting
Reactivity
Gold chemistry is a rapidly growing era as gold is a unique noble metal, having distinguished properties among other metals such as thermal and chemical stability, electrical conductivity, mechanical softness, and highest electronegativity among all metals [1]. Gold nanoparticles (AuNPs) are one type of gold metal nanostructures that differs in color and properties from bulk metal [2]. These nanoparticles are very well known from ancient times [3]. Nowadays, AuNPs are widely used nano-carriers in targeted drug delivery systems (TDDSs) for biological and theranostic applications [4], due to their physico-chemical, optical and size tunability properties [5,6] . TDDSs are relatively new techniques for delivering drugs directly to specific sites (organ, receptor, etc...). The main goal of these techniques is to reduce side effects while increasing the therapeutic value though enhancing targetability. Loading gold nanoparticles by drug molecules is one of the techniques used to achieve targeted delivery. Nanoparticles drug delivery depends on certain physicochemical properties such as particle size, morphology, hydrophilicity, hydrodynamic diameter, stability, reactivity and surface charge [7, 8].
The mechanism of particles aggregation with targeting medications does not have enough attention, as a result, light has been shed on the way the nanoparticles may interact and aggregate with medications that have specific targets, such as alendronate (Alen.) [9], memantine (Mem.) [10], and tobramycin (Tobr.) [11, 12]. These medications target bone marrow, brain receptors, and specific microorganisms, respectively. Targeting these sites are challenging and important in the therapeutic management of various diseases like Osteoporosis [13], Alzheimer’s [14], and Cystic fibrosis [15].
The features of gold nanoparticles may have a potential effect on the detection of drugs that lack a chromophore in their structure [16,17]. These nanoparticle optical properties, which have been used to target cells or microorganisms for bioimaging and drug delivery, could also be used alongside in drug detection. Among the non chromophoric drugs are alendronate, memantine, and tobramycin have low absorbances in the UV-Vis region due to absence of a chromophore in their molecular structure [18–20]. This limitation can be overcome by utilizing gold nanoparticles’ optical properties.
The purpose of this research was to investigate the effect of the nano-, micro-, and milli- concentrations of alendronate, memantine and tobramycin (Figure 1) on the physicochemical properties of gold nanoparticles.
2.1 Apparatus
All spectra analysis were done on a Jasco UV-Vis spectrophotometer model (V-530). JASCO model FP‐6300 spectrofluorometer (Japan). Automatic Water Still. Electronic Balance. Micro Quartz Cuvette. High Resolution Transmission Electron Microscopy (HRTEM), model (JEOL JEM-2100). Zeta Potential Analyzer, model (Malvern Zetasize Nano-zs90).
2.2 Materials
Gold (III) chloride hydrate (HAuCl4.xH2O) was purchased from Sigma Aldrich (M.W: 339.79, anhydrous). Trisodium citrate dihydrate (Na3C6H5O7.2H2O), (M.W.: 294.10 g.mole−1) minimum assay: 99.0 % purchased from Gateway Co. Double Distilled Water obtained from Automatic Water Still. Alendronate sodium, Memantine and Tobramycin base were purchased from Sigma Aldrich.
2.3 Methods
2.3.1 Gold nanoparticles synthesis
Synthesis of gold nanoparticles was done according to steps in Figure 2a, as mentioned in previous literature [21] :- All glasswares were rinsed and soaked in aqua regia for 1 hour, cleaned thoroughly with distilled water and dried in oven. A 25 mM chloroauric acid (HAuCl4) (M.W.: 339.79 g.mole−1) solution was prepared by dissolving 85 mg (HAuCl4) in double distilled water in a 10 ml volumetric flask. A 38.8 mM trisodium citrate dihydrate (Na3C6H5O7.2H2O), (M.W.: 294.10 g.mol−1) was made by dissolving 1.1411 g in 100 ml volumetric flask. A 4 ml of 25 mM HAuCl4 was added into a clean 250 ml flask containing 96 ml distilled water and a magnetic bar. The 250 ml flask was connected to a condenser to reflux at 1100 rpm and heat up to boiling at 300 ℃for 45 min with continuous stirring (Figure 2b). A 10 ml of 38.8 mM trisodium citrate dihydrate was added instantly at once where color disappeared then changed from pale yellow to deep violet to red purple (Figure 2c). Refluxing was continued for another 20 min and cooling with continuous stirring. The colloidal solution was stored in tightly closed amber glass surrounded by aluminum foil in a refrigerator at 4 ℃. The prepared colloidal solution shows stability for several months, except if not stored very well.
2.4 Reaction Procedures
A 1 mg.ml−1 stock standard solutions, 10 µg.ml−1 and 100 ng.ml−1 working standard solutions were always freshly prepared for alendronate, memantine, and tobramycin in double distilled water. Various concentrations of alendronate (Alen.), memantine (Mem.), and tobramycin (Tobr.) were prepared in situ (in a micro cuvette) directly before spectrophotometric measurement using a 100 ng.ml−1 working standard solutions. A final volume settled to be 1000 µl. Different aliquots of working solutions were taken and volumes completed to final volume by diluted AuNPs (1:5). The concentrations were prepared in the nano-, micro-, and milli- molar ranges for each drug. The nano-ranges of Mem. was (33.46-334.63 nM), and Tobr. was (4.28-128.34 nM), while Alen. was in the milli-ranges (0.184-2.582 mM). Each concentration was multiple measured against blank solution for twenty minutes with adequate shaking before each measurement. Linearity was known by plotting (A0 − An)/A0 against the wide range of concentrations of Alen., Mem., and Tobr., where (A0) is the absorbance of AuNPs, (An) is the absorbance of AuNPs loaded by (n) concentrations of the selected medications. All spectra were measured through a wavelength range of (300 nm - 600 nm) and maximum absorption wavelength at λmax 520 nm. The reactions of AuNPs with Alen., Mem., and Tobr. have been optimized with the study of various factors such as multiple drug concentrations, reaction time, and dilutional effect. Concentrations in the nano, micro, and milli- scales have been studied. Time is a crucial factor in the reaction of AuNPs. The reaction time over twenty minutes has been studied. Also, the final volume of AuNPs has been studied.
2.4.1 AuNPs characterization
- UV-Vis’s spectroscopy
The absorbance of AuNPs has been measured by UV-Vis spectrophotometer at λmax 520 nm and an emission spectrum at λex 520 nm were recorded. The absorbance measurement was performed using UV-Vis’s spectrometer in the wavelength range of (200-800 nm). In spectrofluorometer, parameters were adjusted to a measurement mode (Emission Spectrum), band width (Ex and Em) (5 nm), response (Medium), sensitivity (Medium), measurement range (220 - 750 nm), excitation wavelength (520.0 nm) and scanning speed (1000 nm/min). A 1.5 ml of freshly prepared AuNPs was transferred to Quartz Cuvette for direct measurement against blank.
- High Resolution Transmission Electron Microscopy ( HRTEM)
The morphology and core diameter of gold nanoparticles have been measured by HRTEM for gold nanoparticles alone and loaded with the nano-, micro-, and milli- concentrations of alendronate, memantine, and tobramycin. This is to make sure if color change is associated with a change in the core diameter, and as a consequence, particle size increase, or color change is due to only aggregation of particles.
- Dynamic light scattering (DLS)
The hydrodynamic diameter and the zeta potentials of AuNPs have been measured by Zeta Potential Analyzer equipment to investigate the change in surface charge of the nanocrystals with adding different medications to try to predict how these particles could be aggregated.
3.1 Gold nanoparticles concentration and extinction coefficient.
The molar concentration and extinction coefficient of gold nanoparticle solutions in Table 1, have be calculated through the following steps:
1. Calculating the average number of gold atoms per nanoparticle (N) from HRTEM images as shown in Figure 4. Assuming a spherical and fcc shaped nanoparticle, the average number of gold atoms (N) per nanoparticle was calculated using Equation 1 [22], where π is the the circumference of a sphere (3.14), ρ is the density for fcc gold (19.3g/cm3), NA is Avogadro’s number (the number of atoms per mole) (6.023×10²³), M is the atomic weight of gold (197 g/M), and D is the average core diameter of nanoparticles that are summarized in Table 2.

Table 1: Molar concentrations a and extinction coefficients (ε)b of gold nanoparticle solutions.

- molar concentrations calculated from Equation 2.
- extinction coefficients calculated from the slope of regression line in Figure 3.
- extinction coefficient not calculated due to aggregation of AuNP s and unstable λmax.
2. Calculating the molar concentration of the prepared solutions from initial concen- tration, using Equation 2 where C is the molar concentration of the nanoparticle solution, NTotal is the total number of gold atoms (the initial amount of gold salt, HAuCl4,used), N stands for the average number of gold atoms per nanoparticle from Equation 1, and V is the volume of the reaction solution in (L), assuming that the gold(III) reduction was complete.

3. Determining the molar extinction coefficient of each sample from the slope of the regression line of absorbance vs concentration curves in Figure 3 (inset-2 in 3a, 3b, and 3d). This actually based on Lambert–Beer’s Equation 3, where A stands for absorption, ε is molar absorptivity or molar extinction coefficient (the slope), b is the path length of cuvette (1cm), c is the calculated molar concentration of gold nanoparticle solutions from Equation 2.
A = εbc (3)
3.2 Gold nanoparticles color stability, and UV-Vis’s absorbance spectra in the absence and presence of medications.
The synthesized gold nanoparticle solution (3.68×10⁻⁸ M) has been characterized using UV-Vis spectrophotometer and spectrofluorometer with maximum absorption and emis- sion at λmax 520 nm. The resolution of the spectrofluorimetric is high compared to UV-Vis spectrophotometry, as the FWHM (Full Width at Half Maximum) was small (5 nm) in fluorimetry, while in UV-Vis the FWHM was broader (60 nm) as in Figure 2.
The color stability of gold nanoparticles (AuNPs) has been studied visually and by UV-Vis’s spectrophotometer. Visually, the color of AuNPs was stable for long period under tight storage conditions (≃ six months) [23]. After addition of drugs to AuNPs, the color of AuNPs was mostly stable with alendronate, while least stable with me- mantine and tobramycin. The color change and the reactivity with tobramycin was most powerful than with memantine. Once the color changed, the process is repeated until the color completely disappeared. In the nanoscale, memantine and tobramycin made no color change. However, in the micro-scale, color change has been occurred.
Using UV-Vis, The nano-ranges of memantine and tobramycin did not led to red shift at λmax 520 nm as shown in Figure 3b and 3c or nanoparticles’ aggregations (Figure 5b) over twenty minutes. Mem. nano-ranges (33.46-334.63 nM) and Tobr. nano-ranges (4.28-128.34 nM) were stable for twenty minutes as shown in (inset-1 in Figure 3b, and inset-1 in Figure 3c), while Alen. was stable in the milli-ranges (0.11-1.48 E-02 mM) as in (inset-1 in Figure 3a). However, The micro-ranges of Mem. and Tobr. led to red shift (Figure 4a and 4b) and aggregation of gold nanoparticles (Figure 5d,5e).
3.3 Gold nanoparticles core diameter in the absence and presence of medications.
HRTEM images indicated that the core diameters of gold nanoparticles do not change when adding different medications with various concentrations even when nanoparticles aggregated. The average core diameter of AuNPs was 9.58 ± 1.27 nm. After addition of alendronate, memantine, and tobramycin to AuNPs solution, the average core diameters were relatively stable (9.68 ± 0.15 nm) as obvious in HRTEM images in Figure (5) and the calculated average core diameter in Table (2). The aggregation and color change of gold nanoparticles occur due to other factors, other than increasing in the core size of gold nanoparticles which could be due to increase in hydrodynamic diameter of nanoparticles, attraction, and repulsion forces of the outermost layer of nanoparticles, and the chemical compositions of drugs.
2: Mean core diameter, hydrodynamic diameter and Zeta Potential * of gold nanoparticles in absence and presence of alendronate, memantine, and tobramycin.

*The average core diameter, hydrodynamic diameter and Zeta Potential calculated from multiple HRTEM images and DLS measures.
3.4 Gold nanoparticles hydrodynamic diameter, and surface charge in the absence and presence of medications.
The hydrodynamic diameter of gold nanoparticles solution (52.08 ± 3.54 nm), calculated in Table 2, increase with increasing drug concentrations, except with alendronate, the hydrodynamic diameter of particles showed very small change (from 52.08 to 58.94 nm). The gradual increase in hydrodynamic diameter with increasing concentrations from nano- to micro is very large with tobramycin (from 135.3 to 332.16 nm) compared to memantine (from 64.99 to 98.41 nm) as shown in Figure 5 and Table 2. This may be attributed to the bulk structure of tobramycin and its various functional groups as shown in Figure 6 which accelerate the accumulation of more drug molecules on the surface of gold nanoparticles. While memantine structure is very small and has only one primary amine functional group available for reaction. Similarly, the average zeta potentials were measured by Zeta Potential Analyzer to analyze the surface charge of gold nanoparticles as in Table 2. The greatest decrease in negativity was with memantine (from 0.26 to 0.53 mv), while with tobramycin obviously decreased in the micro-level (from -23.63 to -1.64 mv). But with alendronate, a slight increase in negativity (from -24.56 to -30.23 mv).
3.5 Proposed gold nanoparticles’ reactivity mechanism
The stabilization of Turkevich gold nanoparticles is attributed to the electrostatic inter- actions of the negative coating layers of citrate-anions with the nanoparticle core which keep the particles suspended in the colloidal solution without precipitation [22]. The suggested stability of Turkevich gold nanoparticles after the addition of solutions of the tested drugs (Alen., Mem., Tobr.) could be explained from the chemical structures (Fig- ure 6) as follows. It can be observed that the three drugs contain a primary amine group (−NH2) which may interact with the negative case of alendronate, there is only one primary amine group (−NH2) that could interact with the weak carboxylic acid groups (−COO−) of citrate-anions, leaving the bis-phosphonate group (−COH(PO3H2)2) freely coating the outer most layer of nanoparticles. This sec- ond negative layer of the bis-phosphonate group in alendronate could be used as another stabilizing and protective layer, which may contribute to the compatibility of gold nanoparticles with alendronate. On the other hand, memantine also contains only one primary amine group (−NH2) like alendronate, that could interact with the weak carboxylic acid group (−COO−) till complete saturation of the outer most layer of gold nanoparticles with memantine leaving this layer uncharged by the hydrocarbon chains. It was observed that memantine exhibits positive zeta potential as in Table 2 which could be explained by the presence of the hydrocarbon chains, that may form weak ionic inter- actions with matrix materials which may lead the attraction of gold nanoparticles to each other at the micro-level. On the contrary, Tobramycin that contains more than one primary amine group (−NH2), may interact with the gold nanoparticles in many directions. This may explain why tobramycin has rapid reactivity toward these nanoparticles. All these suggested mechanisms have been illustrated in the proposed diagrams (Figure 6).
The Turkevich gold nanoparticles’ reactivity to some specific drugs like alendronate, memantine, and tobramycin, which target bone, brain, and microorganisms, has been tested. In this work, it was obvious that the reactivity of nanoparticles with medications depends on both the structure bulkiness and the concentrations used. As just a consequence, the reactivity order could be arranged as follows: tobramycin (micro-level) > memantine (micro-level) > alendronate (milli-level). Alendronate showed no reactivity at any con- centration level as mentioned in the above proposed mechanism. One of the explanations of the nanocrystals’ color change and aggregation could be the increase in hydrodynamic diameter and the decrease in zeta potential (negativity). Both parameters already change in case of memantine and tobramycin while remain almost stable with alendronate. Finally, to avoid aggregation of gold nanoparticles for the purpose of targeted drug delivery in reactive medications such as memantine and tobramycin, concentrations should be lowered to the nano-levels. Further in vivo research needs to be done to ascertain this phenomenon.
Competing interests: The authors declare no competing interests.
- A. Laguna, Modern supramolecular gold chemistry: gold-metal interactions and ap- plications. John Wiley and Sons, 2008.
- T. Muangnapoh, N. Sano, S.-I. Yusa, N. Viriya-empikul, and T. Charinpanitkul, “Facile strategy for stability control of gold nanoparticles synthesized by aqueous reduction method,” Current Applied Physics, vol. 10, no. 2, pp. 708–714, 2010. doi:https://doi.org/10.1016/j.cap.2009.09.005.
- P. Georgiev, A. Bojinova, B. Kostova, D. Momekova, T. Bjornholm, and K. Bal- ashev, “Implementing atomic force microscopy (afm) for studying kinetics of gold nanoparticle’s growth,” Colloids and Surfaces A: Physicochemical and Engineering Aspects, vol. 434, pp. 154–163, 2013.
- S. Setua, M. Jaggi, M. M. Yallapu, S. C. Chauhan, A. Danilushkina, H. Lee, I. S. Choi, R. Fakhrullin, L. D. Esposti, A. Tampieri, M. Iafisco, M. Shevtsov, and G. Multhoff, “Chapter 6 - targeted and theranostic applications for nanotechnolo- gies in medicine,” in Nanotechnologies in Preventive and Regenerative Medicine (V. Uskoković and D. P. Uskoković, eds.), Micro and Nano Technologies, pp. 399– 511, Elsevier, 2018. doi: https://doi.org/10.1016/B978-0-323-48063-5.00006-X.
- B. Duncan, C. Kim, and V. M. Rotello, “Gold nanoparticle platforms as drug and biomacromolecule delivery systems,” Journal of Controlled Release, vol. 148, no. 1, pp. 122–127, 2010. 11th European Sumposium on Controlled Drug Delivery. doi: https://doi.org/10.1016/j.jconrel.2010.06.004.
- V. P. Torchilin, “Structure and design of polymeric surfactant-based drug delivery systems,” Journal of Controlled Release, vol. 73, no. 2, pp. 137–172, 2001. doi:https://doi.org/10.1016/S0168-3659 (01)00299-1.
- O. Veiseh, J. W. Gunn, and M. Zhang, “Design and fabrication of magnetic nanopar- ticles for targeted drug delivery and imaging,” Advanced Drug Delivery Reviews, vol. 62, no. 3, pp. 284–304, 2010. Targeted Delivery Using Inorganic Nanosystem. doi: https://doi.org/10.1016/j.addr.2009.11.002.
- M. A. Dobrovolskaia, P. Aggarwal, J. B. Hall, and S. E. McNeil, “Preclinical studies to understand nanoparticle interaction with the immune system and its potential ef- fects on nanoparticle biodistribution,” MOLECULAR PHARMACEUTICS, vol. 5, pp. 487–495, JUL-AUG 2008. 7th International Symposium on Polymer Therapeu- tics, Ctr Invest Principe Felipe, Valencia, SPAIN, MAY 26-28, 2007. doi: {10.1021/mp800032f}.
- S. R. Cummings, A. C. Santora, D. M. Black, and R. G. G. Russell, “History of alendronate,” Bone, vol. 137, 2020. doi: 10.1016/j.bone.2020.115411
- H. J. Möbius, “Memantine: update on the current evidence,” International Journal of Geriatric Psychiatry, vol. 18, no. S1, pp. S47–S54, 2003. doi: https://doi.org/10.1002/ gps.939.
- K. M. Krause, A. W. Serio, T. R. Kane, and L. E. Connolly, “Aminoglycosides: An overview,” Cold Spring Harbor Perspectives in Medicine, vol. 6, no. 6, p. 18, 2016. doi:10.1101/cshperspect.a027029.
- L. Chronopoulou, E. G. Di Domenico, F. Ascenzioni, and C. Palocci, “Positively charged biopolymeric nanoparticles for the inhibition of Pseudomonas aeruginosa biofilms,” JOURNAL OF NANOPARTICLE RESEARCH, vol. 18, OCT 13 2016. doi:{10.1007/s11051-016-3611-y}.
- K. E. Ensrud and C. J. Crandall, “Osteoporosis,” Annals of Internal Medicine, vol. 167, no. 3, pp. ITC17–ITC32, 2017. PMID: 28761958. doi:10.7326/AITC201708010.
- A. P. Nesterova, E. A. Klimov, M. Zharkova, S. Sozin, V. Sobolev, N. V. Ivanikova, M. Shkrob, and A. Yuryev, “Alzheimer’s disease,” in DISEASE PATHWAYS: AN ATLAS OF HUMAN DISEASE SIGNALING PATHWAYS, pp. 221–233, 2020.
- B. Schnapf and P. Farrell, “Cystic Fibrosis,” in METABOLIC DISEASES: FOUN- DATIONS OF CLINICAL MANAGEMENT, GENETICS, AND PATHOLOGY, 2ND EDITION (GilbertBarness, E and Barness, LA and Farrell, PM, ed.), pp. 511– 541, 2017. doi:{10.3233/978-1-61499-718-4-511}.
- M. Ayad, H. Abdellatef, M. Hosny, and N. Kabil, “Aggregation of gold nanoparticles for spectrophotometric determination of bisoprolol hemifumarate, buspirone hcl and doxazosin mesylate,” Nano Biomedicine and Engineering, vol. 11, 01 2019. doi:10.5101/nbe.v11i1.p1-10.
- X. T. Zheng, W. L. Goh, P. Yeow, D. P. Lane, F. J. Ghadessy, and Y. N. Tan, “Ultrasensitive dynamic light scattering based nanobiosensor for rapid anticancer drug screening,” Sensors and Actuators B: Chemical, vol. 279, pp. 79–86, 2019.
- G. Ananchenko, J. Novakovic, and A. Tikhomirova, “Chapter one - alendronate sodium,” in Profiles of Drug Substances, Excipients, and Related Methodology (H. G. Brittain, ed.), vol. 38 of Profiles of Drug Substances, Excipients and Related Method- ology, pp. 1–33, Academic Press, 2013. doi:https://doi.org/10.1016/B978-0-12-407691-4.00001-0.
- A. K. Dash, “Tobramycin,” vol. 24 of Analytical Profiles of Drug Substances and Excipients, pp. 579–613, Academic Press, 1996. doi: https://doi.org/10. 1016/S0099-5428(08)60703-0.
- P. Prapatpong, T. Techa-In, W. Padungpuak, S. Buranaphalin, and L. Suntorn- suk, “HPLC-Fluorescent Analysis of Memantine: An Investigation on Fluorescent Derivative Formation,” JOURNAL OF CHEMISTRY, vol. 2015, 2015. doi: {10.1155/2015/672183}.
- K. Lata, K. Arvind, N. Laxmana, and S. Rajan, “Gold nanoparticles: preparation, characterization and its stability in buffer,” A Journal of Nanotechnology and Its Applications, vol. 17, no. 1, pp. 1–10, 2014. https://www.researchgate.net/publication/274195747.
- X. Liu, M. Atwater, J. Wang, and Q. Huo, “Extinction coefficient of gold nanoparticles with different sizes and different capping ligands,” Colloids and Surfaces B: Biointerfaces, vol. 58, no. 1, pp. 3–7, 2007. Supramolecular Chemistry Applied to Interfaces. doi: https://doi.org/10.1016/j.colsurfb.2006.08.005.
- H. Tyagi, A. Kushwaha, A. Kumar, and M. Aslam, “A facile ph controlled citrate- based reduction method for gold nanoparticle synthesis at room temperature,” Nanoscale research letters, vol. 11, no. 1, pp. 1–11, 2016. doi:https: //doi.org/10.1186/s11671-016-1576-5.
- graphicalabstract.jpg
Graphical Abstract