Electrochemical determination of tert-butyl hydroquinone (TBHQ) is vital to food safety due to negative health effects, however, bare electrode of traditional electrochemical sensors generally have narrow linear range and low sensitivity, limiting their practical application. Accordingly, a nano-architecture fabricated with N-doped TiO2–carbon nano-composites (TiO2/NC) based on the thermolysis of NH2 functionalized MIL-125 (Ti) Metal Organic Framework (NH2-MIL-125(Ti)) is firstly developed as an electrochemical material for electrochemical determination of TBHQ. The TiO2/NC composites with the highly porous structure, excellent conductivity and electron transportation, large surface area showed remarkable electrochemical oxidation ability for TBHQ. Under optimal conditions, TiO2/NC composites modified electrode presents a broader linear response to TBHQ concentration of 0.05–100 µM with the detection limit as low as 4 nM (S/N = 3). Finally, the sensor platform is implemented directly to determine TBHQ in edible oil for evaluation of its practical application. TiO2/NC composites sensor fabricated performs larger linear range with high sensitivity and anti-interference properties, providing a potential strategy for electrochemical determination of TBHQ.
Research Article
N-doped TiO 2–carbon composites derived from NH 2 -MIL-125(Ti) for electrochemical determination of tert-butyl hydroquinone
https://doi.org/10.21203/rs.3.rs-1548500/v1
This work is licensed under a CC BY 4.0 License
You are reading this latest preprint version
NH2-MIL-125(Ti)
TiO2
N-doped
carbon
tert-butyl hydroquinone
Tert-butyl hydroquinone (TBHQ) is one of common preserving additives in edible oils due to its low price, non-toxicity and high chemical stability (Sanidad et al, 2016; Almeida et al, 2011). Howbeit, many health studies have showed that its oxidative product is toxic. Excessive use of TBHQ may induce negative health effects like stomach tumors and liver damage (Negar et al, 2007; Eskandani et al, 2014), carcinogenesis (Hirose et al, 1998), underdevelopment of the reproductive system (Jeong et al, 2005). Therefore, many regions (such as European Union, the United States, and China) have legislated laws and permitted the maximum allowable concentration in food of 200 mg kg− 1 (Li et al, 2017). Summarizing the mentioned above, effective measurement of phenolic antioxidants is meaningful for quality control procedures.
Until now, different types of analytical techniques have been widely used in the determination of TBHQ. Electrochemical methods are more suitable than capillary electrophoresis (Boyce et al, 1999) and chromatography (Farajmand et al, 2017) in terms of low cost, fast speed, easy operation and accuracy. To date, a variety of electrochemical modified materials, including carbon nanotubes (Caramit et al, 2013; Ziyatdinova et al, 2015; Tang et al, 2022), polymers (Tang et al, 2016), metal oxide nanoparticles (Gan et al, 2016; Cao et al, 2019; Monteiro et al, 2016), have been done to increasing the sensitivity and selectivity for TBHQ.
In some researches, transition metal oxides (e.g. TiO2 and ZnO) as electrochemical materials, show facile electron transfer, high biocompatibility and considerable stability (Arif et al, 2016; Lu et al, 2021; Mahadik et al, 2017). However, the bulk and aggregation of nanostructured TiO2 during the electrochemical process, leads to the decrease of active sites and affects the catalytic performance (Liu et al, 2013). Therefore, it is of great important to find a suitable supports, carbon materials including carbon nanofiber, porous carbon, carbon nanotubes and graphene (Zeng et al, 2013; Tang et al, 2021; Qiu et al, 2014; Chen et al, 2011), having advantages of high surface area and electrical conductivity, have been applied as supports to prevent the agglomeration and increase the conductivity and chemical stability of TiO2 nanomaterials. The interaction between TiO2 and carbon materials is relatively weak when the TiO2/C composites are fabricated by separate steps, because of its relative low ions/electrons transfer (Li et al, 2012; Li et al, 2008). Moreover, nanostructured metal oxides–carbon hybrid composites can be obtained via the solid-state pyrolysis of suitable metal-organic frameworks (MOFs) template with a unique thermal behavior. Metal-organic frameworks (MOFs) are one, two, or three-dimensional structures consist of metal ions or clusters coordinated organic ligands (Rowsell et al, 2004; Li et al, 2020; Wang et al, 2019). Typical Ti-based MOF, MIL-125(Ti) was firstly fabricated by Dan-Hardi et al (Dan-Hardi et al, 2009) with high porous, low toxicity and good stability. Some researchers have developed the application of TiO2/C composite through pyrolysis of MIL-125(Ti) in Na ion batteries and microwave absorption (Shi et al, 2016; Ma et al, 2017). Meanwhile, introducing heteroatoms like nitrogen, sulfur, etc. into metal/metal oxide or carbon matrices can increase chemical stability, adsorptive ability, and electro-catalysis activity (Li et al, 2013). It can be easily realized by direct decomposition of MOFs with designable organic linkers with specific functional groups or elements such as amidogen and sulfydryl (Gu et al, 2016). To our best knowledge, N-doped TiO2–carbon nano-composites derived from Ti-based MOFs for electrochemical sensors is reported rarely.
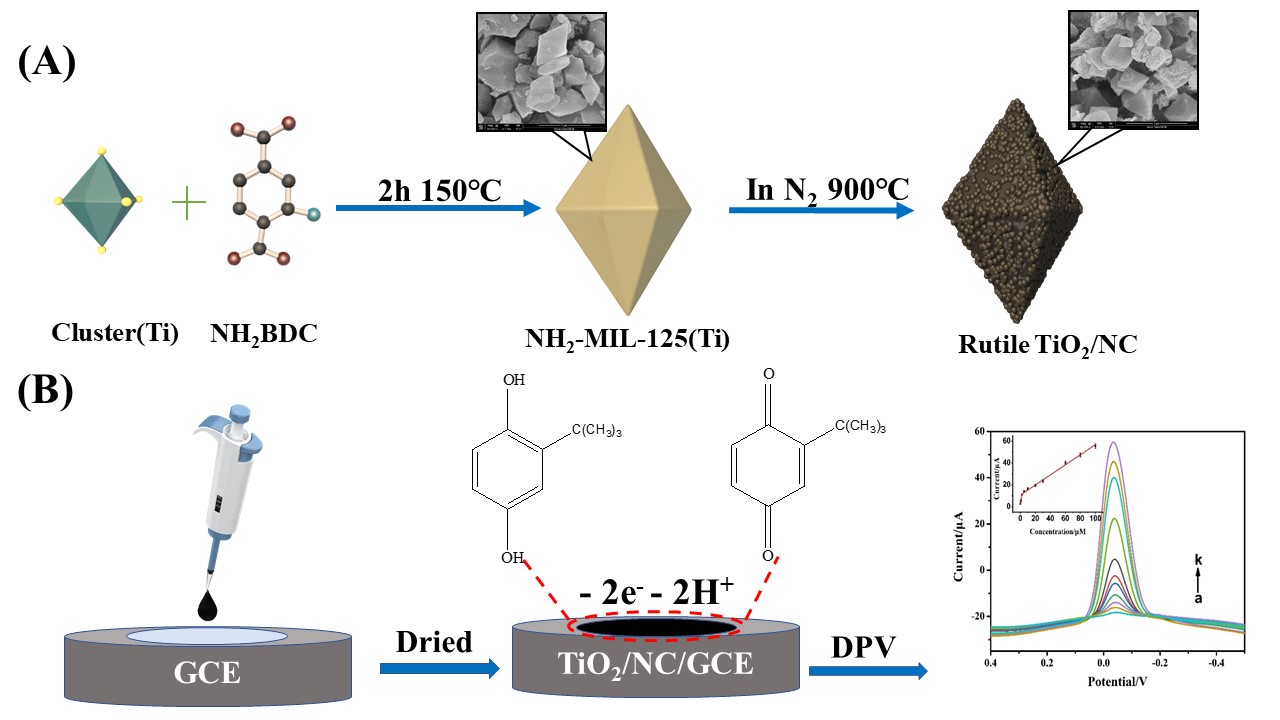
Bearing these facts in mind, amino-functionalized titanium MOF (NH2-MIL-125(Ti)) was synthesized firstly, and then one-step solid-state pyrolysis in an Ar atmosphere to fabricate a porous nitrogen-doped TiO2–carbon hybrid composites (TiO2/NC). Based on TiO2/NC as modification material, a new electrochemical sensor was constructed for the high sensitivity detection of TBHQ. The schematic illustration of the TiO2/NC/GCE fabrication process was given in Scheme. 1. The TiO2/NC composites with the highly porous structure, excellent conductivity and electron transportation, high surface area showed remarkable electrochemical oxidation ability for TBHQ. In addition, the composite electrode was successfully applied to recognize and determine TBHQ in edible oil.
Reagents and apparatus
Titanium tetraisopropanolate, tert-butyl hydroquinone (TBHQ), butylated hydroxyanisole (BHA) and 2-aminoterephthalic acid (H2BDC-NH2) were achieved from Aladdin Industrial Corporation (China). N, N-dimethylformamide (DMF) and other chemicals were provided by Sinopharm Chemical Reagent Co., Ltd. Phosphate buffer solutions used in this manuscript was 0.1 M, prepared by mixing NaH2PO4·2H2O (0.1 M) and Na2HPO4·12H2O (0.1 M). All reagents were used without further purification and the solutions were prepared by the hyperpure water with 18.2 MΩ⋅cm.
Electrochemical experiments were carried out via a CHI 660E electrochemical workstation (Shanghai CH Instruments, China), in which a three-electrode cell was used including the bare or modified GCE (diameter 3 mm; CHI104), the saturated calomel electrode (SCE) and the platinum wire as the working electrode, the auxiliary electrode and the reference electrode. The morphologies of materials were studied using a JSM-7100F scanning electron microscope and a JEM-100CX electron microscope (JEOL, Japan). Powder X-ray diffractometer (XRD) were collected on a Bruker D8-ADVANCE (Bruker, Germany) by using Cu Ka radiation. N2 adsorption/desorption isotherms were performed at 77 K on an ASAP 2020 analyzer (Micromeritics, Norcross, GA, USA). X-ray photoelectron spectroscopy (XPS) were examined using a K-Alpha spectrometer (Thermo Fisher Scientific Inc., UK).
Fabrication of NH2-MIL-125(Ti)
Amino-functionalized Ti-based MOF with (Ti8O8(OH)4(bdc-NH2)6 (NH2-MIL-125) was presented by Kim et.al (Kim et al, 2013). A solution of 2-aminoterephthalic acid (2.54 g) in 60 mL DMF-CH3OH (9:1, v/v) mixture was prepared. Then titanium (IV) isopropoxide (3.19 mL) was added in the above solution. The mixture was transferred into a teflon-lined autoclave with 150°C for 24 h in an oven. Next, the yellow solid powder was recovered by filtration, washed several times with DMF and CH3OH. Finally, NH2-MIL-125 was dried under vacuum at 80°C in the oven.
Preparation of nitrogen-doped TiO2–carbon hybrid composites (TiO2/NC)
For the TiO2/NC composites preparation, the as-obtained NH2-MIL-125(Ti) was firstly pre-carbonized at 300°C for 2 h in a tube furnace and then further carbonized at 900°C for 2 h with a speed of 2°C /min under Ar atmosphere to make the material fully carbonized. The black powder of TiO2/NC composites were collected.
Preparation of the modified electrode
The detailed preparation of the TiO2/NC modified electrode was described as follows, firstly, the glassy carbon electrode (GCE) was carefully polished with 0.05 µm alumina power. Subsequently, GCE was cleaned with ethanol and ultrapure water for 1 min successively. Finally, it was dried with nitrogen at RT temperature. 4 mg TiO2/NC composites were dispersed in 2 mL DMF by sonicated for 5 min. 9 µL of the above suspension was dropped onto the bare GCE surface, and dried at RT temperature to obtain TiO2/NC/GCE. In contrast, NH2-MIL-125(Ti) modified electrode was prepared in a similar process.
Characterization of TiO2/NC composites
At first stage, the Ti-based MOF were synthesized via Ti4+ and 2-aminoterephthalic acid complexation process. Then, the TiO2/NC composites were fabrication via the solid carbonation of NH2-MIL-125(Ti) process. Octahedral-like structures of both NH2-MIL-125(Ti) and its composites were presented by TEM and SEM (Fig. 1). As revealed by SEM images (Fig. 1a and 1b), the precursor NH2-MIL-125(Ti) showed the octahedral shape morphology with smooth surface, the calcination process results in N doped carbon particles with rough surface in the range of ~ 500–1000 nm. Furthermore, as depicted in Fig. 1c, TEM image revealed that TiO2 nanoparticles were uniformly distributed in the carbon matrix, which was verified by energy-dispersive spectroscopy (EDS) and elemental mapping analysis of Ti, C, O and N (Fig. 1e-h).
The crystallographic structure of the precursor NH2-MIL-125(Ti) and TiO2/NC composites was evaluated by X-ray diffraction (XRD), as shown in Fig. 2a. The prepared NH2-MIL-125(Ti) crystals showed good crystallinity and the diffraction pattern was consistent with that previously reported (Dan-Hardi et al, 2009). After carbonization, the new diffraction peaks could be observed, which were assigned to TiO2 particles. At 900°C carbonized temperature, the XRD pattern of the TiO2/NC nanocomposites exhibited peaks at 2θ values of 27.4º, 36.2º, 41.2º and 51.3ºthat assigned to (110), (101), (111) and (211) planes of rutile TiO2 (JCPDS file No. 21-1276), which matched well with previously literatures (Guo et al, 2014; Wang et al, 2015).
The XPS spectra of TiO2/NC is further analyzed, shown in Fig. 2b. The wide XPS survey spectra revealed the presence of Ti, C, N and O related peaks. The peaks at binding energy of 458.2 and 463.9 eV were belonged to Ti 2p3/2 and Ti 2p1/2, indicating the presence of TiO2 species. Additionally, the binding energy peak observed at 400.8 eV, which represented the typical binding energy of the pyrrolic nitrogen (Casanovas et al, 1996). Figure 2d shows the nitrogen adsorption − desorption isotherms of TiO2/NC. The isotherm exhibited type-IV isotherm curve, indicating the TiO2/NC was typical mesoporous materials. Very curiously, the carbonized sample TiO2/NC showed the BET surface area of 287.9 m2·g− 1 and the pore diameters of 2.95 nm. Therefore, TiO2/NC showed a relative large surface area and pore diameter. Basically, porous materials with larger pores have excellent advantages for catalyses due to their active sites which rapidly accessed by any substrate for high reactivity (Corma et al, 1996).
Characterization of TiO2/NC modified electrode
Electrochemical characterization of the TiO2/NC modified electrode was also studied by cyclic voltammetric (CV) technique. As seen in Fig. 3a, the CV curves of 5.0 mM [Fe(CN)6]3−/4− containing 0.1 M KCl over bare GCE, NH2-MIL-125(Ti)/GCE and TiO2/NC/GCE. A pair of oxidation–reduction peaks appeared at the bare GCE with the anode peak current Ipa about 48.56 µA. On NH2-MIL-125(Ti) coated on the surface of GCE, the peak currents obviously increased owing to the high surface area. Moreover, on TiO2/NC/GCE, a pair of well-defined peaks appeared with an Ipa of 2 times higher than its of bare GCE, indicating that the TiO2/NC sensor has a fast electron transfer rate because of the highly porous structure, excellent conductivity and electron transportation, large surface area of the TiO2/NC composites.
As shown in the inset of Fig. 3a, the peak current of three different electrodes increases linearly related to the square root of the scan rate. According to Randles–Sevcik equation:

where Ip, n, A, C0, D0 and v are the peak current, the number of electrons transfer (n = 1), the electrochemically active area, the concentration of the reactant, the diffusion coefficient of the [Fe(CN)6]3−/4− (about 7.6×10− 6 cm2·s− 1) and the scan rate, respectively. The slopes were 69.39, 157.3 and 230.2 of the three lines at bare GCE, NH2-MIL-125(Ti)/GCE and TiO2/NC/GCE, respectively. According to the slopes of the linear equations, the electroactive surface areas of bare GCE, NH2-MIL-125(Ti)/GCE and TiO2/NC/GCE were calculated to be 0.026 cm2, 0.070 cm2 and 0.086 cm2, respectively. Their results clearly indicated that TiO2/NC could effectively large the electroactive area and more reactive sites.
The impedance spectroscopy of the different electrode (bare GCE, NH2-MIL-125(Ti)/GCE and TiO2/NC/GCE) are depicted in 5.0 mM [Fe(CN)6]3−/4− containing 0.1 M KCl in Fig. 3b. The impedance of the bare GCE was relatively large with the value of 500 Ω. The electrodes prepared after coated NH2-MIL-125(Ti) exhibited lower impedance (almost 200 Ω), which might be attributed to the porous structure of NH2-MIL-125(Ti) can improve the mass transfer efficiency. Again, corresponding to the TiO2/NC/GCE, the impedance value was further reduced to only 10 Ω. This changes implied that charge transfer rate was obviously increased after the carbonization of NH2-MIL-125(Ti), thereby making enhancement in conductivity of this TiO2/NC sensor.
Electrochemical behaviors of TBHQ
The electrochemical responses of TBHQ (100 µM) were investigated individually applying CV over bare GCE, NH2-MIL-125(Ti)/GCE and TiO2/NC/GCE. The CV curves are documented in Fig. 4a. A pair of well-defined peaks obtained at bare GCE and various modified electrodes, bare GCE exhibited lowest peak currents (Ipa=1.32 µA) with the largest peak-to-peak separation (ΔEp=182 mV). Further, at NH2-MIL-125(Ti)/GCE, high redox peak currents (Ipa=4.08 µA) with ΔEp of 88 mV were found, due to the porous structure of NH2-MIL-125(Ti) enhance surface areas. Additionally, at TiO2/NC/GCE, the oxidation current (Ipa=30.58 µA) further increased 23.2 times than the bare GCE, meanwhile, the ΔEp of TBHQ on TiO2/NC/GCE (55 mV) was much smaller than those on the other electrodes, suggesting that TiO2/NC/GCE had the best electron-transfer kinetics for the redox of TBHQ. Thus, TiO2/NC composites enabled excellent electrochemical catalytic activity for TBHQ oxidation.
Optimization of the pH value
The effect of the supporting electrolyte pH value (varied from 4.0 to 9.0) in the electrochemical reaction of TBHQ on TiO2/NC sensor applied using CV is depicted in Fig. 4b. The oxidation peaks of TBHQ (50 µM) in phosphate buffer solution (0.1 M) shifted to the negative potential signal as the pH increased, due to the protons involved in the electrochemical reactions of TBHQ (Ziyatdinova et al, 2020). A good linear relationship between pH and anodic voltage was revealed in Fig. 4c, Ep = 0.3869–0.0554 pH (R2 = 0.991). The slope 55.4 mV per pH closed to the theoretical value (59 mV per pH at 298 K), indicating that the number of electrons is equivalent to the number of protons involved in redox process of TBHQ (Ziyatdinova et al, 2020). Moreover, the acidity of phosphate buffer solution also had a remarkable effect on peak current value of TBHQ. The oxidation peak currents increased with the increase of pH values until it reached the maximum at pH value of 7.0 and then decreased when the pH value is further decreased. Therefore, the pH value of the phosphate buffer solution was set to 7.0.
Kinetics studies
The CV curves of TiO2/NC/GCE (Fig. 4d) were investigated at various scan rates (20–400 mV·s− 1) to analyze the kinetic process. As seen in Fig. 4e, it is clear that both Ipa and Ipc of TBHQ increased gradually with scan rates ranging from 20 to 400 mV·s− 1, and the equation satisfy: Ipa (µA) = 1.5299 v (V·s− 1) – 2.9653(R2 = 0.998) and Ipc (µA) =-1.3797 v (V·s− 1) + 3.4657 (R2 = 0.997). These results manifest that the electrochemical behavior on the surface of TiO2/NC/GCE is controlled by the diffusion of TBHQ (Chen et al, 2021).
Additionally, the anodic (Epa) and cathodic (Epc) peak potential vs the natural logarithm of v (lg v) of TBHQ (Fig. 4f) were linear ranging from 120–400 mV s− 1 and obtained the slope values of 0.0747 and − 0.0531. According to the following equations (Laviron, 1979):
$${E_{{\text{pa}}}}{\text{=}}{E^{0'}}+\frac{{2.3RT}}{{\left( {1 - \alpha } \right)nF}}\lg \nu$$
1
$${E_{{\text{pc}}}}{\text{=}}{E^{0'}} - \frac{{2.3RT}}{{\alpha nF}}\lg \nu$$
2
Where R-molar gas constant (J mol− 1 K− 1), T-the absolute temperature (K) and F-the Faraday’s constant (C mol− 1). Thus, the electron-transfer number (n) and the transfer coefficient (α) were calculated to be 1.87(close to 2) and 0.58, respectively. The result denoted that two-proton and two electron process was involved in the electro-oxidation of TBHQ on TiO2/NC/GCE.
The electron transfer rate constant (ks) was calculated based on Eq. (3):
$$\lg {k_\text{s}}=\alpha \lg (1 - \alpha )+(1 - \alpha )\lg \alpha - \lg \frac{{RT}}{{nF\nu }} - \alpha (1 - \alpha )\frac{{nF\Delta {E_{\text{p}}}}}{{{\text{2}}{\text{.303}}RT}}$$
3
Where, n is electron-transfer number of 2, ν is the scan rate of 100 mV·s− 1, and ΔEP = 51 mV. Also, ks can be calculated as 0.63 s− 1. The electron transfer rate constant (ks) of TiO2/NC/GCE was larger than the reported electrode (Wang et al, 2021), indicating that this modified electrode has higher catalytic capacity to promote electron transfer of TBHQ.
Analytical performance of TiO2/NC/GCE to TBHQ
Quantitative analysis was examined to determine TBHQ using the higher sensitive technique of differential pulse voltammetry (DPV) on TiO2/NC/GCE. As shown in Fig. 5a, the DPVs curves for various concentration of TBHQ were given on TiO2/NC/GCE in 0.1 M phosphate buffer (7.0). The catalytic current increased gradually with the concentration of TBHQ in the range of 0.05–100 µM and the linear equations were Ipa (µA) = 4.177C (µM) + 2.356 (R2 = 0.993, range of concentration was 0.05-2.0 µM) and Ipa (µA) = 0.4608C (µM) + 10.53 (R2 = 0.992, range of concentration was 2.0-100 µM), respectively. The detection limit (LOD) of 4 nM (S/N = 3), which was superior to those of the previously reported TBHQ-sensors (Table 1). Hence, such outstanding analytical performance was ascribed to its specific structure and composition of TiO2/NC composites. The TiO2 itself is a good electrocatalyst with the advantage of facile electron transfer. By engineering TiO2 with N-doped carbon material, the large surface area and porous structure would enlarge the electrocatalytic activity towards TBHQ.
|
Sensor |
Linear range(µM) |
LOD(µM) |
Ref. |
|---|---|---|---|
|
MIP/AuNPs/GCE |
0.08–100 |
0.07 |
Fan et al, 2018 |
|
MnO2/ERGO/GCE |
1-300 |
0.8 |
Cao et al, 2019 |
|
α-Al2O3/GCE |
0.5–250 |
0.027 |
Lima et al, 2018 |
|
MIP/ZC/GCE |
1–75 |
0.42 |
Ma et al, 2021 |
|
AuNPs/ GCE |
1.2–16.8 |
0.48 |
Lin et al, 2013 |
|
TiO2/NC/GCE |
0.05-2, 2-100 |
0.004 |
This work |
| MIP: Molecularly imprinted polymer. ERGO: reduced graphene oxide. ZC: nanoporous carbon. | |||
Reproducibility, stability, and interferences studies
To measure the reproducibility of TiO2/NC/GCE, five aforementioned TiO2/NC electrodes were used to detect 10 µM TBHQ by DPV method. The reasonable relative standard deviation (RSD) of peak currents about 2.5% was exhibited, concluding that TiO2/NC sensor has excellent reproducibility.
Also, the long-term stability of TiO2/NC sensor was checked by intermittent detection of TBHQ. The peak current for 10 µM TBHQ was maintained 98.3% and 97.9% of initial current after 5 days and 15 days, verifying the prominent long-term stability of the modified electrode.
The selectivity of the TiO2/NC/GCE was further evaluated, the impacts of some organic analytes (10-fold concentration of glucose, 2-fold concentration of L-aspartic acid, hydroquinone and ascorbic acid, 1-fold concentration of butylated hydroxyanisole) and various ions (50-fold concentration of K+, Na+, Mg2+, Ca2+) on the current signals of TBHQ was investigated by I-t method with the 10 µM TBHQ. As shown in Fig. 5b, these additives did not remarkable affect the amperometric current response of TBHQ, implying that TiO2/NC/GCE is suitable for the selective determination of TBHQ.
Analysis in real sample
To assess the practical potentials of the proposed method, the TiO2/NC/GCE was applied to detect TBHQ in edible oil (soybean oil and colza oil). Briefly, 5.0 g of the samples were dissolved in 50 mL of ethanol and centrifuged at 3000 rpm for 20 min, then the extract procedure was repeated four times. 200 µL of soybean oil or sesame oil samples were respectively diluted to 10 mL of 0.1 M phosphate buffer (pH 7.0) and analysed by a standard addition method (n = 4) using DPV technique. The results are listed in Table 2. The recovery was in the range of 98.5-101.2% with the RSD values below 4%. Meanwhile, the obtained results matched well with the HPLC method. All results validate the TiO2/NC/GCE can be applied in the measurement of TBHQ in edible oil samples.
|
Sample |
spiked (µM) |
Found (µM) |
RSDa (%) |
Recoveryb (%) |
HPLC method (µM) |
|---|---|---|---|---|---|
|
Soybean oil Colza oil |
0 |
0.95 ± 0.03 |
3.1 |
- |
0.87 ± 0.02 |
|
10 |
10.79 ± 0.45 |
4.2 |
98.5 |
10.98 ± 0.48 |
|
|
20 |
21.08 ± 0.67 |
3.2 |
100.6 |
20.65 ± 0.86 |
|
|
0 |
1.21 ± 0.03 |
2.5 |
- |
1.12 ± 0.04 |
|
|
10 |
11.34 ± 0.32 |
2.8 |
101.2 |
17.43 ± 0.67 |
|
|
20 |
20.96 ± 0.76 |
2.8 |
98.8 |
21.44 ± 0.73 |
|
| a Relative standard deviation for 3 successive measurements. b recovery (%) = (Cfound/Ctotal) × 100. | |||||
We have successfully construct N-doped TiO2–carbon nano-composites by the pyrolysis of NH2-MIL-125(Ti). The novel TiO2/NC sensor exhibited enhanced electrocatalytic ability towards TBHQ oxidation with low detection limit and large detection range. The excellent performance of TiO2/NC composites benefited from synergetic advantages of the highly porous structure, large surface area, excellent conductivity and electron transportation. Moreover, the constructed TiO2/NC sensor has been efficiently used to monitor TBHQ in real oils. This facile strategy may provide a valuable reference to fabricate other MOF based material sensors.
Data Availability
The authors declare that all data supporting the findings of this study are available within the article and its supplementary information file.
Compliance with Ethical Standards
Funding This work was supported by National Natural Science Foundation of China (21904004), the Top-Notch Talent Program for Outstanding Young Talents of Anhui Province (gxbjZD2021070), the stable talent program of Anhui Science and Technology University, and the Student's Platform for Innovation and Entrepreneurship Trainning Program of China (202010879047).
Conflict of Interest Jing Tang declares that she has no conflict of interest. Jie Li declares that he has no conflict of interest. Tianna Liu declares that she has no conflict of interest. Wenjing Tang declares that she has no conflict of interest. Nali Li declares that he has no conflict of interest. Shengbiao Zheng declares that he has no conflict of interest. Jiahao Guo declares that he has no conflict of interest. Changchun Song declares that he has no conflict of interest.
Ethical Approval This article does not contain any studies with human participants or animals performed by any of the authors.
Consent to Participate Informed consent is not applicable in this study.
Author Contribution
Jing Tang: Conceptualization, Investigation, Formal analysis, Methodology, Writing - original draft, Funding acquisition. Jie Li: Methodology, Writing - original draft. Tianna Liu: Data curation. Wenjing Tang: Methodology. Nali Li: Data curation. Shengbiao Zheng: Formal analysis. Jiahao Guo: Writing - review & editing. Changchun Song: Conceptualization, Investigation, Formal analysis, Methodology.
- Arif D, Hussain Z, Sohail M et al (2020) A Non-enzymatic Electrochemical Sensor for Glucose Detection Based on Ag@TiO2@ Metal-Organic Framework (ZIF-67) Nanocomposite. Front Chem 8:573510. http://doi:10.3389/fchem.2020.573510
- Almeida ES, Portela FM, Sousa RMF et al (2011) Behaviour of the antioxidant tert-butylhydroquinone on the storage stability and corrosive character of biodiesel. Fuel 90: 3480-3484. http:// doi:10.1016/j.fuel.2011.06.056
- Boyce MC, Spickett EE (1999) Separation of food grade antioxidants (synthetic and natural) using mixed micellar electrokinetic capillary chromatography. J Agric Food Chem 47: 1970-1975. https://doi.org/10.1021/jf980959u
- Cao W, Wang Y, Zhuang QF et al (2019) Developing an electrochemical sensor for the detection of tert-butyl hydroquinone. Sensor Actuat B: Chem 293:321-328. https://doi.org/10.1016/j.snb.2019.05.012
- Caramit RP, Andrade AGdF, de-Souza JBG et al (2013) A new voltammetric method for the simultaneous determination of the antioxidants TBHQ and BHA in biodiesel using multi-walled carbon nanotube screen-printed electrodes. Fuel 105: 306-313. https://doi.org/10.1016/j.fuel.2012.06.062
- Casanovas J, Ricart JM, Rubio J et al (1996) Origin of the Large N 1s Binding Energy in X-ray Photoelectron Spectra of Calcined Carbonaceous Materials. J Am Chem Soc 118: 8071-8076. https://doi.org/10.1021/ja960338m
- Corma A, Díaz-Cabañas MJ, Martínez-Triguero J et al (2002) A Large-Cavity Zeolite with Wide Pore Windows and Potential as an Oil Refining Catalyst. Nature 418: 514-517. https://doi.org/10.1038/nature00924
- Chen JS, Liu H, Qiao SZ, Lou XW (David) (2011) Carbon-supported ultra-thin anatase TiO2 nanosheets for fast reversible lithium storage. J Mater Chem 21: 5687-5692. https://doi.org/10.1039/C0JM04412A
- Chen YL, Xie Y, Sun X et al (2021) Tunable construction of crystalline and shape-tailored Co3O4@TAPB-DMTP-COF composites for the enhancement of tert-butyl hydroquinone electrocatalysis. Sensor Actuat B: Chem 331: 129438. https://doi.org/10.1016/j.snb.2021.129438
- Dan-Hardi M, Serre C, Frot T et al (2009) A New Photoactive Crystalline Highly Porous Titanium(IV) Dicarboxylate. J Am Chem Soc 131: 10857-10859. https://doi.org/10.1021/ja903726m
- Eskandani M, Hamishehkar N, Dolatabadi JEN (2014) Cytotoxicity and DNA damage properties of tert-butylhydroquinone (TBHQ) food additive. Food Chem 153: 315-320. http://doi: 10.1016/j.foodchem.2013.12.087
- Fan LM, Hao QQ, Kan XW (2018) Three-dimensional graphite paper based imprinted electrochemical sensor for tertiary butyl hydroquinone selective recognition and sensitive detection. Sensor Actuat B: Chem 256: 520-527. https://doi.org/10.1016/j.snb.2017.10.085
- Farajmand B, Esteki M, Koohpour E et al (2017) Reversed-phase single drop microextraction followed by high-performance liquid chromatography with fluorescence detection for the quantification of synthetic phenolic antioxidants in edible oil samples. J Saudi Chem Soc 40: 1524-1531. https://doi.org/10.1002/jssc.201601205
- Gan T, Zhao AX, Wang SH et al (2016) Hierarchical triple-shelled porous hollow zinc oxide spheres wrapped in graphene oxide as efficient sensor material for simultaneous electrochemical determination of synthetic antioxidants in vegetable oil. Sensor. Actuat B: Chem 235:707-716. https://doi.org/10.1016/j.snb.2016.05.137
- Gu YF, Cheng K, Wu YN et al (2016) Metal–Organic Framework-Templated Synthesis of Bifunctional N-Doped TiO2–Carbon Nanotablets via Solid-State Thermolysis. ACS Sustainable Chem Eng 4: 6744-6753. https://doi.org/10.1021/acssuschemeng.6b01716
- Guo Z, Cheng JK, Hu Z et al (2014) Metal-organic frameworks (MOFs) as precursors towards TiOx/C composites for photodegradation of organic dye. RSC Adv 4: 34221-34225. https://doi.org/10.1039/C4RA05429F
- Hirose M, Takesada Y, Tanaka H et al (1998) Carcinogenicity of antioxidants BHA, caffeic acid, sesamol, 4-methoxyphenol and catechol at low doses, either alone or in combination, and modulation of their effects in a rat medium-term multi-organ carcinogenesis model. Carcinogenesis 19: 207-212. https://doi.org/10.1093/carcin/19.1.207
- Jeong SH, Kim BY, Kang HG et al (2005) Effects of butylated hydroxyanisole on the development and functions of reproductive system in rats. Toxicology 208: 49-62. https://doi.org/10.1016/j.tox.2004.11.014
- Kim SN, Kim J, Kim HY et al (2013) Adsorption/catalytic properties of MIL-125 and NH2-MIL-125. Catal Today 204:85-93. https://doi.org/10.1016/j.cattod.2012.08.014
- Laviron E (1979) General expression of the linear potential sweep voltammogram in the case of diffusionless electrochemical systems. J Electroanal Chem Interf Electrochem 101: 19-28. https://doi.org/10.1016/S0022-0728(79)80075-3
- Li D, Kaner RB (2008) Graphene-Based Materials. Science 320: 1170-1171. doi: 10.1126/science.1158180.
- Li H, Zhou H (2012) Enhancing the performances of Li-ion batteries by carbon-coating: present and future. Chem Commun 48:1201-1217. https://doi.org/10.1039/C1CC14764A
- Li J, Bi YL, Sun SD et al (2017) Simultaneous analysis of tert-butylhydroquinone, tert-butylquinone, butylated hydroxytoluene, 2-tert-butyl-4-hydroxyanisole, 3-tertbutyl-4-hydroxyanisole, α-ocopherol, γ-tocopherol, and δ-tocopherol in edible oils by normal-phase high performance liquid chromatography. Food Chem 234: 205-211. https://doi.org/10.1016/j.foodchem.2017.04.176
- Li XH, Antonietti M (2013) Metal nanoparticles at mesoporous N-doped carbons and carbon nitrides: functional Mott–Schottky heterojunctions for catalysis. Chem Soc Rev 42: 6593-6604. https://doi.org/10.1039/C3CS60067J
- Li XR, Yang XC, Xue HG et al (2020) Metal–organic frameworks as a platform for clean energy applications. Energy Chem 2: 100027. https://doi.org/10.1016/j.enchem.2020.100027
- Lima AP, Souza RC, Silva MNT et al (2018) Influence of Al2O3 nanoparticles structure immobilized up on glassy-carbon electrode on the electrocatalytic oxidation of phenolic compounds. Sensors Actuators B Chem 262: 646-654. https://doi.org/10.1016/j.snb.2018.02.028
- Lin XY, Ni YN, Kokot S (2013) Glassy carbon electrodes modified with gold nanoparticles for the simultaneous determination of three food antioxidants. Anal Chim Acta 765:54-62. https://doi.org/10.1016/j.aca.2012.12.036
- Liu S, Wang Z, Yu C et al (2013) A Flexible TiO2(B)-Based Battery Electrode with Superior Power Rate and Ultralong Cycle Life. Adv Mater 25: 3462-3467. https://doi.org/10.1002/adma.201300953
- Ma JN, Liu W, Liang XH et al (2017) Nanoporous TiO2/C composites synthesized from directly pyrolysis of a Ti-based MOFs MIL-125(Ti) for efficient microwave absorption. J Alloy Compd 728: 138-144. https://doi.org/10.1016/j.jallcom.2017.08.274
- Ma Y, Li JY, Wang LS (2021) Porous carbon derived from ZIF-8 modified molecularly imprinted electrochemical sensor for the detection of tert-butyl hydroquinone (TBHQ) in edible oil. Food Chem 365: 130462. https://doi.org/10.1016/j.foodchem.2021.130462
- Mahadik MA, Woo AG, Selvaraj D et al (2017) Fabrication of A/R-TiO2 composite for enhanced photoelectrochemical performance: solar hydrogen generation and dye degradation. Appl Surf Sci 426: 833-843. https://doi.org/10.1016/j.apsusc.2017.07.179
- Monteiro TO, Neto SY, Damos FS et al (2016) Development of a photoelectrochemical sensor for detection of TBHQ antioxidant based on LiTCNETiO2 composite under visible LED light. J Electroanal Chem 774:36-41. https://doi.org/10.1016/j.jelechem.2016.05.013
- Lu X, Li S, Guo W et al (2021) A covalent organic polymer-TiO2/Ti3C2 heterostructure as nonenzymatic biosensor for voltammetric detection of dopamine and uric acid. Microchim Acta 188: 95. https://doi.org/10.1007/s00604-021-04755-8
- Negar G, Susan H, Ayman OSEK (2007) Chemoprotective and carcinogenic effects of tert-butylhydroquinone and its metabolites. Curr Drug Metab 8:1-7. http://doi: 10.2174/138920007779315035
- Qiu B, Xing M, Zhang J (2014) Mesoporous TiO2 Nanocrystals Grown in Situ on Graphene Aerogels for High Photocatalysis and Lithium-Ion Batteries. J Am Chem Soc 136: 5852-5855. https://doi.org/10.1021/ja500873u
- Rowsell JLC, Yaghi OM (2004) Metal–organic frameworks: a new class of porous materials. Micropor Mesopor Mater 73: 3-14. https://doi.org/10.1016/j.micromeso.2004.03.034
- Sanidad KZ, Sukamtoh E, Wang WC et al (2016) Oxidative conversion mediates anti proliferative effects of tert-butyl hydroquinone: structure and activity relationship study. J. Agric. Food Chem. 2016:64 (19): 3743.
- Shi XD, Zhang ZA, Du K et al (2016) Anatase TiO2@C composites with porous structure as an advanced anode material for Na ion batteries. J Power Sour 330: 1-6. https://doi.org/10.1016/j.jpowsour.2016.08.132
- Tang J, Hui ZZ, Hu T et al (2022) A sensitive acetaminophen sensor based on Co metal–organic framework (ZIF-67) and macroporous carbon composite. Rare Met 41: 189-198. https://doi.org/10.1007/s12598-021-01709-0
- Tang J, Wang W, Zheng SB et al (2016) Electrochemical Determination of Tert-Butyl Hydroquinone in Edible Oil Samples at Poly (Crystal Violet) Modified Glassy Carbon Electrode. Food Anal Methods 9: 3044-3051. http://doi: 10.1007/s12161-016-0495-5
- Tang J, Zheng SB, Jiang SX et al (2021) Metal organic framework (ZIF-67)-derived Co nanoparticles/N-doped carbon nanotubes composites for electrochemical detecting of tert-butyl hydroquinone. Rare Met 40: 478-488. https://doi.org/10.1007/s12598-020-01536-9
- Wang P, Lang J, Liu D et al (2015) TiO2 embedded in carbon submicron-tablets: synthesis from a metal-organic framework precursor and application as a superior anode in lithium-ion batteries. Chem Commun 51: 11370-11373. https://doi.10.1039/c5cc01703c
- Wang Y, Wang YY, Zhang L et al (2019) Core–shell-type ZIF-8@ZIF-67@POM hybrids as efficient electrocatalysts for the oxygen evolution reaction. Inorg Chem Front 6: 2514-2520. https://doi.org/10.1039/C9QI00798A
- Wang Z, Yang F, Zheng H et al (2014) Voltammetric determination of TBHQ at a glassy carbon electrode surface activated by in situ chemical oxidation. Analyst 139: 3622-3628. https://doi.org/10.1039/C4AN00325J
- Zeng L, Zheng C, Xia L et al (2013) Ordered mesoporous TiO2–C nanocomposite as an anode material for long-term performance lithium-ion batteries. J Mater Chem A 75: 4293-4299. https://doi.org/10.1039/C3TA10275K
- Ziyatdinova G, Guss E, Budnikov H (2020) Amperometric sensor based on MWNT and electropolymerized carminic acid for the simultaneous quantification of TBHQ and BHA. J Electroanal Chem 859:113885. https://doi.org/10.1016/j.jelechem.2020.113885
- Ziyatdinova G, Os'kina K, Ziganshina E et al (2015) Simultaneous determination of TBHQ and BHA on a MWNT-Brij® 35 modified electrode in micellar media. Anal. Methods 7: 8344-8351. https://doi.org/10.1039/C5AY01973G
Scheme 1 is available in Supplementary Files section.
No competing interests reported.
- floatimage1.jpeg
the fabrication of TiO2/NC sensor and electrochemical determination of TBHQ