Identification of DEGs and enrichment analysis in samples from COPD patients and normal smokers
DEGs in lung tissue samples from COPD patients and normal smokers were analyzed using the “Limma” package. As shown in Fig. 1A, 39 significantly upregulated genes and 313 significantly downregulated genes were identified. GO analysis of the 352 DEGs showed that genes were mainly involved in biological processes (BP) associated with the cytoskeleton and cytokines (Fig. S1A). The results of GSEA analysis showed that “ALANINE_ASPARTATE_AND_GLUTAMATE_METABOLISM”, “HEMATOPOIETIC_CELL_LINEAGE”, “INTESTINAL_IMMUNE_NETWORK_FOR_IGA_PRODUCTION”, “KEGG_PANTOTHENATE_AND_COA_BIOSYNTHESIS”, “PRIMARY_IMMUNODEFICIENCY”, “PROXIMAL_TUBULE_BICARBONATE_RECLAMATION”, “RENIN_ANGIOTENSIN_SYSTEM”, and “TASTE_TRANSDUCTION” pathways were enriched in the COPD group compared with normal smokers (Fig. S1B). Taken together, these results identify potential biomarkers and abnormal signaling pathways involved in the progression of COPD.
Immune landscape associated with the characteristics of influenza infection
Functional enrichment analysis showed that immune related pathways were enriched in the COPD group compared with the normal smokers’ group. To explore the differential immune landscape in COPD patients and normal smokers, lung tissue microarray data from the GSE76925 dataset were analyzed. CIBERSORTx was used to estimate the fraction of 22 types of immune cells among the GSE76925 samples. CIBERSORTx is a website tool that enables evaluation of the relative proportion of immune cells in tissues via a deconvolution algorithm. The distribution of 22 types of immune cells in GSE76925 samples is shown in Fig. S2A. The immune landscape results showed that T cells CD8, T cells follicular helper, T cells gamma delta, and macrophages M0 were upregulated, whereas T cells CD4 memory activated, monocytes, and eosinophils were downregulated in the lung tissues of COPD patients (Fig. S2B). Next, we analyzed the relationship between immune infiltration and clinical features. As shown in Fig. S2C, the infiltration level of neutrophils (r = 0.231, P = 0.004), monocytes (r = 0.226, P = 0.005), T cells CD4 memory resting (r = 0.174, P = 0.032), eosinophils (r = 0.170, P = 0.037), and T cells CD4 memory activated (r = 0.168, P = 0.039) were positively correlated with FEV1/FVC; the infiltration level of T cells follicular helper (r = -0.217, P = 0.007), T cells CD8 (r = -0.267, P < 0.001) and macrophages M0 (r = -0.300, P < 0.001) were negatively correlated with FEV1/FVC. Moreover, the infiltration levels of eosinophils (r = 0.219, P = 0.007) and T cells CD4 memory resting (r = 0.181, P = 0.026) were positively correlated with FVC% predicted; the infiltration levels of T cells gamma delta (r = -0.160, P = 0.049), macrophages M0 (r = -0.215, P = 0.008), and T cells CD8 (r = -0.260, P = 0.001) were negatively correlated with FVC1% predicted; the infiltration levels of T cells gamma delta (r = -0.160, P = 0.049), macrophages M0 (r = -0.215, P = 0.008), and T cells CD8 (r = -0.260, P = 0.001) were negatively correlated with FVC1% predicted (Fig. S2D).
Identification of key modules via WGCNA
To identify the key genes related to the clinical features of COPD patients, co-expression network analysis was performed via WGCNA using the GSE76925 dataset. Clinical features (age, sex, BMI, FEV1/FVC, and FVC1% predicted) were obtained from the GSE76925 dataset. The parameters were established by setting the soft-threshold power to 3 (scale free R2 = 0.906) and the height was set to 0.25. The association between the modules and clinical features was determined by assessing the correlation between module eigengene (ME) values and clinical features. Data were visualized using heat map profiles. The results shown in Fig. 1B indicated that the brown module was the most closely correlated with COPD (Pearson’s coefficient = 0.36, P = 6E-06), FEV1/FVC (Pearson’s coefficient = 0.38, P = 1E-06), and FVC1% predicted (Pearson’s coefficient = 0.4, P = 5E-07). Next, 536 genes from the brown module were selected as hub genes for GO and KEGG analyses.
In the brown module, T cells and leukocyte function, cytokine receptor, and cytokine activity were the most frequent pathways in the GO analysis (Fig. S3A). “Cytokine-cytokine receptor interaction,” “Hematopoietic cell lineage” and “Viral protein interaction with cytokine and cytokine receptor” were enriched in the KEGG pathway analysis (Fig. S3B).
Selection and validation of hub genes
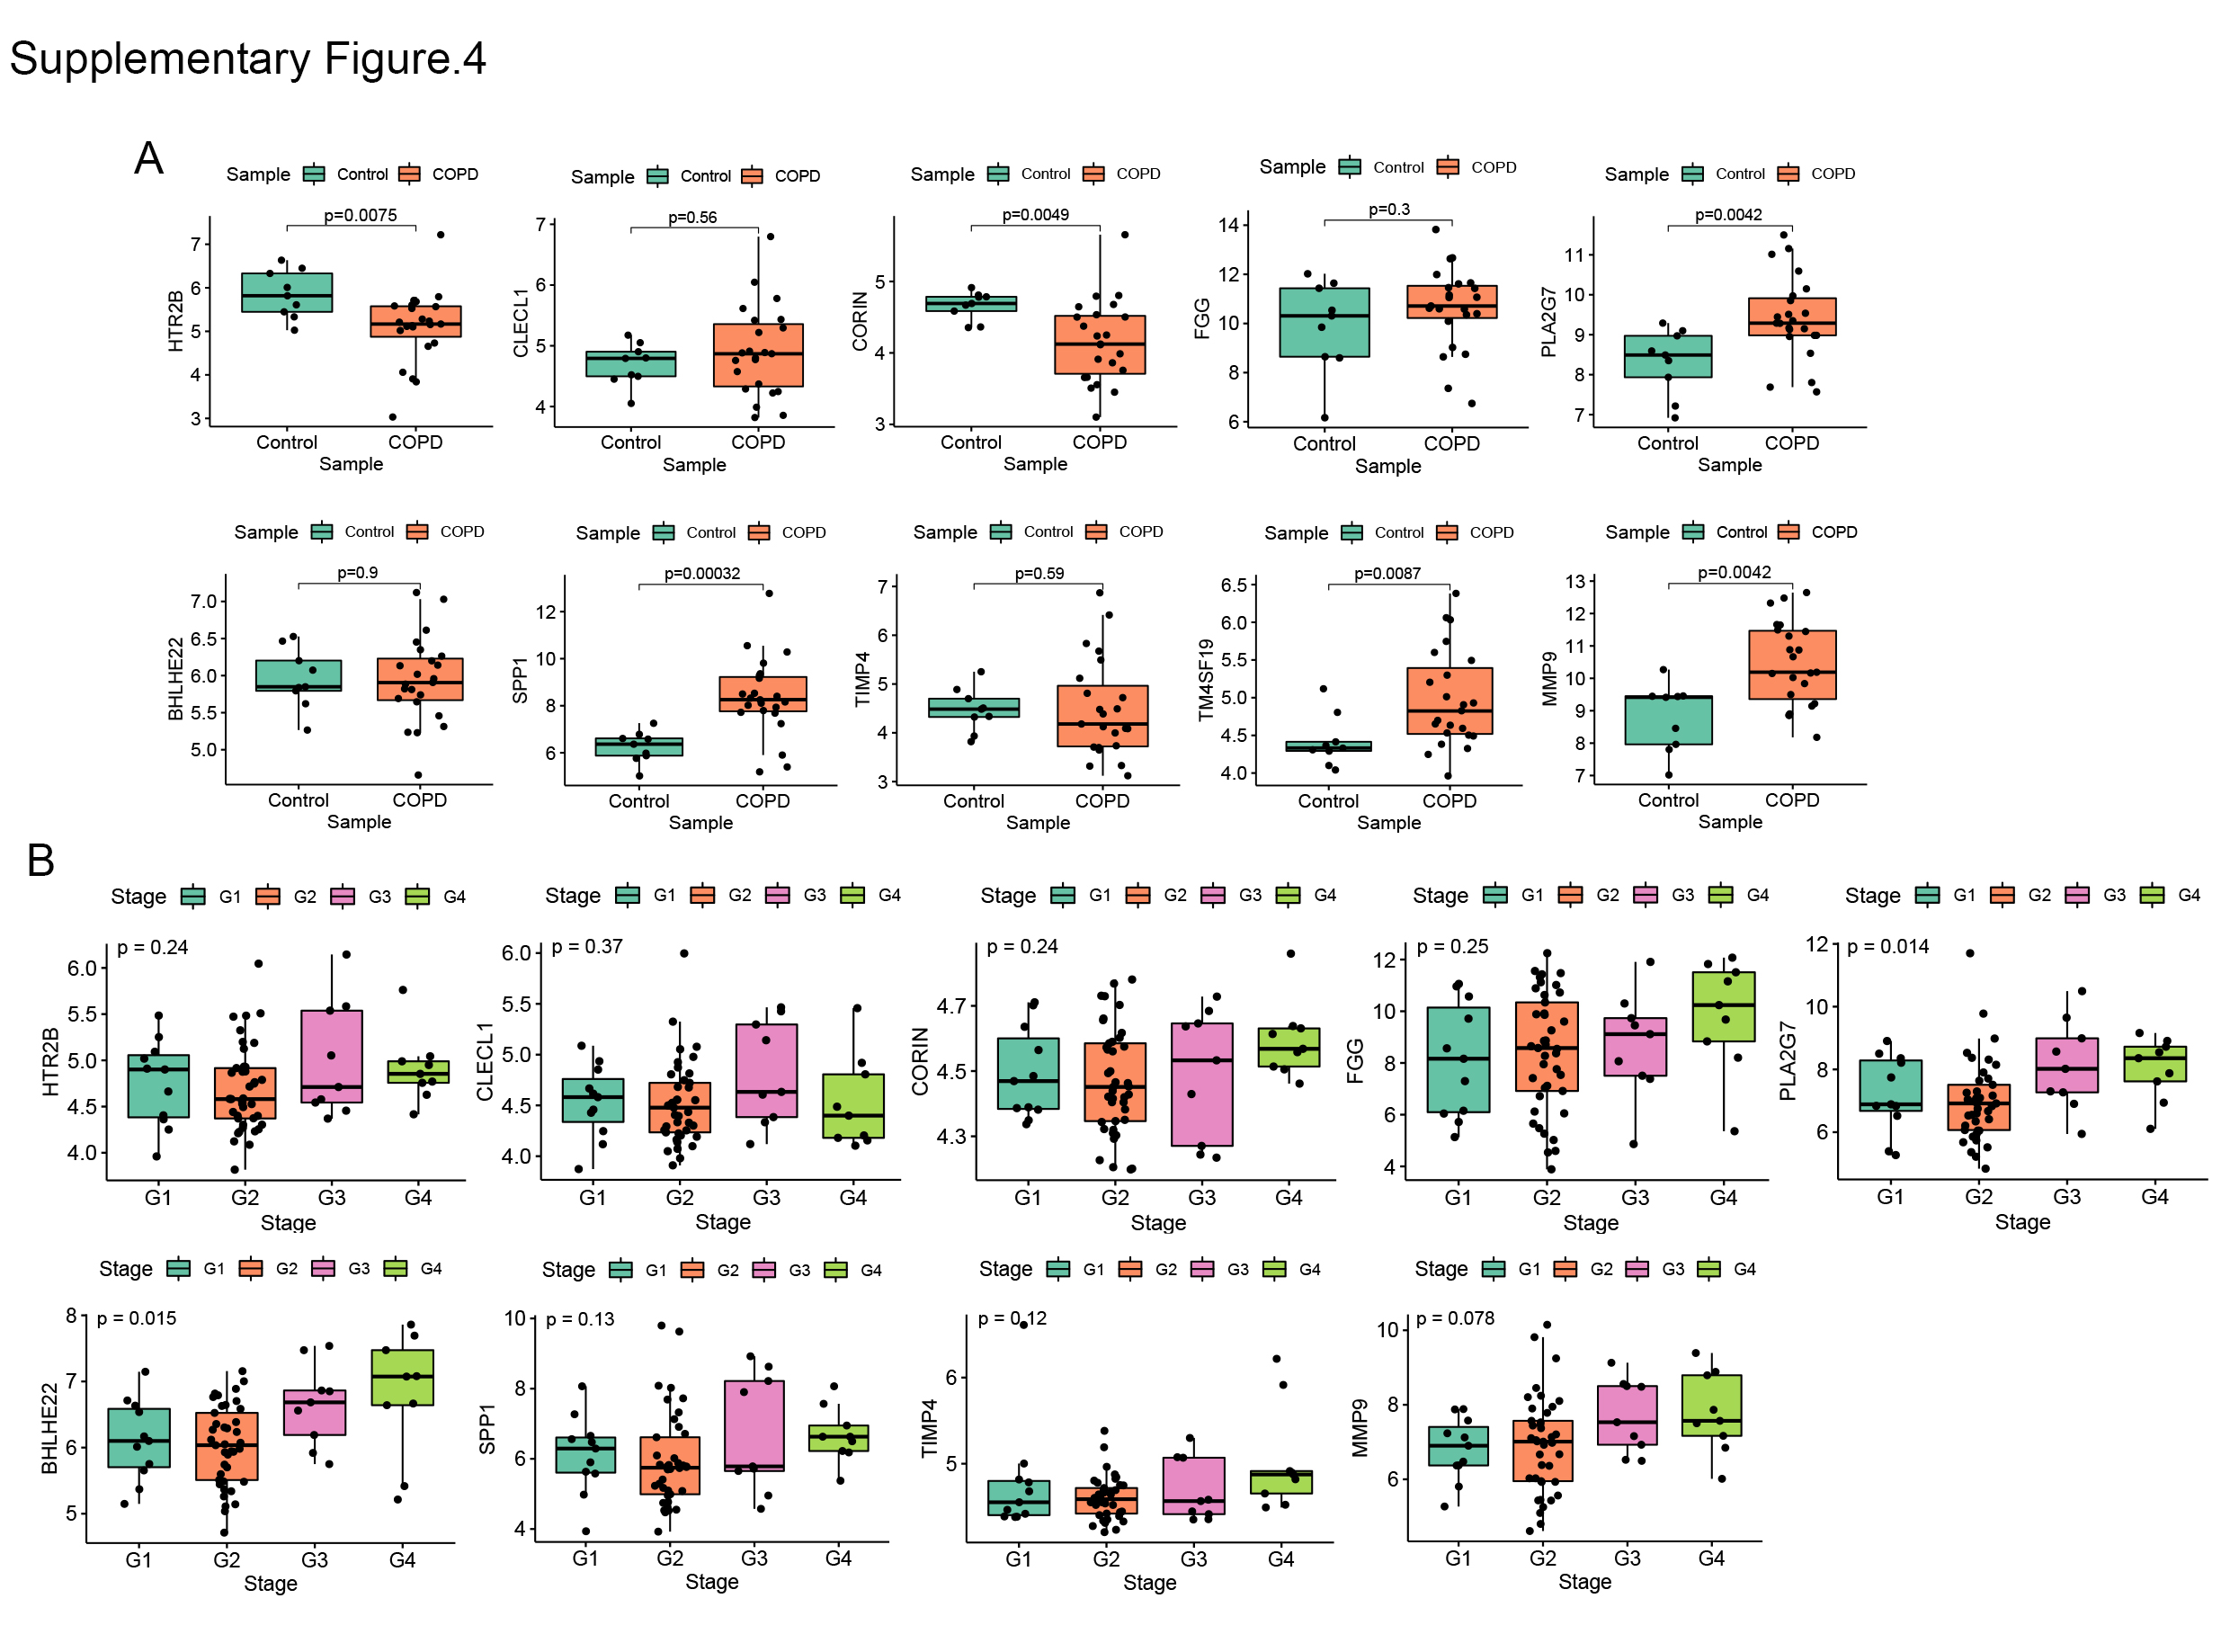
To screen stable and robust hub genes accurately, ten commonly changed genes shared by the brown module and upregulated DEGs were selected (Fig. 1C). These included HTR2B, CLECL1, FGG, CORIN, PLA2G7, BHLHE22, SPP1, TIMP4, TM4SF19, and MMP9. The expression levels of these ten genes were first validated in GSE38974 (nine smokers and 26 smokers with COPD). As shown in Fig. S4A, the expression levels of HTR2B (P = 0.0075) and CORIN (P = 0.0049) were significantly lower in COPD lung tissues than in the smoker controls; the expression levels of PLA2G7 (P = 0.0042), SPP1 (P = 0.00032), TM4SF19 (P = 0.0087), and MMP9 (P = 0.0042) were significantly higher in COPD lung tissues than in the smoker controls. Next, the relationship between these ten genes and the GOLD stage was verified in GSE69818 (11 patients with GOLD stage 1, 41 patients with GOLD stage 2, nine patients with GOLD stage 3, and nine patients with GOLD stage 4). As shown in Fig. S4B, the expression levels of PLA2G7 (P = 0.014) and BHLHE22 (P = 0.015) increased significantly with advanced GOLD stage. PLA2G7 was selected for subsequent analyses because it showed significant differences in two independent datasets.
Functional analysis and validation of PLA2G7
The relationship between PLA2G7 and the clinical characteristics of COPD patients was analyzed. As shown in Fig. S5A, age (r = -0.19, P = 0.048), BMI (r = -0.24, P = 0.011), and FEV1/FVC (r = -0.29, P = 0.002) were negatively correlated with PLA2G7 expression. To elucidate the potential regulatory mechanism of PLA2G7 in COPD, the GSE76925 dataset was used for GSEA analysis. COPD samples were divided into groups according to the median expression level of PLA2G7. As shown in Fig. S5B, immune-related pathways “ANTIGEN PROCESSING AND PRESENTATION”, “B CELL RECEPTOR SIGNALING PATHWAY”, “CHEMOKINE SIGNALING PATHWAY”, “INTESTINAL IMMUNE NETWORK FOR IGA PRODUCTION”, “T CELL RECEPTOR SIGNALING PATHWAY” and “TOLL LIKE RECEPTOR SIGNALING PATHWAY” were enriched in the PLA2G7-high group. Therefore, we analyzed the relationship between immune infiltration and PLA2G7 expression. As shown in Fig. S5C, the infiltration levels of macrophages M0 (r = 0.543, P < 0.001), dendritic cells resting (r = 0.452, P < 0.001), macrophages M1 (r = 0.282, P = 0.003), T cells gamma delta (r = 0.277, P = 0.003), and macrophages M2 (r= 0.217, P = 0.022) were positively correlated with PLA2G7 expression; the infiltration levels of neutrophils (r = -0.196, P = 0.039), T cells CD4 memory resting (r = -0.227, P = 0.017), Monocytes (r = -0.270, P = 0.004), NK cells resting (r = -0.325, P < 0.001), and dendritic cells activated (r = -0.376, P < 0.001) were negatively correlated with PLA2G7 expression.
To investigate whether PLA2G7 is differentially expressed in other tissues relevant to COPD, we analyzed a series of datasets. As shown in Fig. S5D, PLA2G7 expression was significantly higher in the blood of COPD patients than in that of non-COPD controls (including 94 patients with COPD and 42 non-COPD controls from GSE42057 and 49 patients with COPD and 29 non-COPD controls from GSE56766). Given the significant correlation between PLA2G7 expression level and macrophages, we analyzed the differences in PLA2G7 expression in alveolar macrophages from bronchoalveolar lavage fluid (BALF). As shown in Fig. S5E, PLA2G7 expression was significantly higher in alveolar macrophages from COPD samples than in never-smokers and smokers (including 22 patients with COPD, 24 never-smokers, and 42 smokers from GSE130928; and 12 patients with COPD, 24 never-smokers, and 34 smokers from GSE13896). These results showed that PLA2G7 expression was higher in different body fluid specimens from COPD patients than in those from normal controls, indicating that PLA2G7 may function in immune regulation by regulating macrophages.
Validation of the PLA2G7 encoded protein Lp-PLA2 in clinical samples
To verify the clinical application potential of the PLA2G7 gene, the levels of proteins encoded by the PLA2G7 gene were detected using ELISA in clinical samples. Lp-PLA2, which is encoded by the PLA2G7 gene, is a plasma enzyme bound to lipoproteins. The serum concentration of Lp-PLA2 was higher in COPD patients than in healthy smokers (Fig. 2A). In addition, the expression of Lp-PLA2 increased in correlation with Gold stage (Fig. 2B). Next, we analyzed the relationship between the expression of Lp-PLA2 and the clinical characteristics of COPD patients. Analysis of the relationship between Lp-PLA2 level and pulmonary function showed that Lp-PLA2 level was negatively correlated with FEV1/FVC (r = -0.528, P < 0.001) (Fig. 2C).
The Global Average of COPD (GOLD) states that in addition to the assessment of lung function, a comprehensive assessment of the clinical symptoms, acute exacerbations, and comorbidities of COPD is required. The CAT and the mMRC are widely used to assess the clinical symptoms of COPD patients[11]. We analyzed the relationship between Lp-PLA2 levels and the CAT and mMRC scores. As shown in Fig. 2D, Lp-PLA2 levels were positively correlated with the mMRC score (r = 0.339, P < 0.001) and CAT score (r = 0.339, P < 0.001).
Malnutrition has negative effects on exercise and muscle function, and on lung function, as well as increasing exacerbations and mortality[12]. Body mass index (BMI) and fat-free mass index (FFMI) are used to assess nutritional status, and are decreased in COPD patients[13]. As shown in Fig. 2E, Lp-PLA2 levels were negatively correlated with BMI (r = -0.312, P = 0.002) and FFMI (r = -0.336, P = 0.002).
Collectively, these findings suggested that Lp-PLA2 increased significantly in correlation with disease progression and is an important biomarker in COPD patients.
Lp-PLA2 level effectively evaluates exercise tolerance.
Reduced exercise tolerance is one of the main clinical features of COPD. It increases the frequency of acute exacerbations and all-cause mortality, leading to a poor prognosis[1]. The 6-min walk distance (6MWD) assesses the exercise tolerance of COPD patients[2]. As shown in Fig. 3A, Lp-PLA2 levels were negatively correlated with 6MWD (r = -0.578, P = 0.002).
Because finding an appropriate site is difficult (a 30 m flat course is required, and the layout of the track may influence the performance), the 6MWT is not common in primary medical institutions. We found that Lp-PLA2 level is highly correlated with 6MWD. Therefore, we explored whether Lp-PLA2 level can predict a poor 6MWD. The sit-to-stand test (STST) is widely used to indirectly evaluate exercise tolerance[14]. Therefore, we compared the efficacy of the STST and Lp-PLA2 levels for predicting a poor 6MWD. As shown in Fig. 3B, the AUC of the 5STS score predicting a poor 6MWD (6MWD <350 m) was 0.728, the AUC of the 30STS score was 0.750, and the AUC of the Lp-PLA2 level was 0.724. The cutoff values of Lp-PLA2 level, 5STS, and 30STS scores were 133.7 ng/mL, 23.5, and 6.42, respectively. The sensitivity and specificity for predicting a poor 6MWD based on the cutoff value of the Lp-PLA2 level were 88.57% and 61.40%, respectively. The sensitivity and specificity for predicting a poor 6MWD according to the cutoff value of the 5STS score were 71.43% and 65.38%, respectively. The sensitivity and specificity for predicting a poor 6MWD based on the cutoff value of the 30STS score were 82.14% and 55.56%, respectively. These results suggested that the predictive power of Lp-PLA2 level is higher than that of STST modes, suggesting its potential for use in research and clinical practice.
Construction of a nomogram to predict impaired exercise tolerance
We combined the traditional clinical features of age, grade, FEV1/FVC, BMI, CAT score, and mMRC score with Lp-PLA2 level to construct a nomogram model to predict impaired exercise tolerance (6MWD <350 m) in COPD patients (Fig. 4A). Calibration plots were used to visualize the performances of the nomograms. The calibration plot confirmed the performance of our model (Fig. 4B). To demonstrate the clinical advantages of the nomogram model, we compared the ROC curves of the single variables against the nomogram curve. The nomogram model had the highest AUC value (Fig. 4C). Finally, decision curve analysis (DCA) was used to confirm the findings. Compared with a single clinical variable, the combined nomogram model showed the highest efficacy for 6MWD <350 m predictions (Fig. 4D). These methods confirmed the clinical utility of our nomogram model.