The aim of this study is to evaluate the effects of age on LA and diastolic function assessed by LA TDI online by spectral pulse, and to compare them with age-related variations of LA SRI and parameters of diastolic function in a population of healthy adults.
As previously reported, 91 healthy adults, aged between 18 and 74 years old, were prospectively evaluated in two health centers between April 2016 and March 2018. None of the subjects had a known history of cardiovascular disease, high blood pressure, dyslipidemia, diabetes, electrocardiographic alterations or was under cardiovascular medical treatment. A complete color Doppler echocardiogram was performed.
§ Echocardiogram and Cardiac Doppler
An ultrasound machine Vivid S5 or 7 (GE Medical System, Horten, Norway), equipped with a 3 MHz variable frequency transducer, was used for all of the echocardiographic evaluations. Cardiac diameters were measured according to the recommendations of the ASE (15). The M mode was used to measure the diameters of LA and LV. Volumes of LA were measured in a single-plane apical four-chamber view, using the method of discs.
Transmitral flow velocities were obtained by pulsed wave Doppler echocardiography, in an apical four-chamber view. Mitral flow parameters measured included peak velocities during early diastole (E) and late diastole (A), their ratio (E/A ratio), and E-wave deceleration time (DTE).
TDI online by spectral pulse of the septal and lateral mitral annulus was performed, and peak of the systolic wave S' (Sma S´, Lma S´), early filling wave E' (Sma E´, Lma E´) and late filling wave A' (Sma A´, Lma A´) were measured. The E/e' average ratio was calculated.
Parameters used to define normal diastolic function were: Lma E' > 10 cm/s, Sma E' > 7 cm/s, average E/e' < 14, peak velocity of tricuspid regurgitation < 2.8 m/s, LA volume indexed < 34 ml/m2 (16).
For the analysis of LA function by TDI and SRI, lateral wall was obtained in the apical four chamber view and divided subjectively into three portions: basal segment, mid segment and atrial roof (Figure 1A). TDI by spectral pulse measures were taken online, in apnea, at the end of expiration, with a sample volume of 2 mm and trying to maintain an angle less than 15°; gain and filter were adjusted to avoid saturation of the image. Three consecutive measurements of basal and mid segments were performed and the best spectral image of each segment was selected for the analysis; and peak velocities of this waves were measured, the atrial roof was excluded from the measurements.
The Echo Pac software v 108.1.5 (GE Healthcare) was used for the analysis of two-dimensional SRI by speckle tracking. In an apical four-chamber view, the endocardial surface of the LA was manually drawn, using a single cardiac cycle and the R wave as a reference point. A region of interest was automatically generated, and manually tracked, frame by frame, to maintain its position within the LA wall, to ensure that the regions of interest would follow the cardiac movement throughout cardiac cycle. The LA was divided into six segments automatically; the limits of the basal and mid segments of the lateral wall of the LA were manually adjusted to resemble the division made by TDI, excluding the atrial roof and the remaining segments. All the images were obtained at an average frame rate of 63 +/-6.
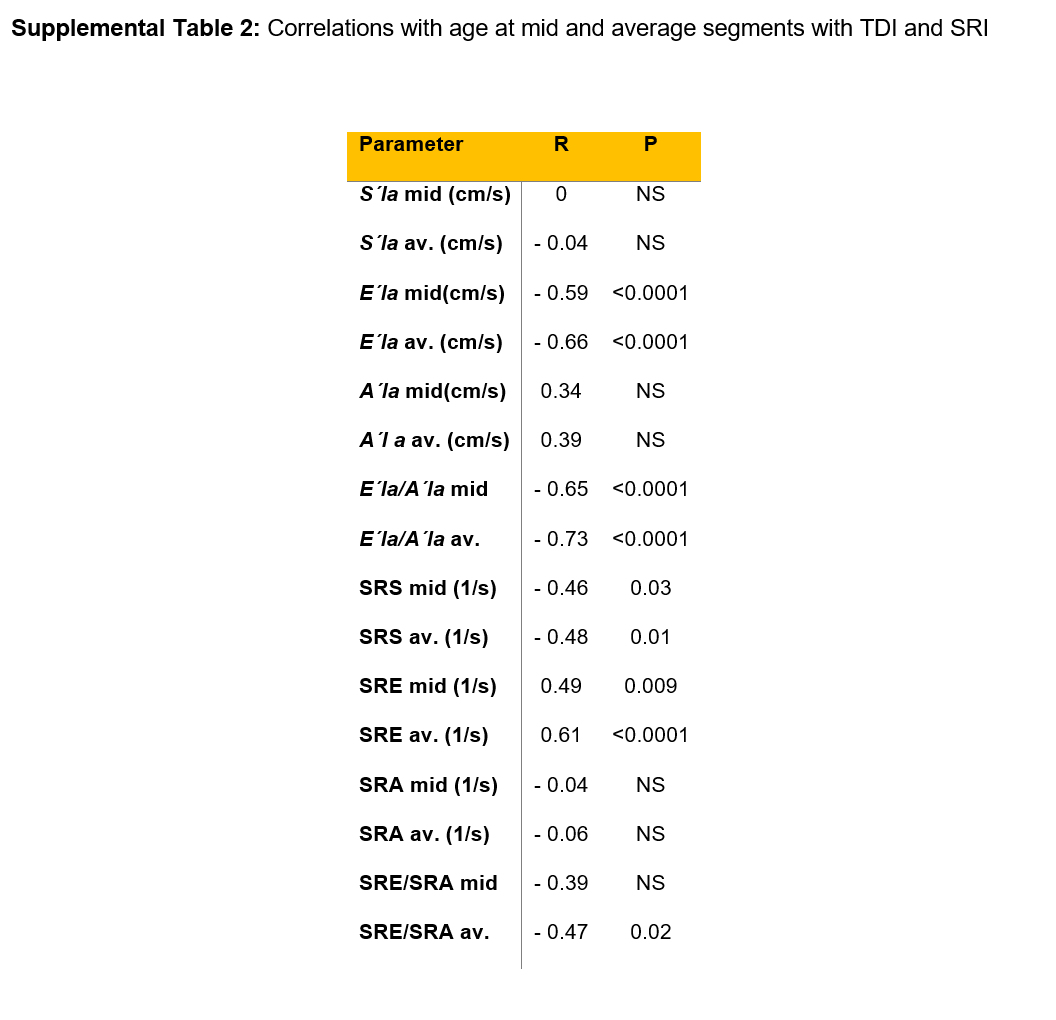
With both techniques, TDI and SRI, three waves were obtained: a first positive wave, S'la and SRS (reservoir phase), and two negative waves, E'la and SRE (conduit phase) and A'la and SRA (atrial systole) respectively (Figure 1B and 1C). The ratios between E'la/A'la and SRE/SRA were analyzed. Basal and mid segments were analyzed, as well as the average between basal and mid segments when both curves could be measured. Segments that did not have adequate image quality were excluded from the analysis. Likewise other authors (17), we did not include the interatrial septum since it is very thin and largely made up of collagen tissue.
Repeatability and reproducibility
In 30 randomly selected subjects TDI measurements were performed independently and blindly by two operators, with a difference of ten minutes between studies. Repeatability was evaluated by comparing the first two measurements performed by the first operator; reproducibility was evaluated by comparing the first measurement of each of the operators. Although the average of the multiple measures performed by each operator would inform lower values of variability, comparison of a single measurement was chosen for external validity reasons, given that in clinical practice the operator would not be expected to make multiple measurements and average them for report.
STATISTICAL ANALYSIS
Absolute frequency and percentage were used as frequency measures for qualitative variables; median (Md) and interquartile range (IQR) were used as frequency and dispersion measures for quantitative variables, given that the variables under study did not present normal distribution. We analyzed the distribution of the variables in the total population and by subgroups of age (< 30, 31-40, 41-50, 51-60 and ≥ 61 years). The comparisons between subgroups of age were performed with the Kruskal-Wallis method. Considering age as a continuous variable, correlation analyzes were performed to evaluate the existence of linear association between age and various parameters, using Spearman's correlation method with Holm's method adjustment. After log transformation of the abnormally distributed variables, univariable and multivariable linear regression analyzes were performed to assess association between TDI parameters and clinical predictors. Variables associated in univariate analyses were entered in multivariable models. Intra and inter-observer variabilities were assessed using the Bland-Altman method, and presented as mean difference (MD), standard deviation (SD) and coefficient of repeatability (COR), calculated as 2 x SD of the differences in repeated measurements (18). In the hypothesis tests a statistical significance level of 0.05 was used, rejecting the null hypothesis if the p-value was lower than this level. All data analysis was performed using R Core Team 2018 software (R: A language and environment for statistical computing, R Foundation for Statistical Computing, Vienna, Austria. URL https://www.R-project.org/).