3.1 Fourier transform infrared spectroscopy (FT-IR) and Thermo-gravimetric analysis (TGA)
The FT-IR analysis was confirmed the presence of additives and surfactant (mehraj njc). FT-IR spectra of all as synthesized silver monoliths are shown in Fig. 1A(a-d). Frequencies at 2900 cm− 1 and 1100cm− 1 due to C-O [34] and C-H stretching were clearly observed in the synthesized sample shows the presence of Brij52 in the synthesized catalyst. Peaks are shifting to lower wavenumber (2845 cm− 1 due to C-H stretching, 1467 cm− 1 due to C-H bending or scissoring, 1351 cm− 1 due to C-H rocking, 1112 cm− 1 due to C-O stretching, 725 cm− 1 due to C-H rocking) as additives are added to synthesis protocol confirms the complexation of the metal with EO groups of the Brij52 by hydrogen and electrostatic bonding [35]. Broadening of OH stretching peak at 3455 cm− 1 and decrease in the density of CO peak at 1100cm− 1 with comparison to Brij52 shown in Fig. 1A (a) showed the complexation of metal with surfactant and additives. In Fig. 1A(d) band in the range between 4000cm− 1 and 1500cm− 1 are absent which clearly confirms the complete removal of additives like dextran and surfactant after calcinations.
Thermo gravimetric study of monolith Ag/Brij52/Dex/TiO2 NPS is shown in Fig. 1B Mass loss of 5% was observed from room temperature to 143°C due to removal of moisture followed by the mass loss 29.5% was observed at 143°C to 245°C due to decomposition of surfactant Brij52 followed by the mass loss 27.259% observed at 245°C to 342°C due to the removal of dextran. Further, 3% mass loss was observed at 340°C to 430°C to because carbon is oxidized to Co2. At the end about 35.241% Ag/TiO2 was left.
3.2 Powder X-ray diffractometer (PX-RD) Study
Figure 2(a-c) showed the XRD- pattern of (a)Ag/Brij52 (b)Ag/Brij52/Dex and (c)Ag/Brij52/Dex/TiO2NPS monoliths. Figure 1(a-c) diffraction pattern of calcined samples depict diffraction peaks (2θ values) at 38.14º, 44.33º,64.50º, 77.46º, and 81.61º with d-spacing values 2.35Å, 2.04Å, 1.44Å, 1.23Å, and 1.17Å which correspond to [111], [200], [220], [311], and [222], lattice planes respectively of silver monoliths with a face centred cubic lattice structure (JCPDS NO.- 4.783). All monoliths showed crystalline nature.
Table 1
Powder X-ray diffractometer (PX-RD) study and lattice parameters of Ag monoliths.
| Monolith | d-spacing (angstrom) | Crystalline Size(nm) | Pore diameter (Avg.)nm | Pore Volume cc/g | Surface area m 2g−1 |
| Ag/Brij52 | 1.6510 | 20.0891 | 4.351 | 0.001 | 0.783 |
| Ag/Brij52/Dex | 1.6521 | 22.0078 | 4.352 | 0.003 | 5.075 |
| Ag/Brij52/Dex/TiO2NPS | 1.6502 | 23.3297 | 4.35 | 0.010 | 17.819 |
3.3 Scanning electron microscopic (SEM) studies
Figure 3(a) represents the SEM micrograph of monolith Ag/Brij52 in which pore of average diameter of 3 µm is clearly seen. On careful observation, AgNPs of size 100 nm is observed at the surface of the monolith. Pore size of about 5 µm with AgNPs were seen in case of Ag/Brij52/Dex. Monolith (Fig. 5(b)). Dextran is a structural directing agent causes to modify the surface. Figure 5(d&e) is for monolith Ag/Brij52/Dex/TiO2 NPS, in which TiO2NPs of size 400nm is observed in the monolith. Figure 5(f) showed the EDAX of TiO2NPs in Ag/Brij52/Dex/TiO2 NPs monolith.
3.4 Transmission electron microscopic (TEM) studies
Figure 4(a,b) represents the TEM micrographs of Ag/Brij52/Dex/TiO2NPs monolith in which TiO2NPs of size 20 nm is observed. Figure 4(c) showed the HRTEM image of TiO2 NPs with lattice fringe with lattice spacing of 0.343 nm which corresponds to the inter planer spacing of [101] lattice plan. Figure 4(d) showed the selected area electron diffraction (SAED) pattern of monolith Ag/Brij52/Dex/TiO2NPs which clearly confirmed the crystalline nature as confirmed by PXRD study also.
3.5 N2 adsorption/desorption studies of silver monoliths
BET (Brunauer-Emmett-Teller) technique measured the surface area of the monoliths while BJH(Barrett-Joyner-Halenda) approach was used to determine the pore size distribution. Adsorption isotherms of Ag/Brij52, Ag/Brij52/Dex and Ag/Brij52/Dex/TiO2NPS showed were given in Fig. 5(A-C). Monolith Ag/Brij52/Dex/TiO2NPS attributed the maximum surface area amongst all is a result of considerable TiO2NPs density and dispersion in the corresponding monolith. Data are given in Table 1.
3.6 Heterogeneous catalytic study of FSB F dye
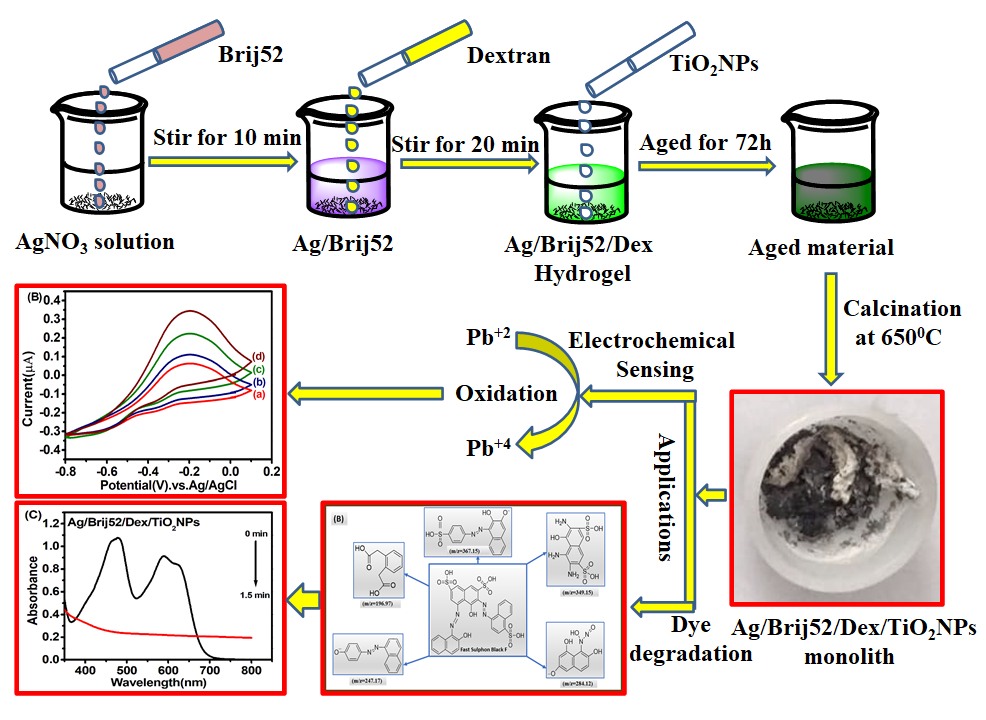
Fast sulphon black F, an organic dye was treated to test the photocatalytic activity of as synthesized silver monoliths Ag/Brij52, Ag/Brij52/Dex, and Ag/Brij52/Dex/TiO2NPs in presence of NaBH4 by taking 150 ppm solution of FSB-F dye and 0.05M aqs. NaBH4 solution [30] using of 0.001g of Ag monoliths for UV study on UV-Vis spectrophotometer (Labindia analytical UV 3092 UV/VIS spectrophotometer). FSB-F dye showed two peaks at 480nm and 600nm [36] at room temperature. When dye was treated with 0.05 M aqueous solution of NaBH4, both peaks were unaffected by time which showed that the degradation did not take place in the absence of a catalyst. The degradation of FSB-F dye were taken place in presence of 0.001g of catalyst using 0.05M NaBH4 solution and complete degradations were taken place in 120, 70 and 1.5 min. in case of Ag/Brij52, Ag/Brij52/Dex, and Ag/Brij52/Dex/TiO2NPs catalysts respectively (Fig. 6A, B & C) and the colour of the dye mixture was changed from black to colourless. Under such condition, the absorption peaks were decreased and finally disappeared.
The absorption peaks were shifted on the addition of 0.001g of catalyst (silver monoliths) to the reaction mixture in the presence of 0.05M NaBH4, as a result reaction mixture changed colour gradually from black to colourless and the absorption peaks were decreased and at the end disappeared during the reaction, which shows the complete degradation of dye .when we studied degradation reaction of silver monoliths by measuring the absorbance with wavelength and found to decrease the intensity with time.
The rate constants values of degradation of dye were determined by plotting graphs between ln(C/C0) Vs Time for catalysts Ag/Brij52, Ag/Brij52/Dex and Ag/Brij52/Dex/TiO2NPs and found to be 0.025, 0.120 and 1.021 min− 1 respectively (Fig. 7 (A), (B)). Kinetic data were given in Table 2. Optimum amount of catalyst Ag/Brij52/Dex/TiO2NPs was determined by varying the amount of catalyst from 0.001 to 0.01g in 0.05M NaBH4 and found to be 0.001g at higher concentration of catalyst (Fig. 7C), the reaction mixture became turbid which made less penetration of light into reaction mixture, hence reaction rate decreased.
Recyclability and stability of as synthesised catalyst have significant importance in industry hence, recyclability test was made. Catalyst Ag/Brij52/Dex/TiO2NPs took 1.7 min. upto first 4 cycles followed by 2, 2.3, 2.5 min to 5th, 6th, 7th, 8th cycles respectively shown in (Fig. 7D). At higher cycles, products and reactants get adsorbed on the active sites of the catalyst and also loss of mass of catalyst due to handling.
Table 2
Reduction data of degradation of fast sulphon black F(FSB-F) dye using different catalysts.[37]
| S.No. | Catalyst | Radiation | Catalyst Amount | Time(min) | Reducing Agent | Reference |
| 1. | Iron Oxide (Fe2O3) Nanoparticles | UV-Visible | | 60 min | NaBH4 | [30] |
| 2. | BiVO4 | UV-Visible | 100 mg | 30 min | H2O2 | [38] |
| 3. | Ag/Brij52 | UV-Visible | 0.001g | 120 min | NaBH4 | Present |
| 4. | Ag/Brij52/Dex | UV-Visible | 0.001 g | 70 min | NaBH4 | Present |
| 5. | Ag/Brij52/Dex/TiO2NPS | UV-Visible | 0.001 g | 1.5 min | NaBH4 | Present |
3.7 Gas Chromatography - mass Spectroscopic Study
Gas chromatography-mass spectroscopic study was made to investigate the degradation of Fast Sulphon Black F dye on GC-MS (JEOL, TOF). The reaction mixture of dye was put in UV-VIS light for sufficient time to degrade it completely then the pre-treatment of the reaction mixture was made by mixing it in dichloromethane (DCM) and separated in separating funnel to remove water. Now the DCM containing mixture was taken in a beaker and then added sodium sulphate (Na2SO4) for about 2 min. then DCM was removed by putting the layer in rotor. At the end, the sample was dried in oven at 60ºC and such sample was used for GCMS studies at reaction time of 1.5 min.
It is clear from the GCMS graph Fig. 8 (A) that the plots between intensity against m/z come at 197, 247.17, 284.12, 349.15 and 367.16 which appraised the presence of various compounds as shown in Fig. 8 (B).
3.8 Electrochemical sensing activities against Pb2+
For the fabrication of various modified graphite paste electrodes (GPE)such as bare/GPE, Ag/Brij52/GPE, Ag/Brij52/Dex/GPE, and Ag/Brij52/Dex/TiO2NPs/GPE, graphite powder and paraffin oil were mixed at a fix ratio 60/25/15 percentage graphite powder/paraffin oil/nanoporous material in a small beaker. Now a little bit of paste was filled up at the tip of the polyethylene syringe which have diameter of 3.0 mm then copper wire was used from the back of the polyethylene syringe for the electrical connection. Smoothening of the surface of the modified electrodes were made using weighing paper. As prepared electrodes were undergone for ultrasonication for 30s to dry them at room temperature. Activation of electrodes were done by applying 5 cycles of cyclic potential using Pb(NO3)2 solution at scan rate of 50 mVs− 1 at potential range − 1 to + 1 V.
0.165 g of Pb(NO3)2 was dissolved in 100 mL of distilled water. 0.1M KNO3 solution was used as supporting electrolyte while 0.1M acetate buffer solution was used to maintain the pH at 5.0.[39]
For optimization, cyclic voltammograms of all modified electrodes bare/GPE, Ag/Brij52/GPE, Ag/Brij52/Dex/GPE, and Ag/Brij52/Dex/TiO2NPS/GPE were made on cyclic voltammetry at scan rate of 50mVs− 1 using 2mM K3Fe(CN)6 probe with 0.1M KCl solution[39](Fig. 9A(d→a)).
Anodic and cathodic peak separation ∆Ep values for Bare/GPE, Ag/Brij52/GPE, Ag/Brij52/Dex/GPE and Ag/Brij52/Dex/TiO2NPs were 0.727, 0.717, 0.712 and 0.707 V respectively attributing the quasi-reversible one electron redox behaviour of Fe(CN)63−/4−.
The increase of ∆Ep shows the increase of conductivity of electrodes recommended a rapid and untroubled charge transfer. Randles-Servick equation is used to determine the surface area of electrodes and found to be 1.600, 3.191, 3.989 and 4.787 m2g− 1 for bare/GPE, Ag/Brij52/GPE, Ag/Brij52/Dex/GPE and Ag/Brij52/Dex/TiO2NPS /GPE respectively.
Ipa = 0.4463(F3/RT)1/2 n3/2 A˳D˳1/2 C ʋ1/2 --------- (1).
Where Ipa is anodic peak current, n is number of electron transferred, A˳ is surface area of the electrode (cm2), D˳ is diffusion coefficient, c is concentration of Fe(CN)63−/4−, ʋ is scan rate, R is molar gas constant (8.314 JK− 1mol− 1), F is faraday`s constant (96480 cmol− 1) and T is temperature.
Figure 9(B), showed the CV curves of 0.005M(5mM) Pb(NO3)2 in 0.1M KNO3 as supporting electrolyte in 0.1M acetate buffer(pH-5). @ (a)GPE (b)Ag/Brij52/GPE (c) Ag/Brij52/Dex/GPE (d) Ag/brij52/Dex/TiO2NPs/GPE electrode at scan rate 50 mVs− 1. All modified electrodes showed good electrochemical response for Pb(NO3)2 in the potential window using as shown however, electrode Ag/Brij52/Dex/TiO2NPS /GPE attributed a significant response hence this electrode was chosen for the present study. Figure 9(C), gave the electrochemical response using modified electrode Ag/Brij52/Dex/TiO2NPS/GPE in 5 mM Pb(NO3)2 in 0.1M KNO3 in acetate buffer at different scan rate 5 to 100 mVs− 1. A plot between Ip(µA) Vs ν1/2 (R = 0.9994) confirmed the reversible nature of CV with diffusion controlled. Figure 10 (D) showed the CV curves of Pb(NO3)2 at varying concentration from 1µM to 20µM @ of sensor Ag/brij52/Dex/TiO2/GPE in 0.1M KNO3.
Figure 10(A) attributed the differential pulse voltammograms of Pb(NO3)2 solution with concentration varied from 1mM to 20mM @ Ag/brij52/Dex/TiO2/GPE sensor using 0.1M KNO3. Figure 10(B) denotes the amperometric response of Pb(NO3)2 solution @ concentration varied from 0.1µM to 10µM using Ag/Brij52/Dex/TiO2NPs/GPE sensor using 0.1M KNO3 solution. The linear regression relation was Ip(µA) = 8.243(µg mL− 1)–3.645 with correlation coefficient 0.9986. The limit of detection (LOD = 3 s/m) and limit of quantization (LOQ = 10 s/m) were determined 0.000623 µg mL− 1(0.623 ng mL− 1) and 0.0002.65 µg mL− 1(0.265 ng mL− 1) respectively. Six sensors Ag/Brij52/Dex/TiO2NPs/GPE were used at the ambient conditions to check the efficiency in Pb(NO3)2 solution at present experimental conditions, the same electrode was chosen for repeated 10 successive amperograms and relative standard deviation was less than 2% which confirmed that the sensor Ag/brij52/Dex/TiO2/GPE is highly reproducible could be used for number of analysis. The sensor was showing 99% current response after 45 days attributing its stability and efficiency. In all, the de-electronation of Pb(NO3)2 was made successfully and accurately with lowest values of LOD and LOQ. The whole analysis is simple, cost effective, fast and environmentally benign.