Sampling and seed collection
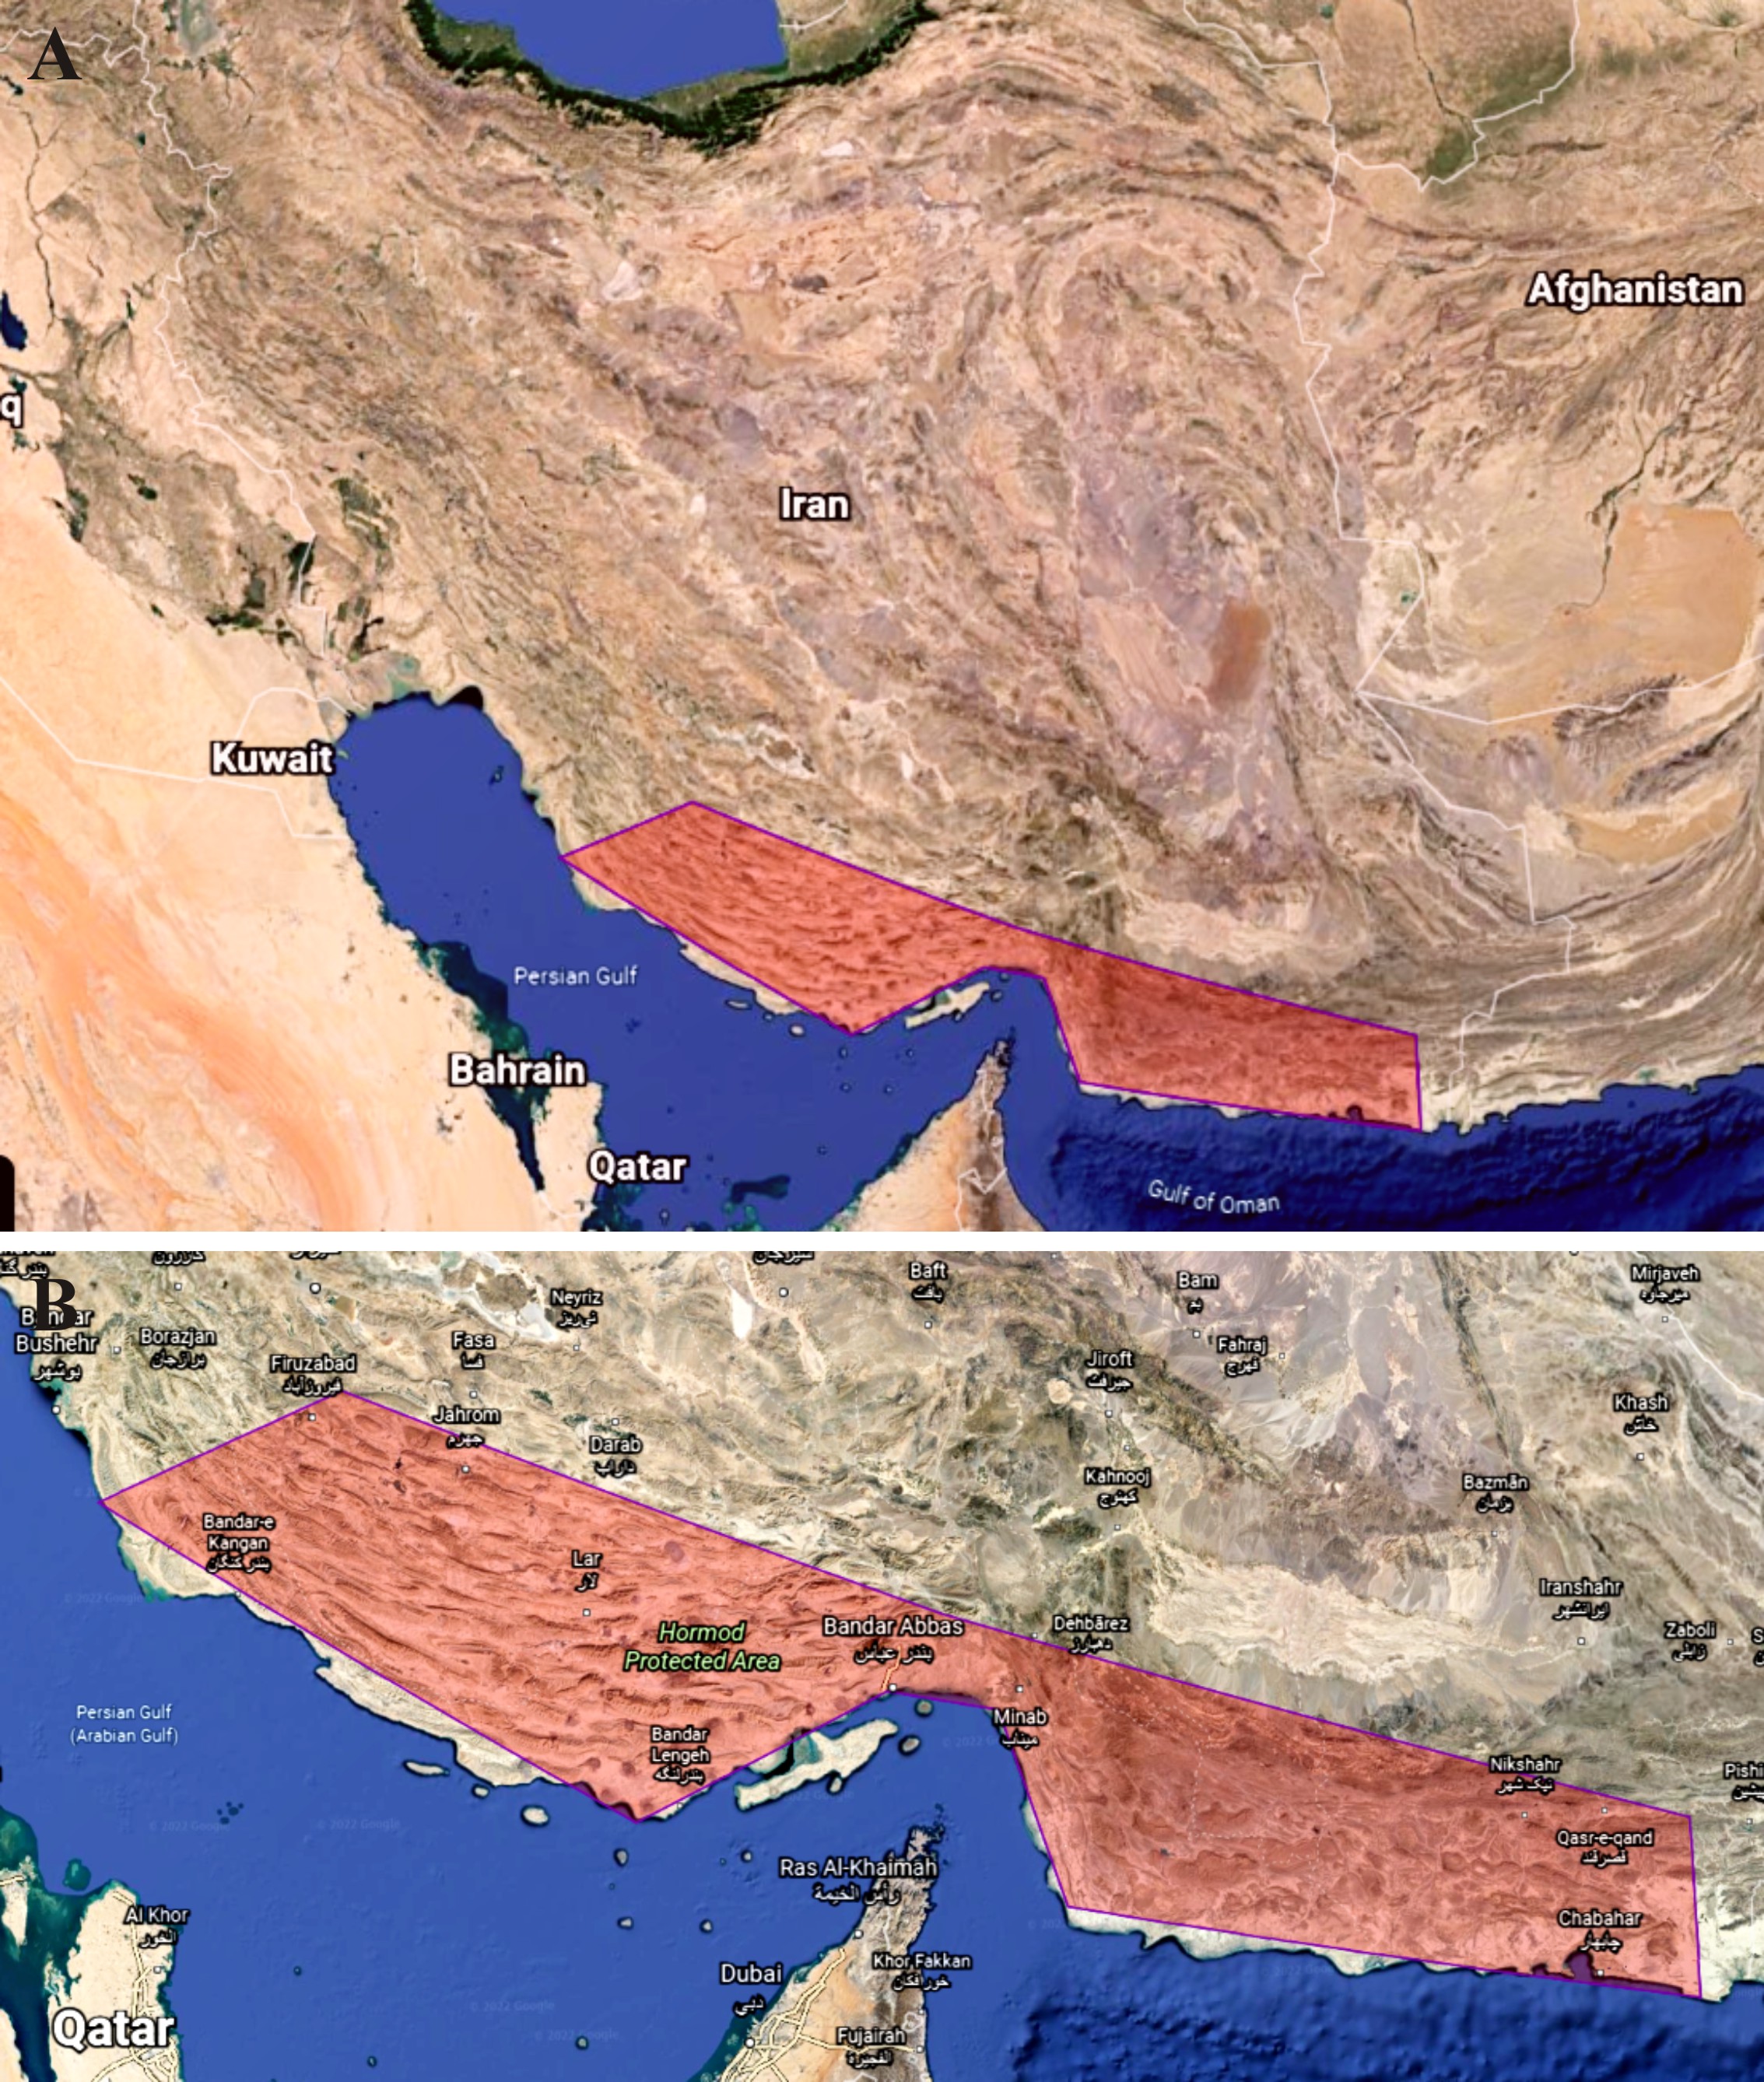
Ripe fruits (capsules) containing mature seeds of H. lippii were handpicked in March 2020 from natural rangeland population in Lamerd region, Fars province, Iran (27°46ʹN, 53°57ʹE; Altitude: 944). The seeds of three plants, H. almeriense, Cistus laurifolius, and C. ladanifer were purchased from a Spanish Company (SEMILLAS CANTUESO). The seeds were manually cleaned, surface sterilized with 0.5% sodium hypochlorite for 1-2 min, followed by washing three times with sterile distilled water for 5 min. Mechanical scarification of the seed coat was achieved by moderate abrasion the seeds for 10 sec between two sandpaper (Zaidi et al. 2010). Five seeds were planted at a depth of approximately 1 cm in each section of the plastic seedling tray containing sterile peat-perlite (1:1 v/v). After seeding the well-developed seedlings were transplanted into 1000-cm3 polyethylene pots (20cm high and 12cm diameter) containing a mixture of sterilized peat-vermiculate-sand (2:1:1 v/v) in a greenhouse with 25±1°C temperature, 50-60% relative humidity and 12 h light/12 h dark and irrigated twice a week with tap water (Slama et al. 2010, Jamali and Banihashemi 2013a).
Soil analysis
Soil samples taken from desert truffles producing sites under fruiting bodies of T. pinoyi, are processed in a laboratory to determine the physico-chemical characteristics of the soil, by analyzing several parameters: pH level, electrical conductivity, organic carbon, soil texture, potassium and total phosphorus and nitrogen, total limestone (%), and the presence of mineral salts (Walkley and Black 1934, Bremner and Mulvaney 1982, Loeppert and Suarez 1996, Thomas 1996).
Morphological identification
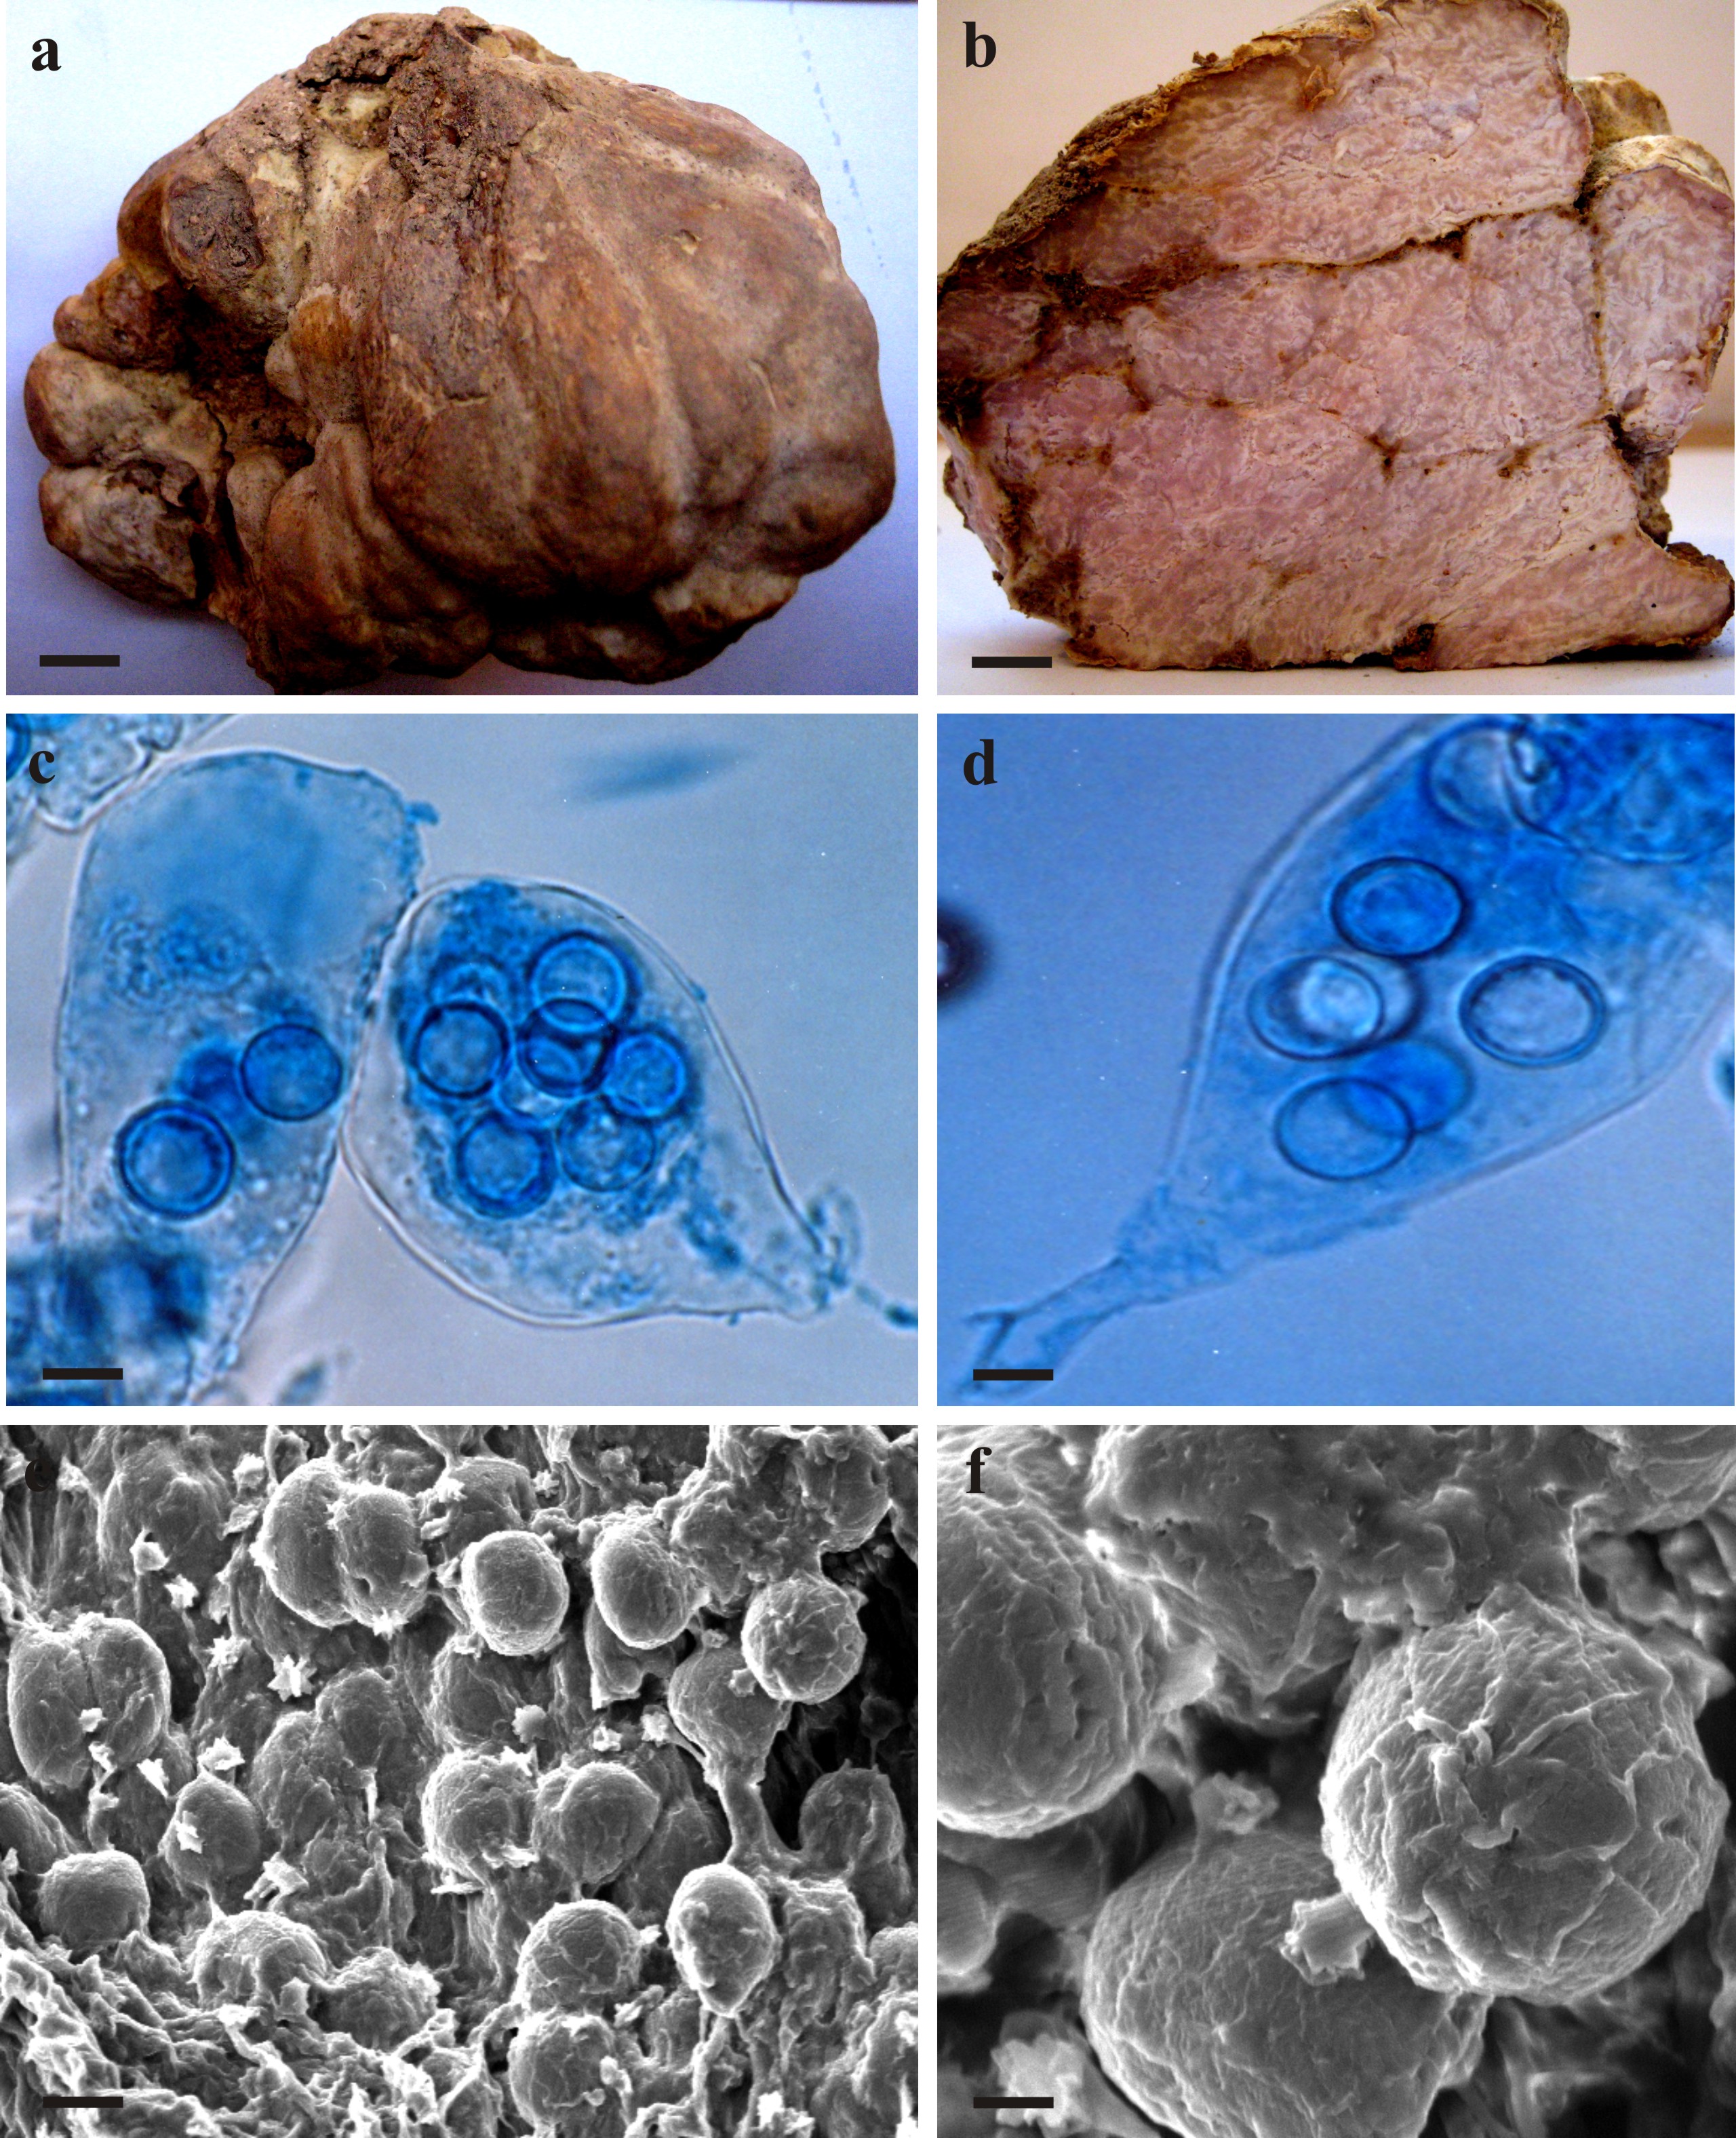
T. pinoyi fruiting bodies were collected in March 2020, from South and Southeast of Iran (Table 1).Microscopic examinations were carried out in tap water, 5% aqueous KOH, Melzer’s reagent and cotton blue in lactic acid. The photomicrographs were made with an Olympus model BX-51 microscope to capture images. Scanning electron microscopy (SEM) images were taken with an AIS2300C microscope. Samples were mounted in concentrated NH₄OH 30% and allowed to soak for 10 min. They were then dehydrated with increasing concentrations of ethanol (10, 20, 40, 60, 80 and 100%) for 10 min each. After dehydration, the samples immersed in pure acetone for 30 min. The dried samples were sputter-coated with gold-palladium (Moreno et al. 2000b).
Inoculation
A spore suspension of the well matured T. pinoyi ascocarps was prepared by blending the finely-chopped fruit bodies with a blender, until the spores were released (Zitouni-Haouar et al. 2014). Two months after transplanting, twenty plants of each plant species were inoculated with the spore suspension containing 0.1 g of fruit body in 5 ml of sterilized distilled water and with a concentration of approximately 1×10⁷ spores (Morte et al. 2006). The ascospore suspension was directly applied in contact with the roots. The inoculated plants grew in the greenhouses with 25±1°C temperature, 50-60% relative humidity and 12 h light/12 h dark for 6 to 9 months. Control plants without mycorrhizal inoculums were grown under the same condition.
Microscopic analysis of roots
Fungal colonization was assessed in the roots of the inoculated greenhouse-grown plants. Mycorrhizal roots sampled from four host plants were washed and examined using stereomicroscope to determine the presence and pattern of the mycorrhizal system. Subsequently, root pieces (1 cm) cleared according to Phillips and Hayman (1970) method with 10 % potassium hydroxide solution, and stained with 0.1 % anilin blue in lactic acid (Grace and Stribley 1991). Fifty stained root pieces were selected randomly from each mycorrhizal plant, mounted in lactoglycerol (v/v), and examined under light microscope (Trouvelot et al., 1986). The percentage of root colonization was determined using the F %=100 Nʹ/N formula. Where Nʹ is the number of positive root segments and N is the total number of root of segments observed (Biermann and Linderman 1981).
Plant growth
For each host plant, 20 randomly sampled seedlings were harvested, of which 10 were not inoculated and 10 were inoculated with T. pinoyi. The growth of inoculated and non-inoculated seedlings was estimated by measurements of their plant fresh weight, plant dry weight, root fresh weight, root dry weight, shoot fresh weight, shoot dry weight, plant height, root height, and shoot height. For the measurements of the dry weight of root and shoot, the samples were oven-dried 60 °C for 72 h. Chlorophyll contents were measured by a chlorophyll meter (SPAD-502 Minolta, Japan). The relative mycorrhizal dependency (RMD) were also measured according to Plenchette et al. (1983).
Extraction of DNA
Total genomic DNA was extracted from 50 mg of T. pinoyi ascocarps using the Cetyl- rimethyl-ammonium-bromide (CTAB) method (Gardes and Bruns 1993). Infested root samples (100 mg) from greenhouse inoculated plants were ground in liquid nitrogen, and DNA was extracted using the CTAB‐based protocol of Lekgari (2010) with some modification. DNA purity and quality of the DNA extracts were determined spectrophotometrically (MaestroNano Pro) and by agarose gel electrophoresis according to standard procedures (Sambrooke et al. 1989).
Designing of Tirmania pinoyi specific primers
The primers were designed using ITS sequence of T. pinoyi(GenBank accession No. OM439630). The target sequence was compared with that from other desert truffles species including T. pinoyiby using software BioEdit v7.0.5 (Hall 2005). The forward primer (FTiPi) 5′-CCATCTTCCAAAACCTTGATTG-3′ (nucleotide positions 112-133), and the reverse primer (RTiPi) 5′-GAATTTCTGAAGGACGACTCTG-3′ (nucleotide positions 390-411) were designed to amplify 5.8S ITS region of rDNA of T. pinoyi. Selected primers were checked in silico by searching against the non redundant sequences from other organisms via Primer-BLAST tool (https://www.ncbi.nlm.nih.gov/ tools/primer-blast) of National Center for Biotechnology Information (NCBI) with default parameters (Ye et al. 2012) in GenBank. Primers then evaluated for criteria such as G-C content, hairpin formation, melting temperature, self-annealing, and self-dimerization using OLIGO 7 Primer Analysis Software (Rychlik 2007). These primers were used for the second round of amplification during nested PCR.
Nested PCR
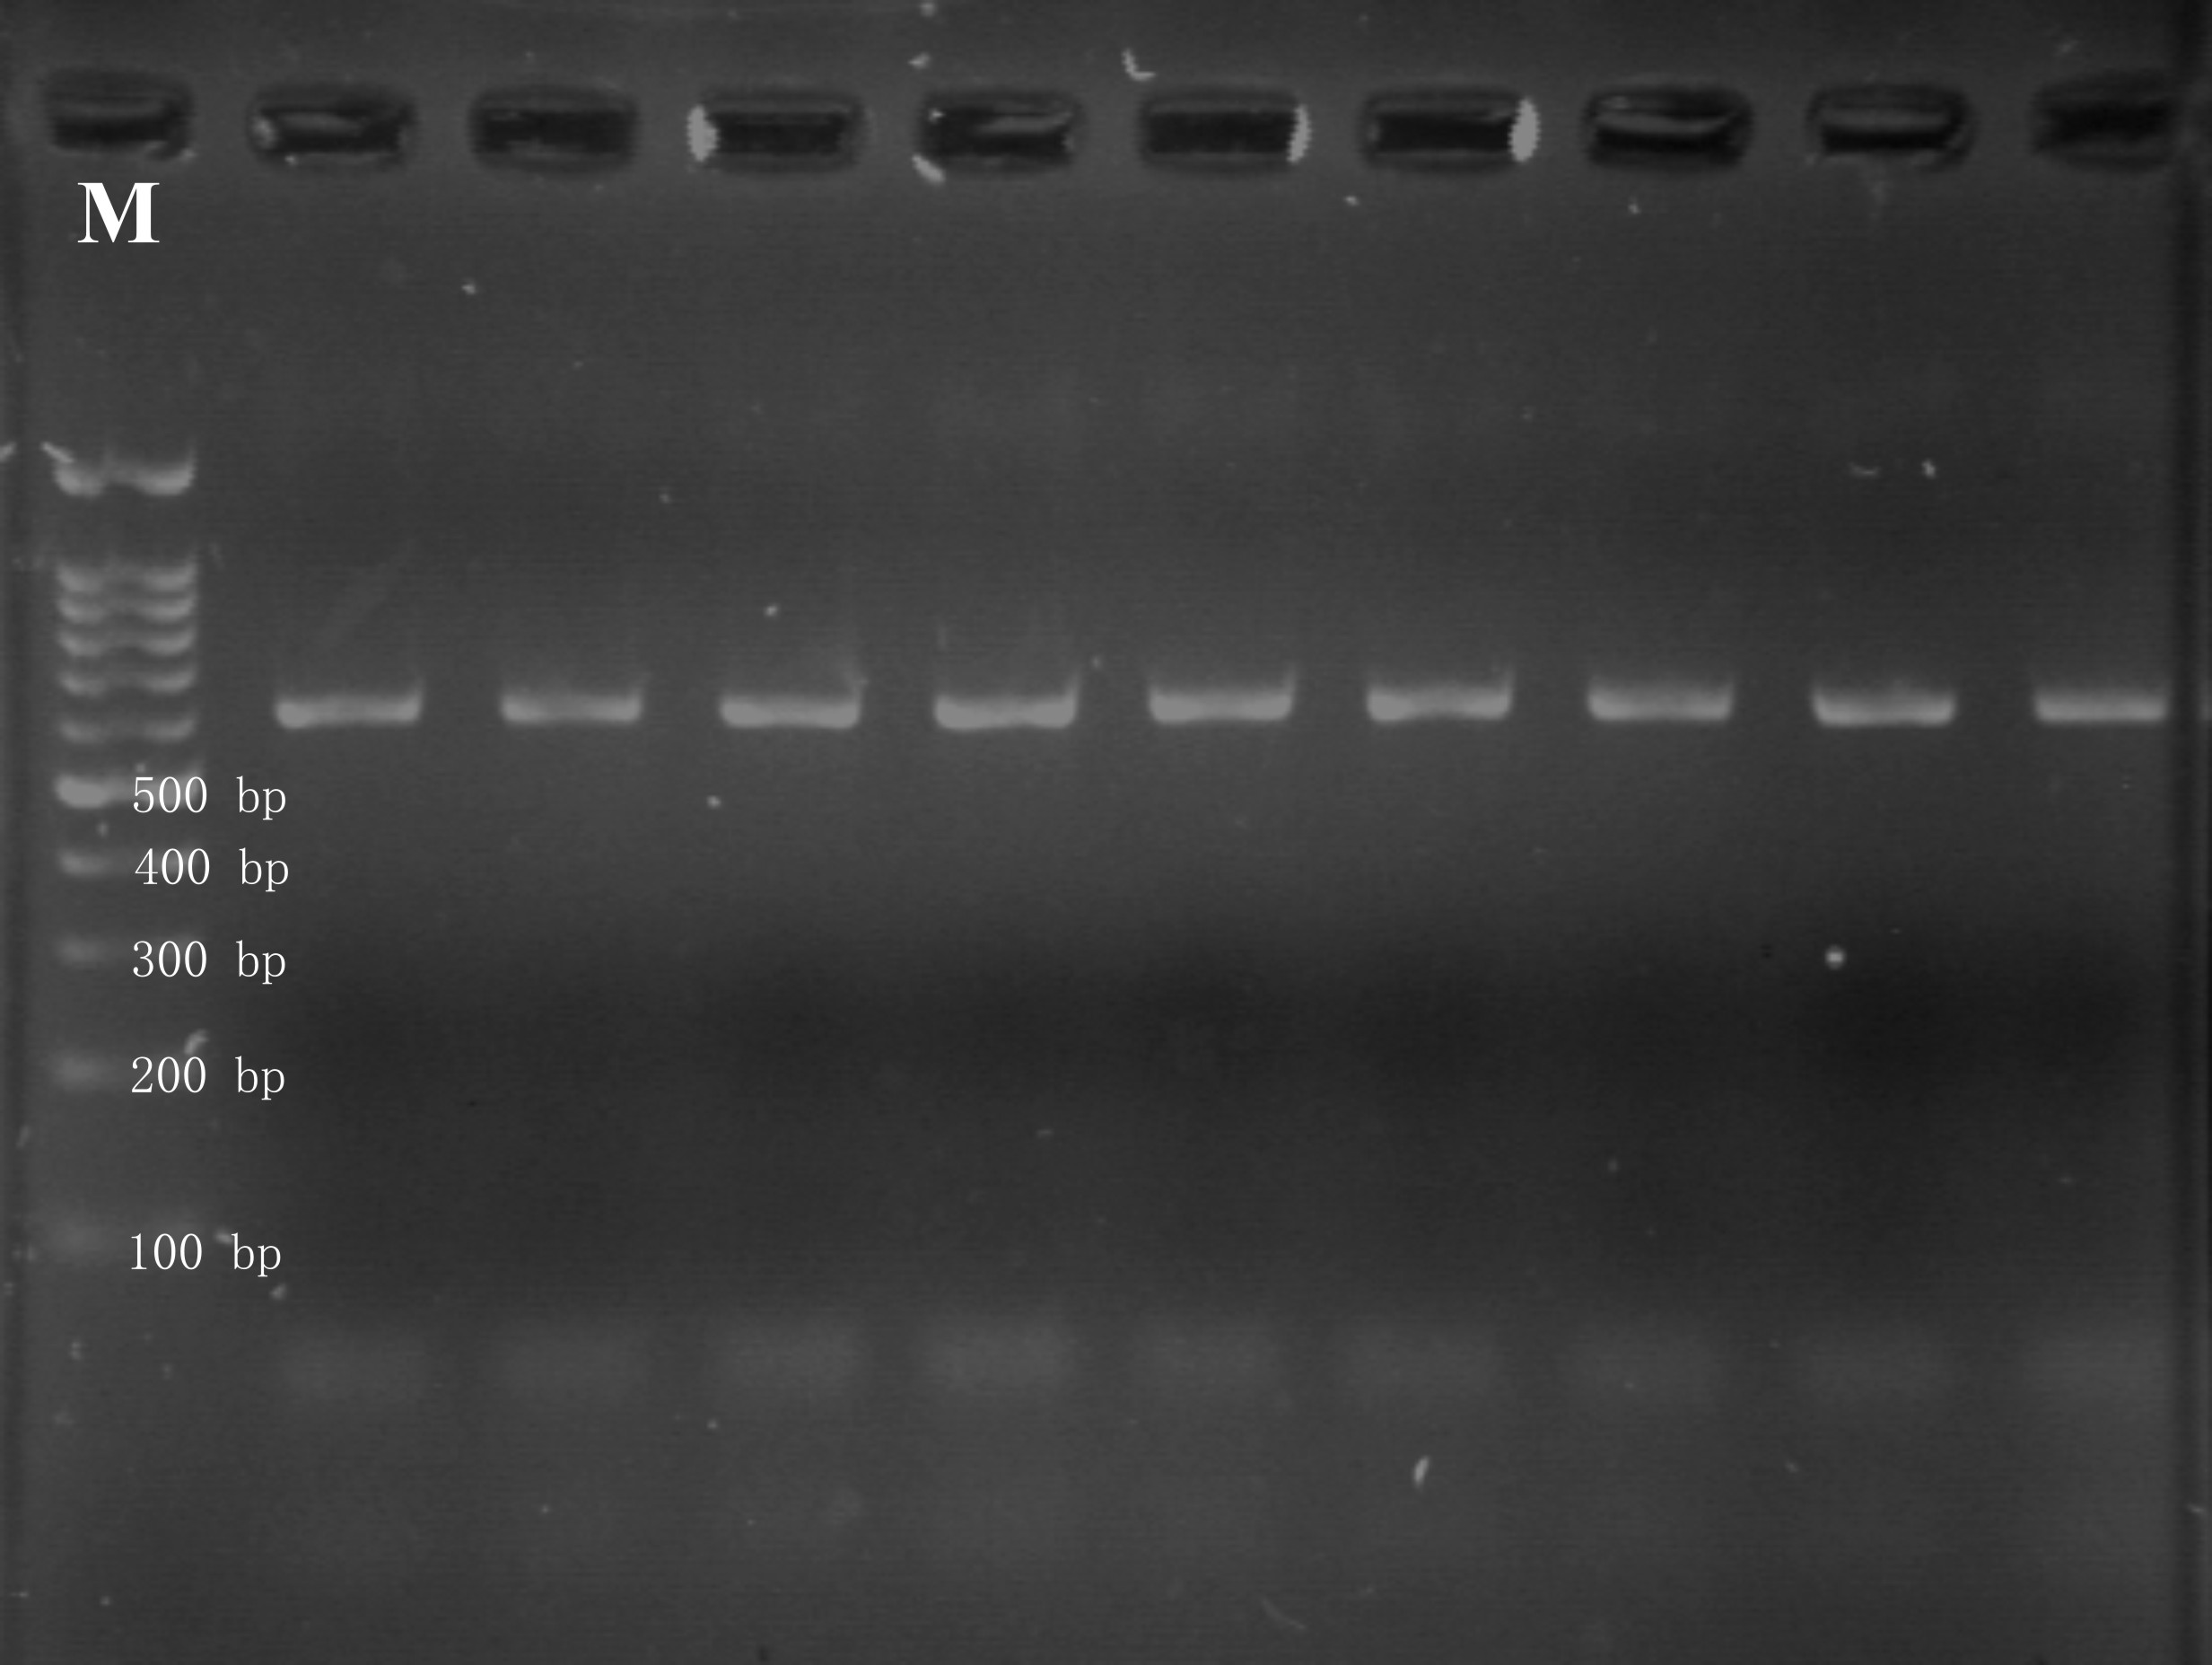
First round of nested PCR was performed with universal primers ITS1 (5´-TCCGTAGGTGAACCTGCGG-3′) and ITS4 (5´-TCCTCCGCTTATTGATATGC-3′) (White et al. 1990). The amplification was performed in PCR tube containing 2.5 μl of 10× polymerase reaction buffer (CinnaGen, Iran), 2.5 mM of MgCl2, 20 pmol of each of ITS1 and ITS4 primers, 1.25 nmol of each deoxynucleotide, 5 U Taq DNA polymerase and 2.5 μl of a diluted genomic DNA. The final volume of the reaction mixture was made up to 25 μl with sterile distilled water. The optimized thermocycler conditions for the reaction were initial denaturation at 95 °C for 2 min, 30 cycles at 95 °C for 30 s, 55 °C for 40 s, 72 °C for 60 s and final extension at 72 °C for 10 min. The second round of amplification was carried out using same final concentration of the reagents as described above, except replacing the DNA template with 0.5 μl PCR product from the first round of amplification. The thermocycler conditions were also kept the same program. The amplification results were visualized through electrophoresis using 1% agarose gel in 1× TAE buffer for 45 min at 90 V with 100 bp DNA ladder (CinnaGen, Iran). The controls, with no DNA, were included in every set of amplification to check the DNA contamination in reagents and reaction buffers.
Specificity and Sensitivity Assay
Specificity of the FTiPi and RTiPi primer pair for the detection of T. pinoyi was determined by using the genomic DNAs isolated from T. pinoyi and various morphologically and moleculary characterized desert truffles species and some other fungi (Ascotricha cartarum, Paecilomyces formosus, Neosctalidium novahollandiae, Biscogniauxia mediterranea, Fusarium oxysporum). The genomic DNAs isolated from these fungi were used as template for the nested PCR assay as described above. The sensitivity of the nested PCR for the detection of T. pinoyi was evaluated by using the different concentrations (100 ngml−1 to 10 fgml−1) of genomic DNA as template.
Detection of T. pinoyi in the inoculated plants
In order to detect T. pinoyi, the genomic DNA was isolated from the artificially inoculated and healthy plants by using the above mentioned method and amplified using FTiPi and R TiPi primers both directly and as internal primers for nested-PCR. The nested PCR was performed as described above. The genomic DNA from the T. pinoyi was used as positive control in all the experiments. In negative control, genomic DNA was replaced with sterile distilled water.